

Identification of a nomogram based on an 8-lncRNA signature as a novel diagnostic biomarker for head and neck squamous cell carcinoma
- PMID: 33091878
- PMCID: PMC7655182
- DOI: 10.18632/aging.104014
Identification of a nomogram based on an 8-lncRNA signature as a novel diagnostic biomarker for head and neck squamous cell carcinoma
Abstract
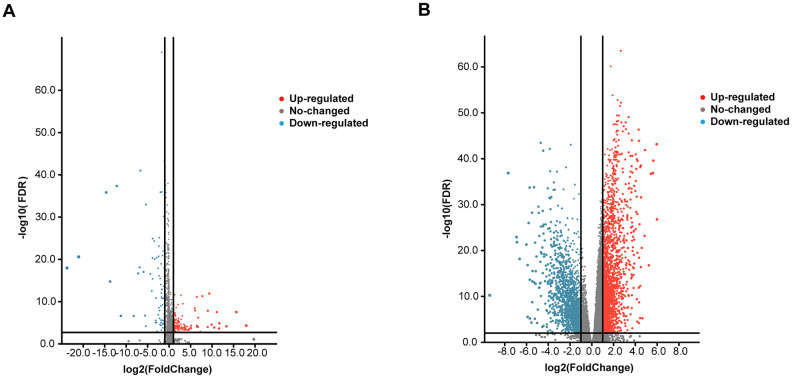
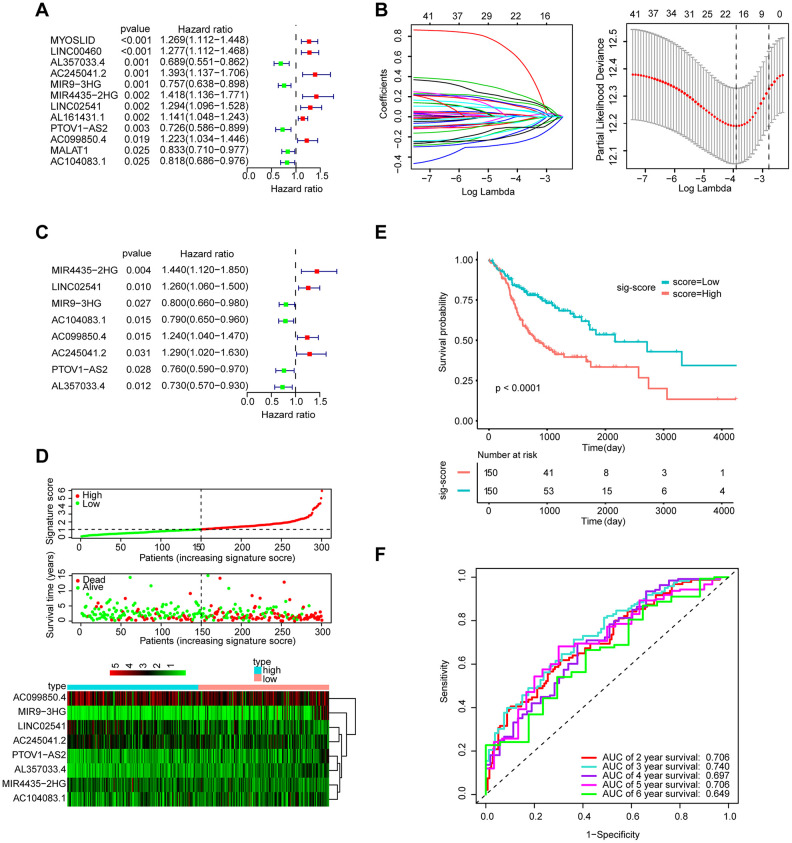
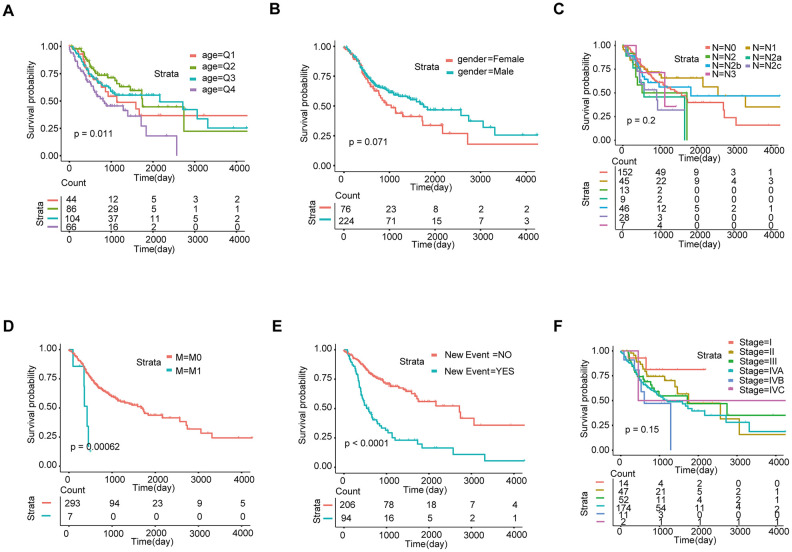
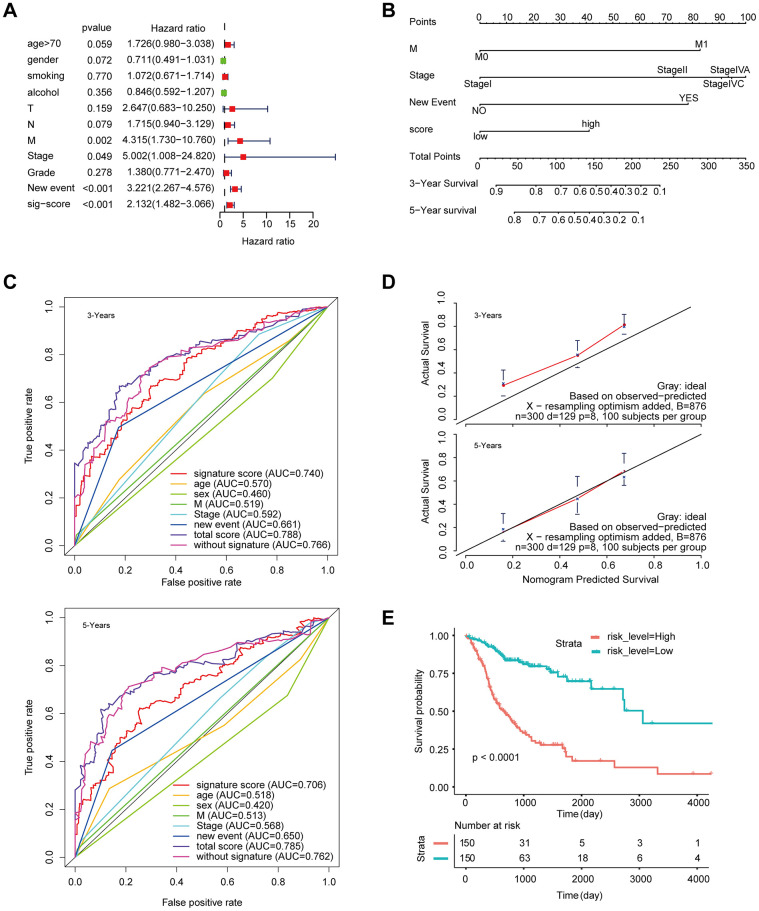
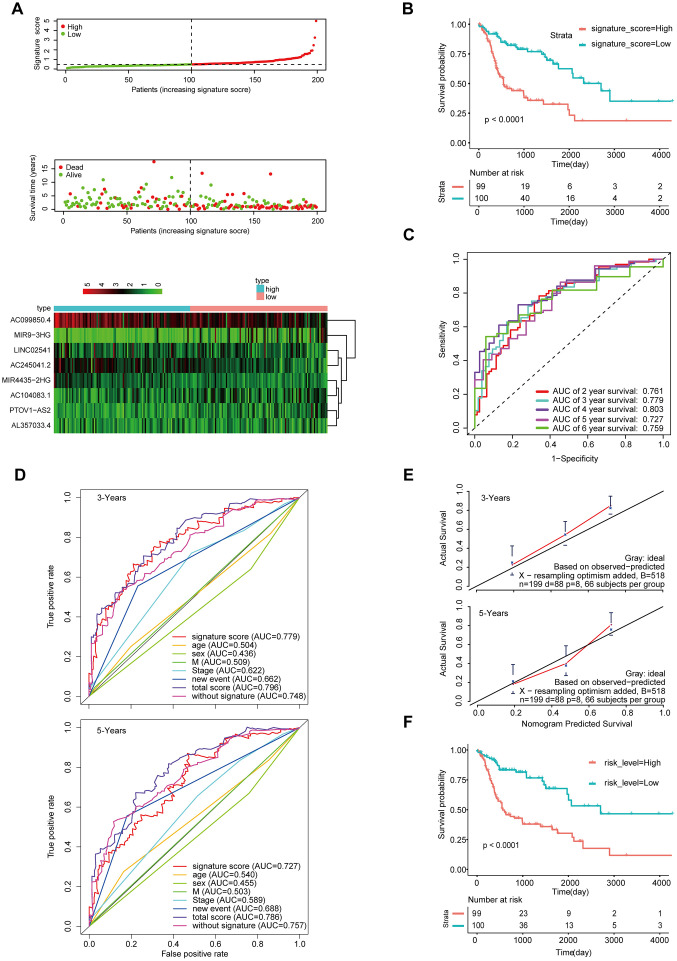
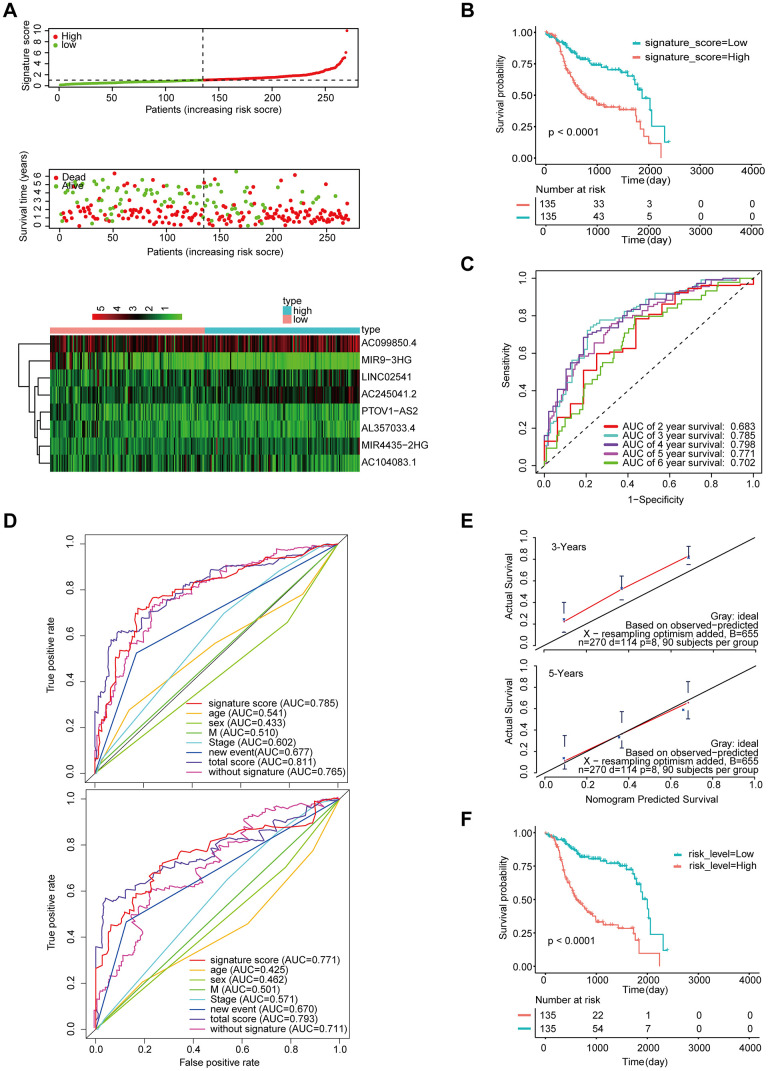
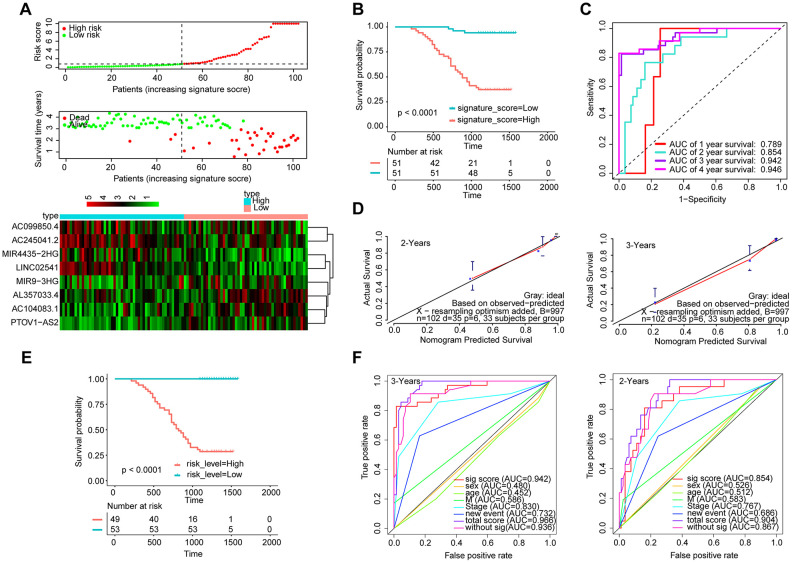
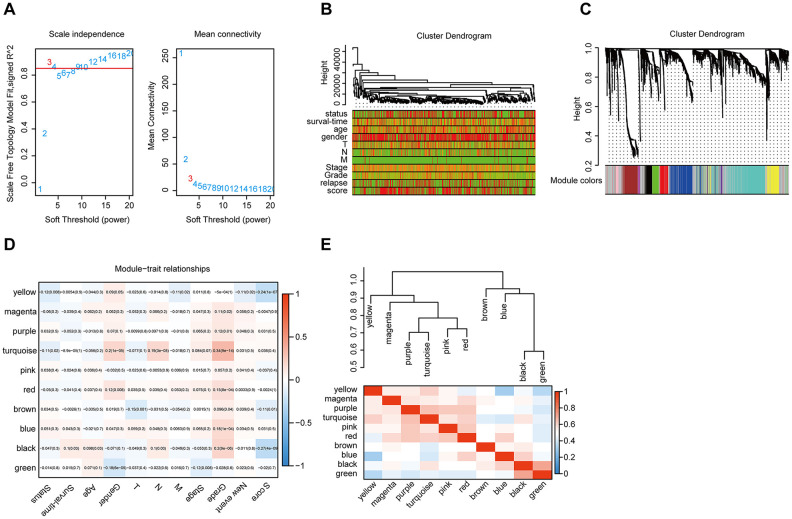
Long noncoding RNAs (lncRNAs) have been proposed as diagnostic or prognostic biomarkers of head and neck squamous carcinoma (HNSCC). The current study aimed to develop a lncRNA-based prognostic nomogram for HNSCC. LncRNA expression profiles were downloaded from The Cancer Genome Atlas (TCGA) database. After the reannotation of lncRNAs, the differential analysis identified 253 significantly differentially expressed lncRNAs in training set TCGA-HNSC (n = 300). The prognostic value of each lncRNA was first estimated in univariate Cox analysis, and 41 lncRNAs with P < 0.05 were selected as seed lncRNAs for Cox LASSO regression, which identified 11 lncRNAs. Multivariate Cox analysis was used to establish an 8-lncRNA signature with prognostic value. Patients in the high-signature score group exhibited a significantly worse overall survival (OS) than those in the low-signature score group, and the area under the receiver operating characteristic (ROC) curve for 3-year survival was 0.74. Multivariable Cox regression analysis among the clinical characteristics and signature scores suggested that the signature is an independent prognostic factor. The internal validation cohort, external validation cohort, and 102 HNSCC specimens quantified by qRT-PCR successfully validate the robustness of our nomogram.
Keywords: bioinformatics; head and neck squamous carcinoma; long noncoding RNAs; prognosis; qRT-PCR.
Conflict of interest statement
Figures
Similar articles
-
A pyroptosis-related lncRNA signature predicts prognosis and immune microenvironment in head and neck squamous cell carcinoma.Int Immunopharmacol. 2021 Dec;101(Pt B):108268. doi: 10.1016/j.intimp.2021.108268. Epub 2021 Oct 20. Int Immunopharmacol. 2021. PMID: 34688154
-
An immune-related seven-lncRNA signature for head and neck squamous cell carcinoma.Cancer Med. 2021 Apr;10(7):2268-2285. doi: 10.1002/cam4.3756. Epub 2021 Mar 3. Cancer Med. 2021. PMID: 33660378 Free PMC article.
-
A Prognostic 5-lncRNA Expression Signature for Head and Neck Squamous Cell Carcinoma.Sci Rep. 2018 Oct 15;8(1):15250. doi: 10.1038/s41598-018-33642-1. Sci Rep. 2018. PMID: 30323196 Free PMC article.
-
Exploring the role of long noncoding RNAs in autophagy and cuproptosis processes via immune pathways in head and neck squamous carcinoma: A systematic review of the literature.Medicine (Baltimore). 2024 Aug 23;103(34):e39335. doi: 10.1097/MD.0000000000039335. Medicine (Baltimore). 2024. PMID: 39183398 Free PMC article.
-
Unraveling the oral cancer lncRNAome: Identification of novel lncRNAs associated with malignant progression and HPV infection.Oral Oncol. 2016 Aug;59:58-66. doi: 10.1016/j.oraloncology.2016.05.014. Oral Oncol. 2016. PMID: 27424183 Free PMC article. Review.
Cited by
-
The Prognostic Signature of Head and Neck Squamous Cell Carcinoma Constructed by Immune-Related RNA-Binding Proteins.Front Oncol. 2022 Apr 5;12:795781. doi: 10.3389/fonc.2022.795781. eCollection 2022. Front Oncol. 2022. PMID: 35449571 Free PMC article.
-
Construction of a Novel LncRNA Signature Related to Genomic Instability to Predict the Prognosis and Immune Activity of Patients With Hepatocellular Carcinoma.Front Immunol. 2022 Apr 8;13:856186. doi: 10.3389/fimmu.2022.856186. eCollection 2022. Front Immunol. 2022. PMID: 35479067 Free PMC article.
-
Deciphering a proliferation-essential gene signature based on CRISPR-Cas9 screening to predict prognosis and characterize the immune microenvironment in HNSCC.BMC Cancer. 2025 Apr 22;25(1):756. doi: 10.1186/s12885-025-14181-1. BMC Cancer. 2025. PMID: 40264050 Free PMC article.
-
Identification of lncRNA Signature of Tumor-Infiltrating T Lymphocytes With Potential Implications for Prognosis and Chemotherapy of Head and Neck Squamous Cell Carcinoma.Front Pharmacol. 2022 Feb 15;12:795205. doi: 10.3389/fphar.2021.795205. eCollection 2021. Front Pharmacol. 2022. PMID: 35242027 Free PMC article.
-
High expression of CD52 in adipocytes: a potential therapeutic target for obesity with type 2 diabetes.Aging (Albany NY). 2021 Mar 11;13(8):11043-11060. doi: 10.18632/aging.202714. Epub 2021 Mar 11. Aging (Albany NY). 2021. PMID: 33705353 Free PMC article.
References
Publication types
MeSH terms
Substances
LinkOut - more resources
Full Text Sources
Medical
