. 2020 Oct 20;12(10):3056.
doi: 10.3390/cancers12103056.

Contribution of miRNAs, tRNAs and tRFs to Aberrant Signaling and Translation Deregulation in Lung Cancer

Affiliations

Contribution of miRNAs, tRNAs and tRFs to Aberrant Signaling and Translation Deregulation in Lung Cancer

Ilias Skeparnias et al. Cancers (Basel). .

Abstract

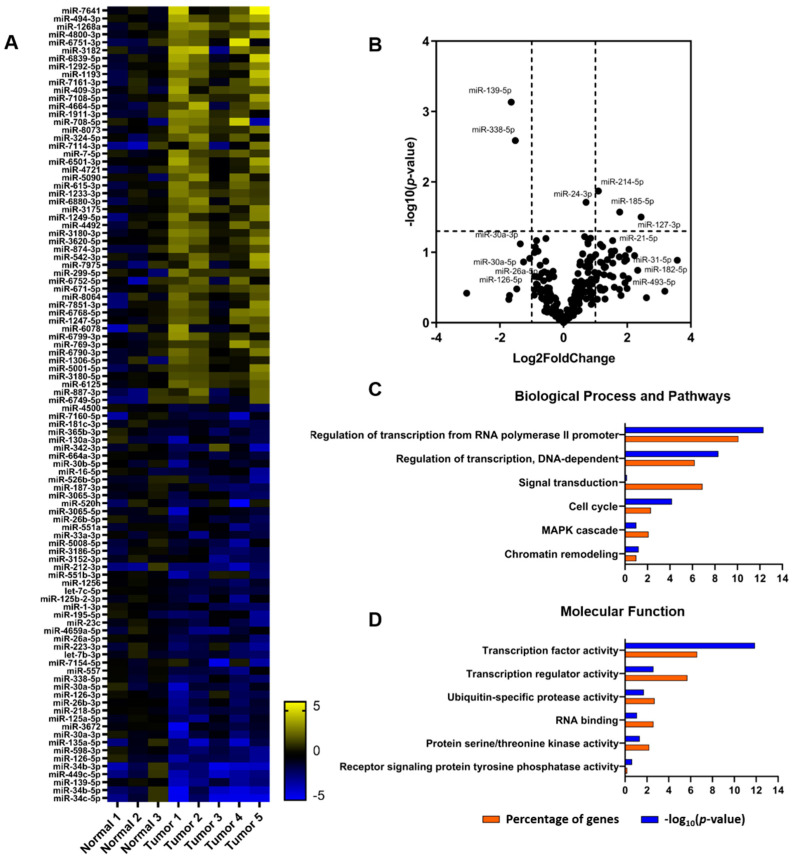
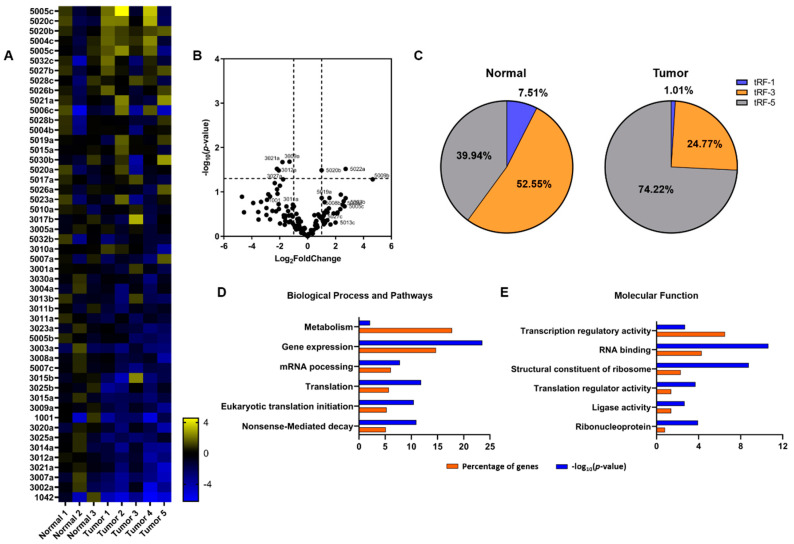
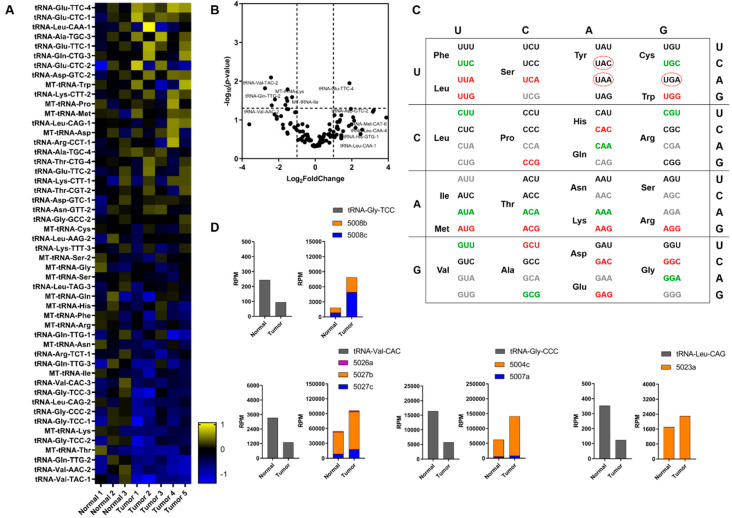
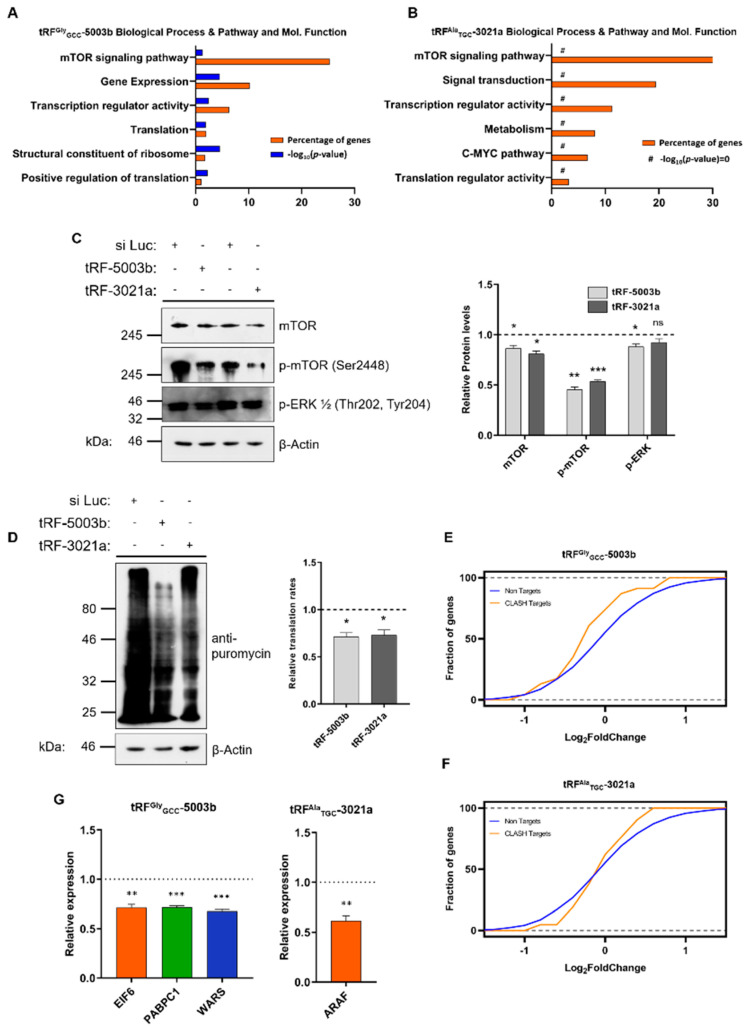
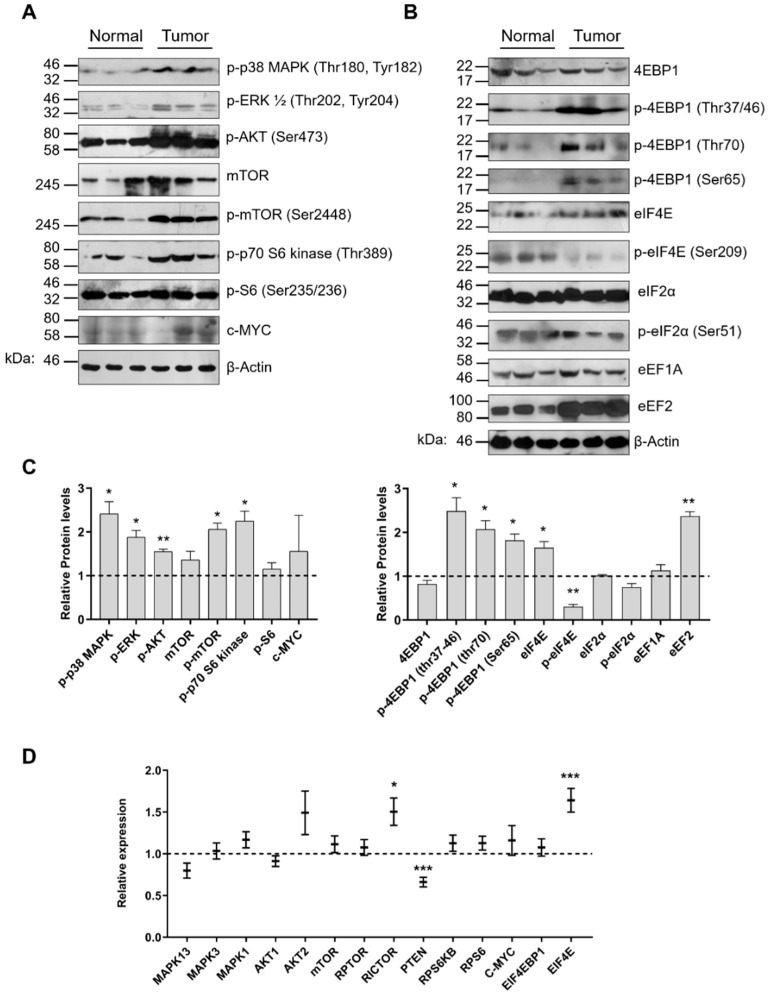
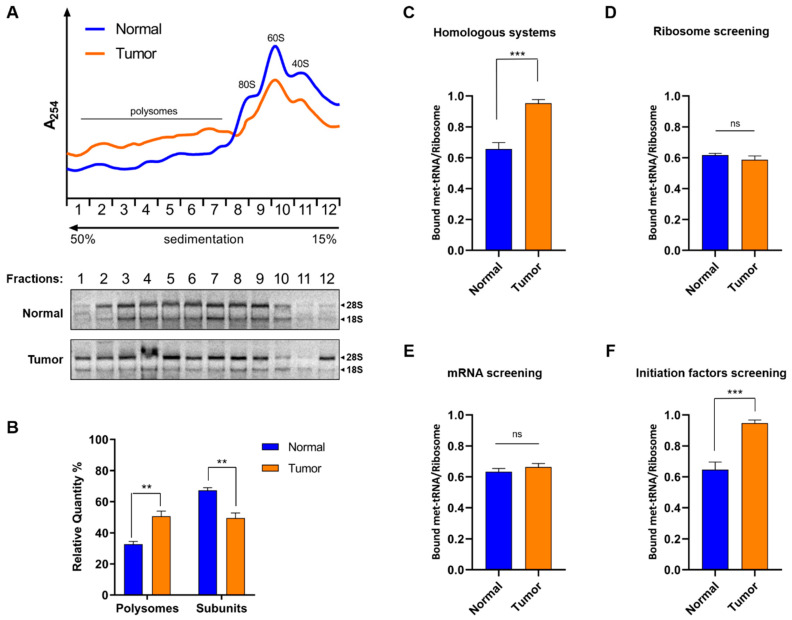
Transcriptomics profiles of miRNAs, tRNAs or tRFs are used as biomarkers, after separate examination of several cancer cell lines, blood samples or biopsies. However, the possible contribution of all three profiles on oncogenic signaling and translation as a net regulatory effect, is under investigation. The present analysis of miRNAs and tRFs from lung cancer biopsies indicated putative targets, which belong to gene networks involved in cell proliferation, transcription and translation regulation. In addition, we observed differential expression of specific tRNAs along with several tRNA-related genes with possible involvement in carcinogenesis. Transfection of lung adenocarcinoma cells with two identified tRFs and subsequent NGS analysis indicated gene targets that mediate signaling and translation regulation. Broader analysis of all major signaling and translation factors in several biopsy specimens revealed a crosstalk between the PI3K/AKT and MAPK pathways and downstream activation of eIF4E and eEF2. Subsequent polysome profile analysis and 48S pre-initiation reconstitution experiments showed increased global translation rates and indicated that aberrant expression patterns of translation initiation factors could contribute to elevated protein synthesis. Overall, our results outline the modulatory effects that possibly correlate the expression of important regulatory non-coding RNAs with aberrant signaling and translation deregulation in lung cancer.

Keywords: lung cancer; miRNAs; signaling; tRFs; tRNAs; translation.


Conflict of interest statement

The authors declare no conflict of interest.

Figures

Figure 1
Figure 1
Expression profile of miRNAs in lung cancer. (A) Heatmap of the 100 most altered miRNAs in NSCLC. The analysis was performed in 3 normal and 5 tumor tissue specimens (Patient information is described in Table S1). The heatmap was constructed based on the log2 fold change values and normal samples are shown after normalization of individual samples versus the mean of RPM. Yellow and blue colors indicate up- and down- regulation, respectively. (B) Volcano plot of all miRNAs assessed in the present analysis. The volcano plot displays the relationship between fold change and significance using a scatter plot view. A higher value indicates greater significance in the y-axis and the x-axis illustrates the difference in expression levels of miRNAs. (C,D) GO enrichment analysis on the predicted targets of the statistically significant altered miRNAs. Top pathways in “Biological Process and Pathways” and “Molecular Function” are shown as percentage of genes (orange) and p-value (blue), respectively.
Figure 2
Figure 2
Expression profile of tRFs. (A) Heatmap of the 50 most altered tRFs. The analysis was performed in 3 normal and 5 tumor tissue specimens (Table S7). The heatmap was constructed based on the log2 fold change values and normal samples are shown after normalization of individual samples versus the mean of RPM. Yellow and blue colors indicate up- and down- regulation, respectively. (B) Volcano plot of the differentially expressed tRFs. (C) Distribution of tRF-1, tRF-3 and tRF-5 groups in normal and tumor specimens. (D,E) GO enrichment analysis on the predicted targets of the statistically significant altered tRFs. Top pathways in “Biological Process and Pathway” and “Molecular Function” are shown as percentage of genes (orange) and p-value (blue), respectively.
Figure 3
Figure 3
Expression profile of tRNAs. (A) Heatmap of the most altered tRNAs. The analysis was performed in 8 samples (5 tumor and 3 normal tissue specimens, Table S7). The heatmap was constructed based on the log2 fold change values and normal samples are shown after normalization of individual samples versus the mean of RPM. Yellow and blue colors indicate up- and down- regulation, respectively. (B) Volcano plot of the detected tRNAs assessed in the present analysis. (C) Expression pattern of tRNAs grouped in 64 codons. Red color denotes up-regulation and green color denotes down-regulation. Grey color denotes tRNAs that remain relatively unaltered and black color denotes tRNAs that were not identified in the present analysis. Stop codons are indicated in black color and red circles. (D) Representative downregulated tRNAs in tumor specimens and their reciprocal correlation with tRNA fragments that derive from those tRNAs.
Figure 4
Figure 4
Effect of tRFGlyGCC-5003b and tRFAlaTGC-3021a on signaling and translation. (A,B) GO enrichment analysis of genes exhibiting statistically significant expression alternations after transfection of tRFGlyGCC-5003b and tRFAlaTGC-3021a in A549 lung adenocarcinoma cell line. Enriched pathways in “Biological Process & Pathway and Mol. Functions” are shown as percentage of genes (orange) and p-value (blue), respectively [#: −log10(p-value) = 0]. (C) Effects of tRF-5003b and tRF-3021a on signaling effectors and translation rates. Western blot analysis of the signaling kinases mTOR and ERK1/2 after transfection with si Luciferase (si Luc), tRF-5003b or tRF-3021a. Phosphorylated residues numbers are indicated. Quantitation of protein levels was performed after normalization to β-actin levels. Changes in phospho-ERK1/2 were quantified by summing the intensities of the two phosphorylated forms (ERK1 and ERK2). (D) Non-radioactive measurement of translation rates after assessment of the levels of puromycylated nascent peptides by Western blot. Quantitation of puromycylated peptides levels was performed after normalization to β-actin levels. (E) Cumulative distribution function (CDF) plots showing the repression of tRFGlyGCC-5003b and (F) tRFAlaTGC-3021a targets upon transfection of both tRFs in A549 lung adenocarcinoma cell line. Orange line represents the expression level of each high score predicted gene target in comparison to non-target genes (blue line). (G) RT-qPCR analysis of EIF6, PABPC1, WARS and ARAF expression after tRF-5003b and tRF-3021a transfection of A549 lung adenocarcinoma cell line respectively. Unpaired t test was used for the statistical analysis and asterisks represent p-values (* p < 0.05; ** p < 0.01; *** p < 0.001; ns, not significant).
Figure 5
Figure 5
Alterations of PI3K/AKT/mTOR pathway, MAPK pathway, translation initiation and elongation factors in lung cancer. (A,B) Western blot analysis of signaling kinases, translation initiation factors, binding proteins (phosphorylated or non-phosphorylated) and translation elongation factors. Phosphorylated residues numbers are indicated. (C) Quantitation of protein levels after normalization to β-actin levels. Changes in phospho-ERK1/2 were quantified by summing the intensities of the two phosphorylated forms (ERK1 and ERK2). Asterisks represent p-values after unpaired t test between the relative quantity of each protein in normal and tumor specimens (* p < 0.05; ** p < 0.01; *** p < 0.001). (D) RT-qPCR analysis of genes involved in translational regulation. Expression levels analyzed in 18 tumors and 12 normal tissue specimens (Table S7). All experiments were performed in triplicates, bar graphs represent mean ± SEM (error bars) and one-way Anova test was used for the statistical analysis.
Figure 6
Figure 6
Determination of translational efficiency in lung cancer. (A) Polysome profiling. Ribosomal particles isolated from either normal (blue line) or tumor (orange line) lung tissue specimens were homogenized in the presence of CHX and aliquots of the S30 fraction were analyzed on 15–50% sucrose gradients. The peaks corresponding to ribosomal subunits (40S, 60S and 80S) and the polysomes tail are indicated. (B) Relative quantity (%) of each peak corresponding to polysomes or free ribosomal subunits between normal (blue) and tumor (orange) specimens. (C) Reconstitution of 48S initiation ribosomal complex in the presence of initiator [3H]Met-tRNAiMet, endogenous 40S ribosomal subunits, crude translation factors and total mRNA. All components were isolated from the same tissue specimens, either normal (blue) or tumor (orange). (D) Assay of 40S ribosomal subunits from normal (blue) or tumor (orange) specimens, in the presence of translation factors, mRNA and initiator [3H]Met-tRNAiMet from normal tissue specimens. (E) Assay of mRNA from normal (blue) or tumor (orange) specimens in the presence of crude translation factors, 40S ribosomal subunits and initiator [3H]Met-tRNAiMet from normal tissues. (F) Assay of crude translation initiation factors from normal (blue) or tumor (orange) specimens in the presence of 40S ribosomal subunits, mRNA and initiator [3H]Met-tRNAiMet from normal tissues. All components tested, were isolated from the same specimen and experiments were performed in triplicates. Asterisks represent p-values after unpaired t test accomplishment between normal and tumor specimens (** p < 0.01; *** p < 0.001; ns, not significant).

Similar articles

Cited by

References

    1. Bracken C.P., Scott H.S., Goodall G.J. A network-biology perspective of microRNA function and dysfunction in cancer. Nat. Rev. Genet. 2016;17:719–732. doi: 10.1038/nrg.2016.134. - DOI - PubMed
    1. Slack F.J., Chinnaiyan A.M. The role of non-coding RNAs in oncology. Cell. 2019;179:1033–1055. doi: 10.1016/j.cell.2019.10.017. - DOI - PMC - PubMed
    1. Schimmel P. The emerging complexity of the tRNA world: Mammalian tRNAs beyond protein synthesis. Nat. Rev. Mol. Cell Biol. 2017;19:45–58. doi: 10.1038/nrm.2017.77. - DOI - PubMed
    1. Su Z., Wilson B., Kumar P., Dutta A. Noncanonical roles of tRNAs: tRNA fragments and beyond. Annu. Rev. Genet. 2020;54 doi: 10.1146/annurev-genet-022620-101840. - DOI - PMC - PubMed
    1. Xie Y., Yao L., Yu X., Ruan Y., Li Z., Guo J. Action mechanisms and research methods of tRNA-derived small RNAs. Signal Transduct. Target. Ther. 2020;5:109. doi: 10.1038/s41392-020-00217-4. - DOI - PMC - PubMed