. 2020 Oct 20;21(20):7767.
doi: 10.3390/ijms21207767.

Biological and Clinical Changes in a Pediatric Series Treated with Off-Label JAK Inhibitors

Affiliations

Biological and Clinical Changes in a Pediatric Series Treated with Off-Label JAK Inhibitors

Alessia Pin et al. Int J Mol Sci. .

Abstract

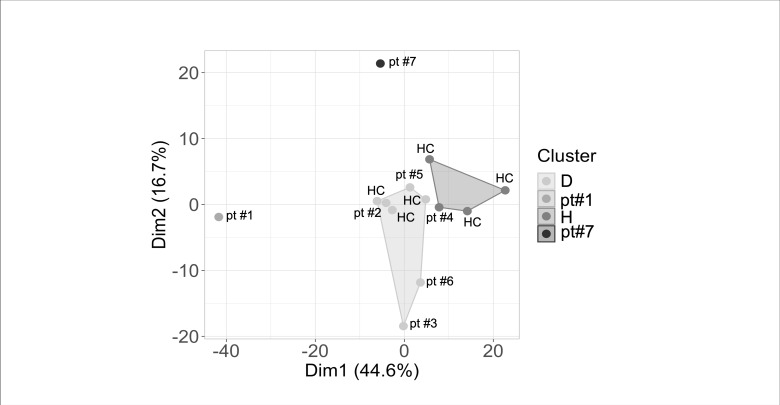
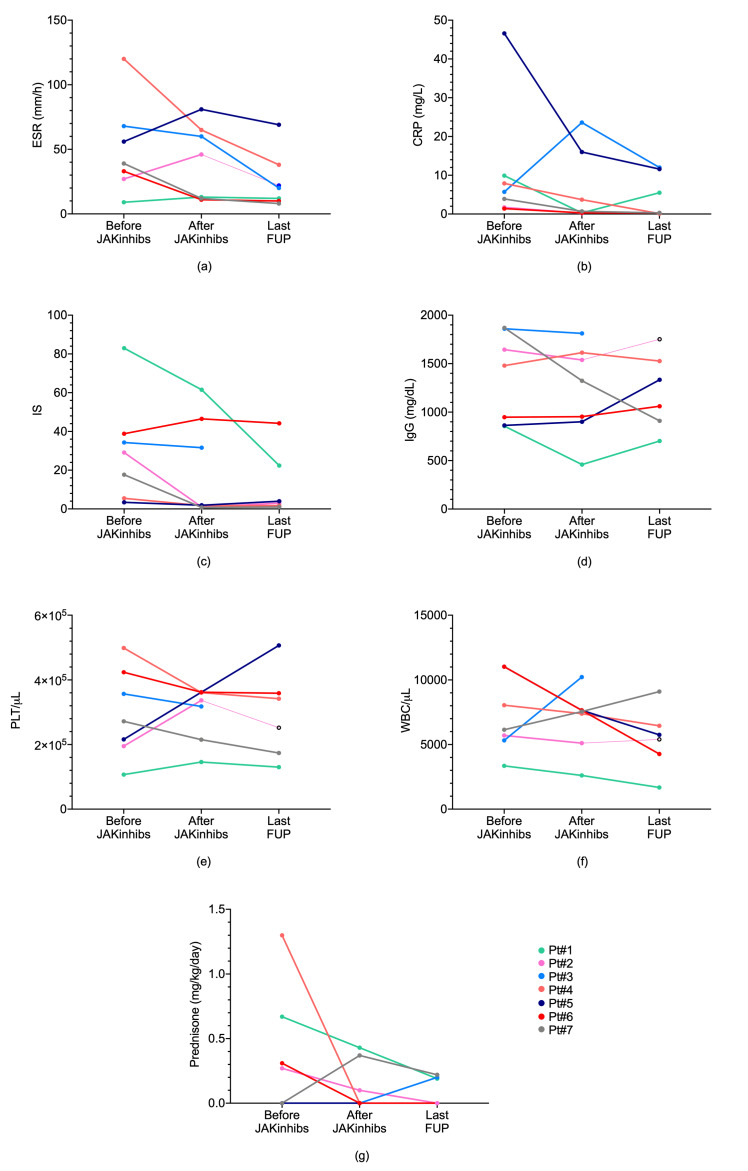
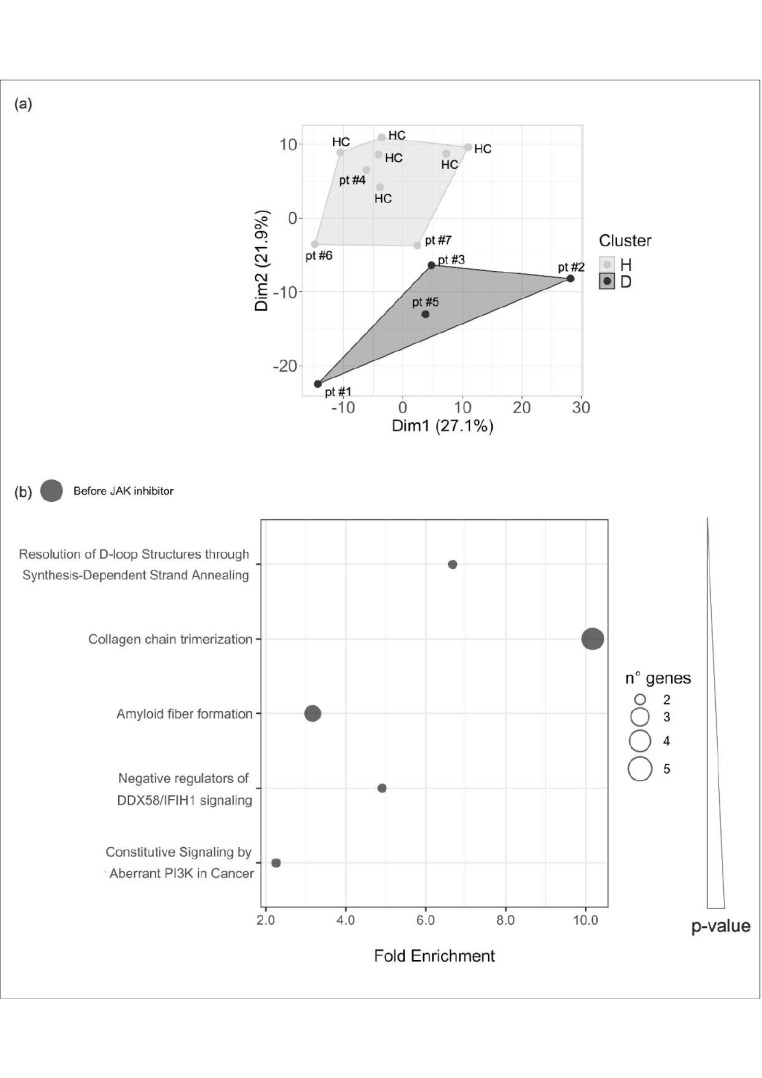
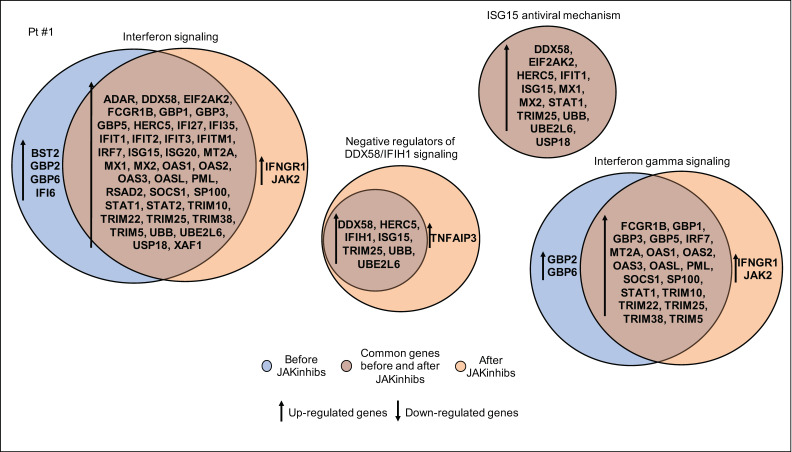
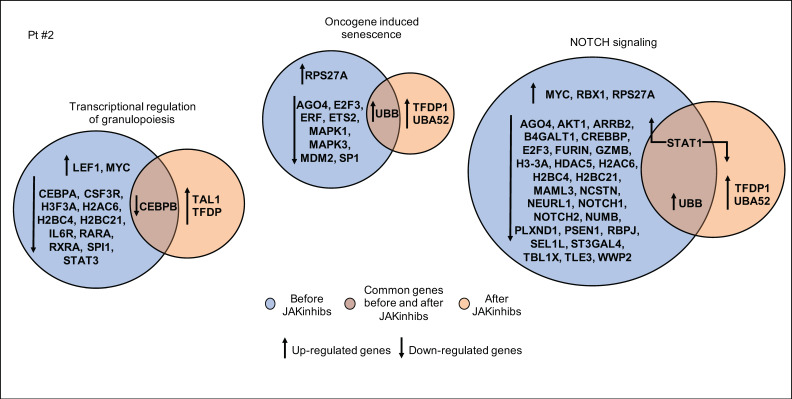
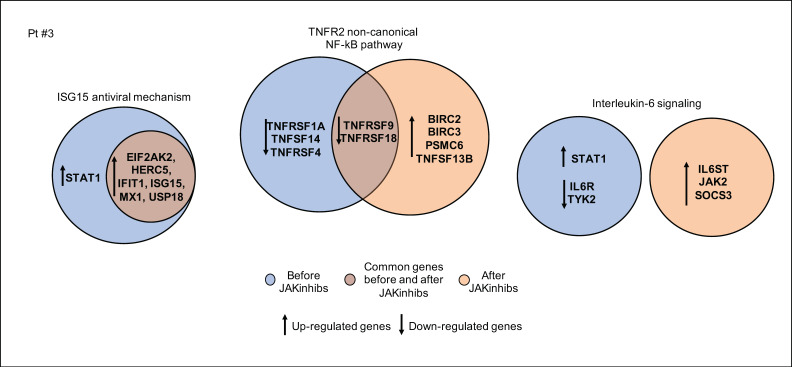
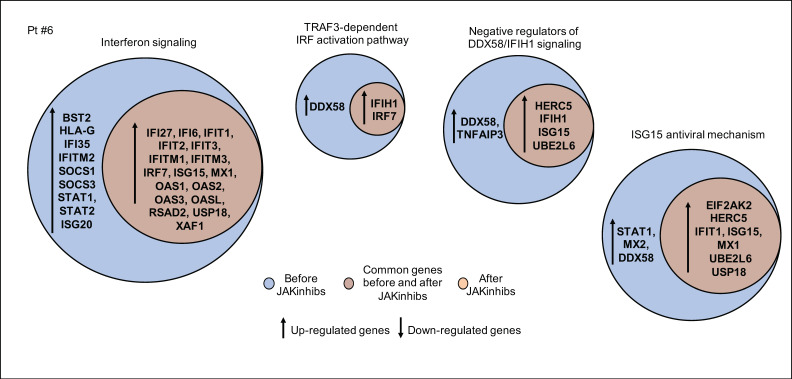
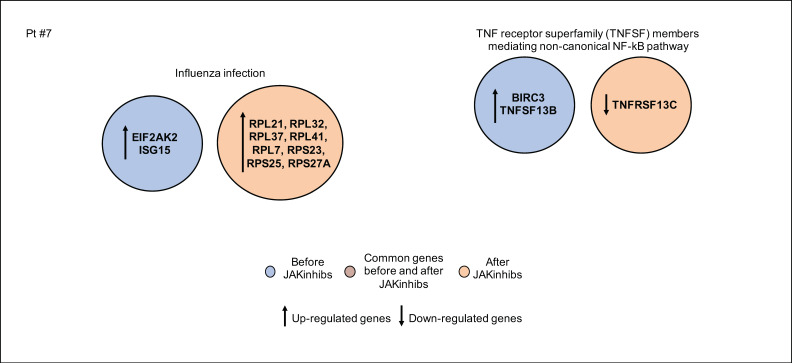
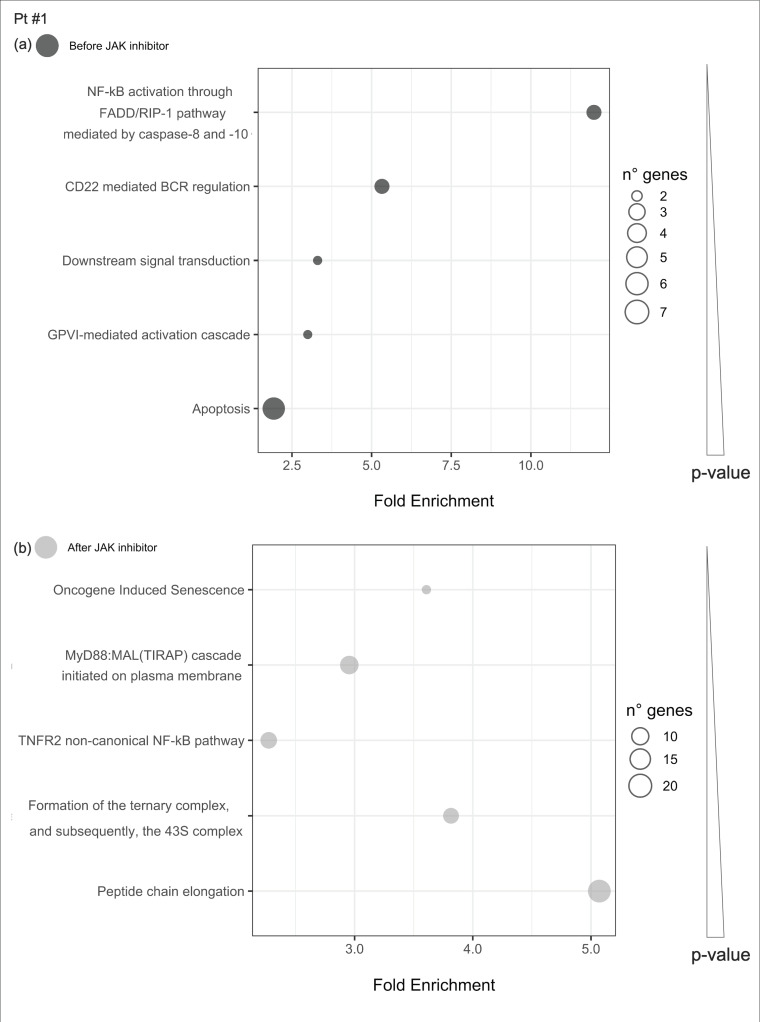
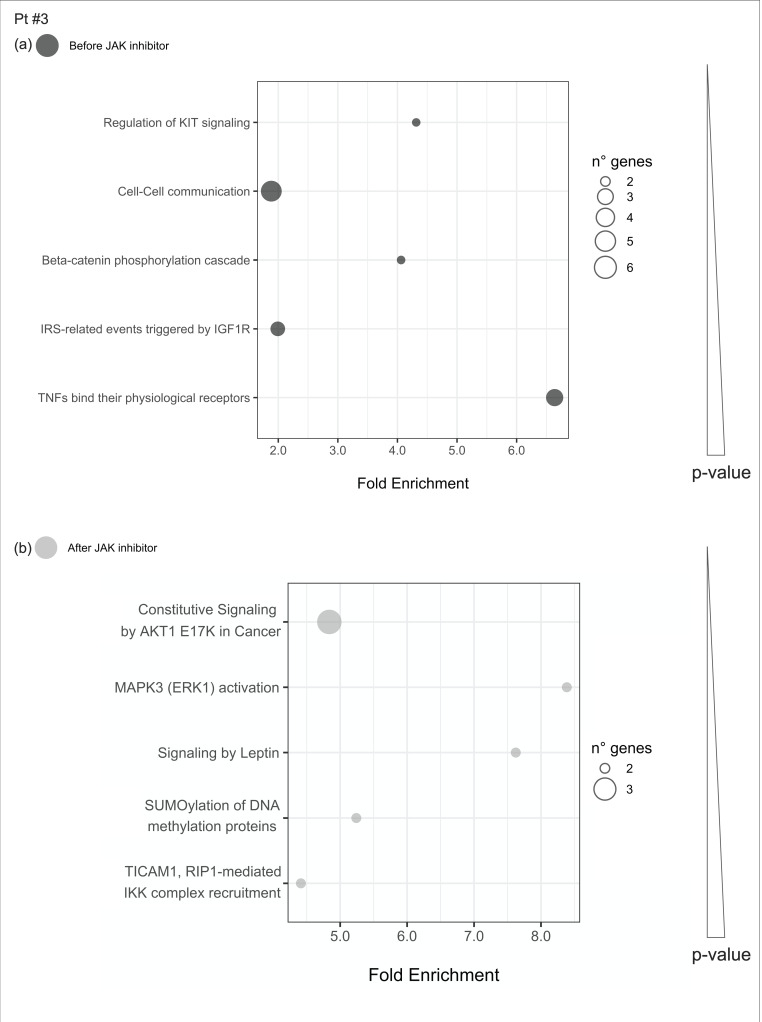
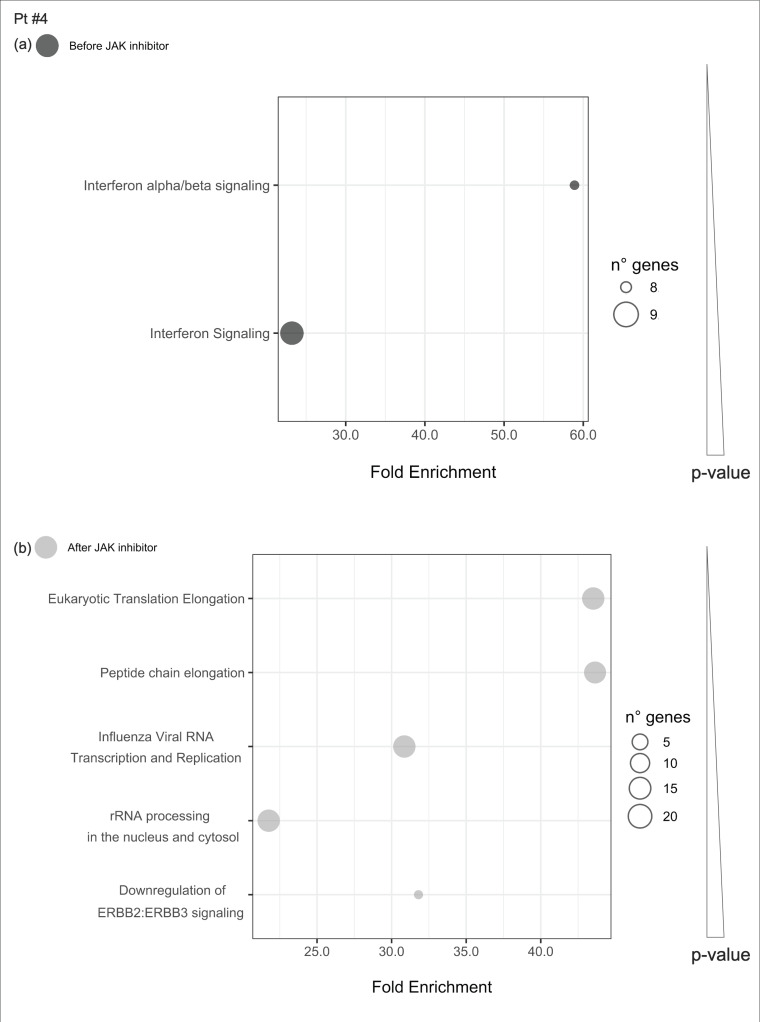
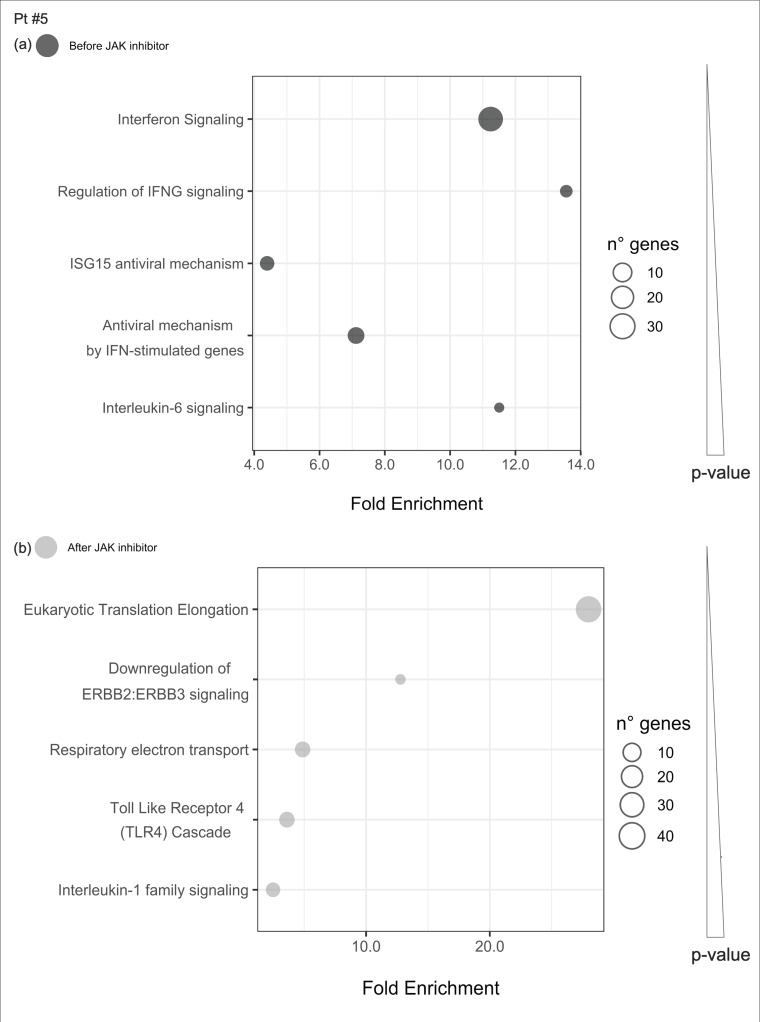
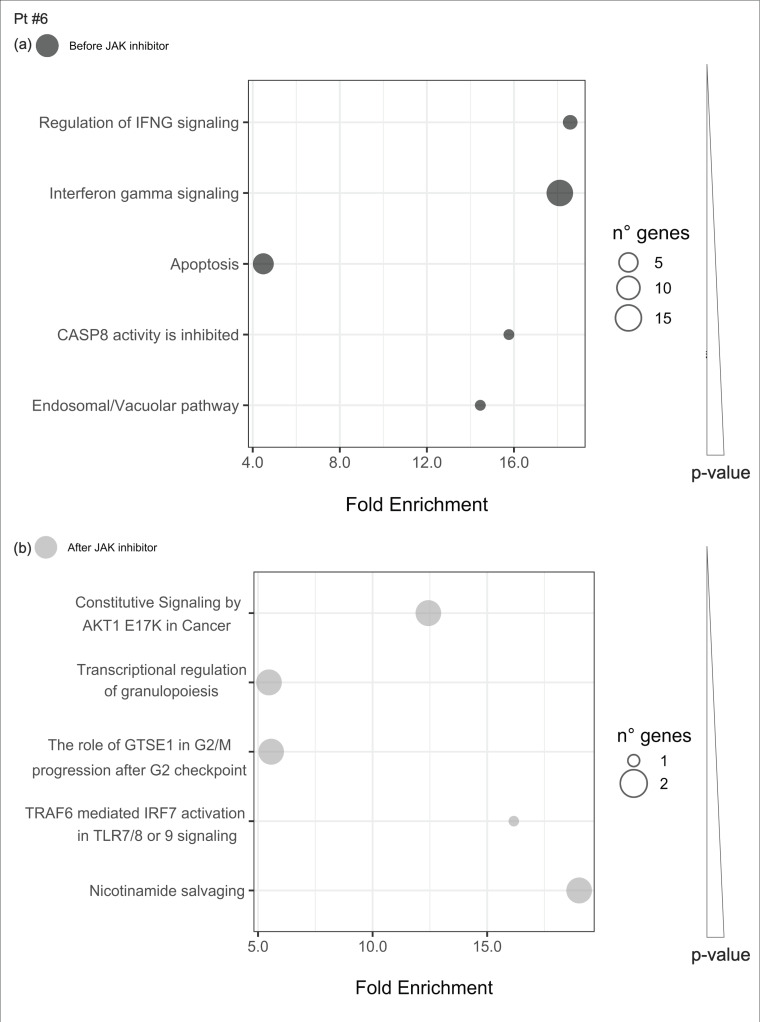
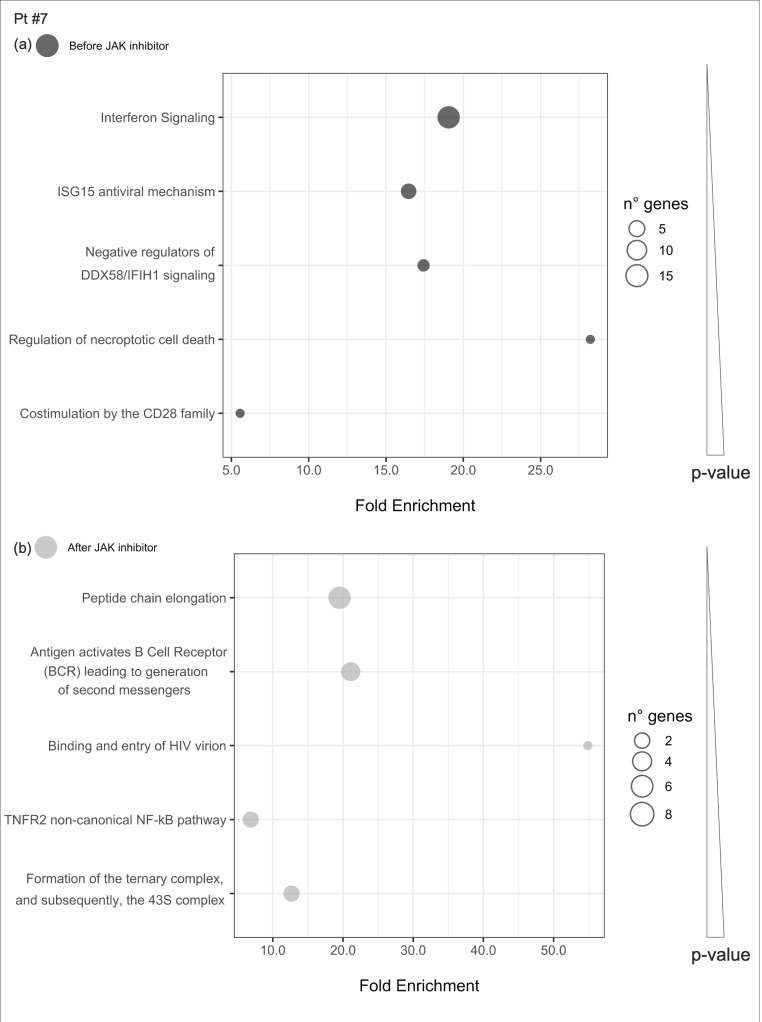
Off-label use of medications is still a common practice in pediatric rheumatology. JAK inhibitors are authorized in adults in the treatment of rheumatoid arthritis, psoriatic arthritis and ulcerative colitis. Although their use is not authorized yet in children, JAK inhibitors, based on their mechanism of action and on clinical experiences in small series, have been suggested to be useful in the treatment of pediatric interferon-mediated inflammation. Accordingly, an increased interferon score may help to identify those patients who might benefit of JAK inhibitors. We describe the clinical experience with JAK inhibitors in seven children affected with severe inflammatory conditions and we discuss the correlation between clinical features and transcriptomic data. Clinical improvements were recorded in all cases. A reduction of interferon signaling was recorded in three out of seven subjects at last follow-up, irrespectively from clinical improvements. Other signal pathways with significant differences between patients and controls included upregulation of DNA repair pathway and downregulation of extracellular collagen homeostasis. Two patients developed drug-related adverse events, which were considered serious in one case. In conclusion, JAK inhibitors may offer a valuable option for children with severe interferon-mediated inflammatory disorders reducing the interferon score as well as influencing other signal pathways that deserve future studies.

Keywords: Janus kinase inhibitors; interferon signature; juvenile idiopathic arthritis; juvenile systemic erythematosus lupus; juvenile systemic sclerosis; monogenic interferonopathies; off-label medications; pediatric rheumatology; transcriptomics.


Conflict of interest statement

Alberto Tommasini is involved in the I4V-MC-JAHV and I4V-MC-JAHU trials studying baricitinib in juvenile idiopathic arthritis sponsored by Eli Lilly corp. However, none of the patients included in the present report have been evaluated or enrolled in this study. The authors declare that Eli Lilly had no role in the design of the study; in the collection, analyses, or interpretation of data; in the writing of the manuscript, or in the decision to publish the results.

Figures

Figure A1
Figure A1
Cluster analysis of patients (pt) after JAKinhibs treatment and healthy control-group subjects (HC). Cluster analysis results (K-means clustering) considering 500 most variable protein coding genes across all samples that divide subjects into subgroups by similarities. Each dot represents a subject; Dim1 and Dim2 show the higher differences between the main clusters; D-Cluster contains three HC and patients #2, #3, #5, #6. H-Cluster 3: three HC and patient #4. Patient #1 and patient #7 are outliers.
Figure 1
Figure 1
Laboratory findings and corticosteroid dosage before and after treatment with Janus kinase (JAK) inhibitors (JAKinhibs) in the seven subjects (pt 1–7). (a) ESR (b) CRP (c) IS (d) IgG (e) PLT (f) WBC (g) corticosteroid dosage. ESR, erythrocyte sedimentation rate; CRP, C-reactive protein; IS, interferon score; IgG, immunoglobulins; PLT, platelets; WBC, white blood count; pt, patient.
Figure 2
Figure 2
Cluster analysis and pathway enrichment. (a) Cluster analysis results (K-means clustering) considering 500 most variable protein-coding genes across all samples that divide subjects into subgroups by similarities. Each dot represents a subject; Dim1 and Dim2 show the higher differences between the main clusters; H-Cluster contains all the healthy control-group subjects (HC) and some patients (pt) affected with multifactorial disorders. D-Cluster contains mainly subjects with proven or suspected rare monogenic disorders. (b) Pathway analysis was run on differential expressed genes resulting from the comparison between the seven patients and the control-group subjects: each dot represents a pathway and the size is directly proportional to the number of genes. X-axis reports pathway fold enrichment. All the selected pathways showed a lowest adjusted-p-value of the given term over all iterations ≤0.01. Pathway are listed by increasing p-values.
Figure 3
Figure 3
Pathway enrichment analysis before and after JAKinhibs treatment. Pt, patient.
Figure 4
Figure 4
Pathway enrichment analysis before and after JAKinhibs treatment. Pt, patient.
Figure 5
Figure 5
Pathway enrichment analysis before and after JAKinhibs treatment. Pt, patient.
Figure 6
Figure 6
Pathway enrichment analysis before and after JAKinhibs treatment. Pt, patient.
Figure 7
Figure 7
Pathway enrichment analysis before and after JAKinhibs treatment. Pt, patient.
Figure 8
Figure 8
Pathway enrichment analysis was run on differential expressed genes resulting from the comparison between patient #1 before JAKinhibs and the control-group subjects and between patient #1 after JAKinhibs and the controls. Pathways altered uniquely before (a) or uniquely after (b) JAKinhibs were chosen. Each dot represents a pathway, and the size is directly proportional to the number of genes. On the X-axis the pathway fold enrichment is displayed. All the selected pathways showed a lowest adjusted p-value of the given term over all iterations ≤0.01, and the five most enriched pathways were elected, where applicable. Pathways are ordered by increasing p-values. Pathways altered before JAKinhibs are colored in dark grey and those altered after JAKinhibs in light grey.
Figure 9
Figure 9
Pathway enrichment analysis was run on differential expressed genes resulting from the comparison between patient #2 before JAKinhibs and the control-group subjects and between patient #2 after JAKinhibs and the controls. Pathways altered uniquely before (a) or uniquely after (b) JAKinhibs were chosen. Each dot represents a pathway, and the size is directly proportional to the number of genes. On the X-axis the pathway fold enrichment is displayed. All the selected pathways showed a lowest adjusted p-value of the given term over all iterations ≤0.01, and the five most enriched pathways were elected, where applicable. Pathways are ordered by increasing p-values. Pathways altered before JAKinhibs are colored in dark grey and those altered after JAKinhibs in light grey.
Figure 10
Figure 10
Pathway enrichment analysis was run on differential expressed genes resulting from the comparison between patient #3 before JAKinhibs and the control-group subjects and between patient #3 after JAKinhibs and the controls. Pathways altered uniquely before (a) or uniquely after (b) JAKinhibs were chosen. Each dot represents a pathway, and the size is directly proportional to the number of genes. On the X-axis is displayed the pathway fold enrichment. All the selected pathways showed a lowest adjusted p-value of the given term over all iterations ≤0.01, and the five most enriched pathways were elected, where applicable. Pathways are ordered by increasing p-values. Pathways altered before JAKinhibs are colored in dark grey and those altered after JAKinhibs in light grey.
Figure 11
Figure 11
Pathway enrichment analysis was run on differential expressed genes resulting from the comparison between patient #4 before JAKinhibs and the control-group subjects and between patient #4 after JAKinhibs and the controls. Pathways altered uniquely before (a) or uniquely after (b) JAKinhibs were chosen. Each dot represents a pathway, and the size is directly proportional to the number of genes. On the X-axis the pathway fold enrichment is displayed. All the selected pathways showed a lowest adjusted p-value of the given term over all iterations ≤0.01, and the five most enriched pathways were elected, where applicable. Pathways are ordered by increasing p-values. Pathways altered before JAKinhibs are colored in dark grey and those altered after JAKinhibs in light grey.
Figure 12
Figure 12
Pathway enrichment analysis was run on differential expressed genes resulting from the comparison between patient #5 before JAKinhibs and the control-group subjects, and between patient #5 after JAKinhibs and the controls. Pathways altered uniquely before (a) or uniquely after (b) JAKinhibs were chosen. Each dot represents a pathway, and the size is directly proportional to the number of genes. On the X-axis the pathway fold enrichment is displayed. All the selected pathways showed a lowest adjusted p-value of the given term over all iterations ≤0.01, and the five most enriched pathways were elected, where applicable. Pathways are ordered by increasing p-values. Pathways altered before JAKinhibs are colored in dark grey and those altered after JAKinhibs in light grey.
Figure 13
Figure 13
Pathway enrichment analysis was run on differential expressed genes resulting from the comparison between patient #6 before JAKinhibs and the control-group subjects, and between patient #6 after JAKinhibs and the controls. Pathways altered uniquely before (a) or uniquely after (b) JAKinhibs were chosen. Each dot represents a pathway, and the size is directly proportional to the number of genes. On the X-axis the pathway fold enrichment is displayed. All the selected pathways showed a lowest adjusted p-value of the given term over all iterations ≤0.01, and the five most enriched pathways were elected, where applicable. Pathways are ordered by increasing p-values. Pathways altered before JAKinhibs are colored in dark grey and those altered after JAKinhibs in light grey.
Figure 14
Figure 14
Pathway enrichment analysis was run on differential expressed genes resulting from the comparison between patient #7 before JAKinhibs and the control-group subjects and between patient #7 after JAKinhibs and the controls. Pathways altered uniquely before (a) or uniquely after (b) JAKinhibs were chosen. Each dot represents a pathway, and the size is directly proportional to the number of genes. On the X-axis the pathway fold enrichment is displayed. All the selected pathways showed a lowest adjusted p-value of the given term over all iterations ≤0.01, and the five most enriched pathways were elected, where applicable. Pathways are ordered by increasing p-values. Pathways altered before JAKinhibs are colored in dark grey and those altered after JAKinhibs in light grey.

References

    1. Pandit A., Radstake T.R.D.J. Machine learning in rheumatology approaches the clinic. Nat. Rev. Rheumatol. 2020;16:69–70. doi: 10.1038/s41584-019-0361-0. - DOI - PubMed
    1. Vanderver A., Adang L., Gavazzi F., McDonald K., Helman G., Frank D.B., Jaffe N., Yum S.W., Collins A., Keller S.R., et al. Janus Kinase Inhibition in the Aicardi-Goutières Syndrome. N. Engl. J. Med. 2020;383:986–989. doi: 10.1056/NEJMc2001362. - DOI - PMC - PubMed
    1. Karageorgas T.P., Tseronis D.D., Mavragani C.P. Activation of type I interferon pathway in systemic lupus erythematosus: Association with distinct clinical phenotypes. J. Biomed. Biotechnol. 2011;2011:273907. doi: 10.1155/2011/273907. - DOI - PMC - PubMed
    1. La Torre F., Martini G., Russo R., Katsicas M.M., Corona F., Calcagno G., Falcini F., Vittadello F., Zulian F. A preliminary disease severity score for juvenile systemic sclerosis. Arthritis Rheum. 2012;64:4143–4150. doi: 10.1002/art.34652. - DOI - PubMed
    1. Kim H., de Jesus A.A., Brooks S.R., Liu Y., Huang Y., VanTries R., Montealegre Sanchez G.A., Rotman Y., Gadina M., Goldbach-Mansky R. Development of a Validated Interferon Score Using NanoString Technology. J. Interferon Cytokine Res. 2018;38:171–185. doi: 10.1089/jir.2017.0127. - DOI - PMC - PubMed

Substances

LinkOut - more resources