Clinical Trial
. 2020 Dec;30(12):1781-1788.
doi: 10.1101/gr.266676.120. Epub 2020 Oct 22.

Sequencing identifies multiple early introductions of SARS-CoV-2 to the New York City region

Affiliations
Clinical Trial

Sequencing identifies multiple early introductions of SARS-CoV-2 to the New York City region

Matthew T Maurano et al. Genome Res. 2020 Dec.

Abstract

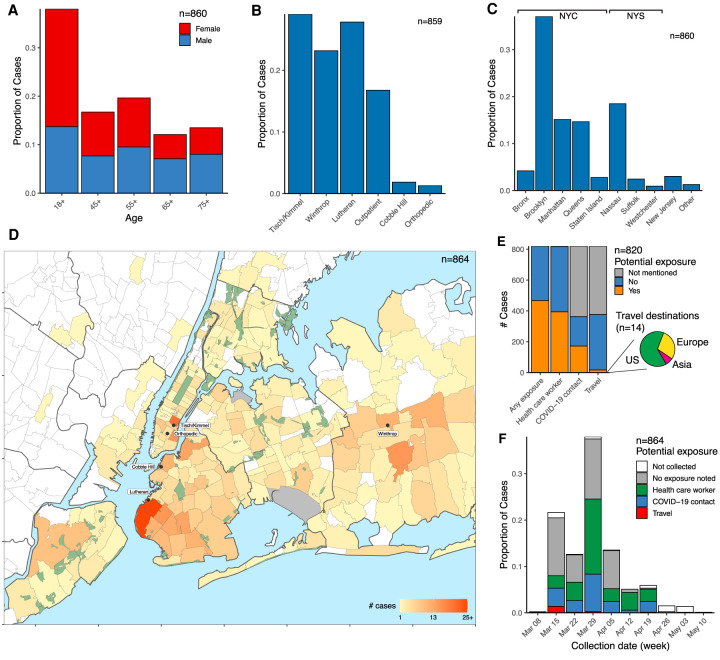
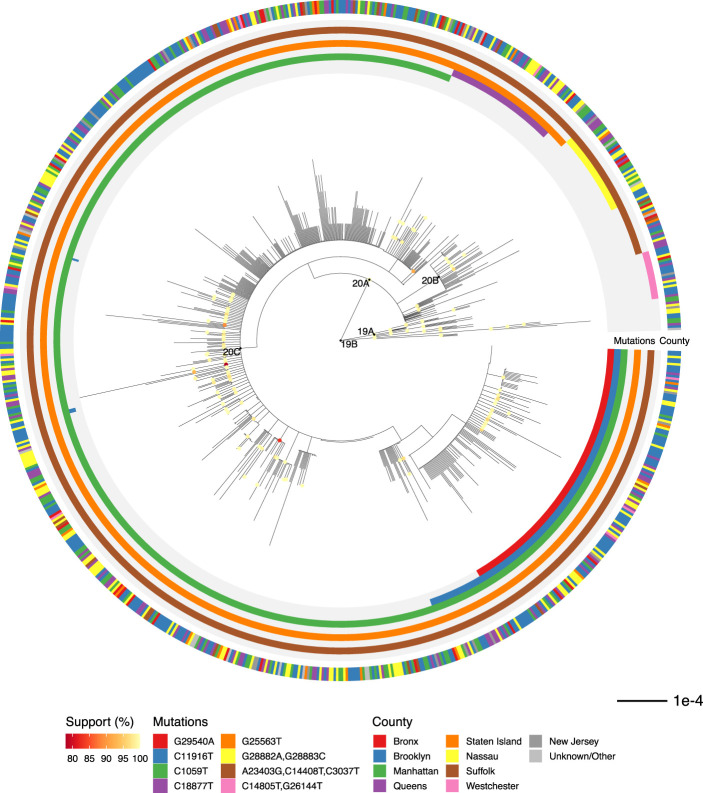
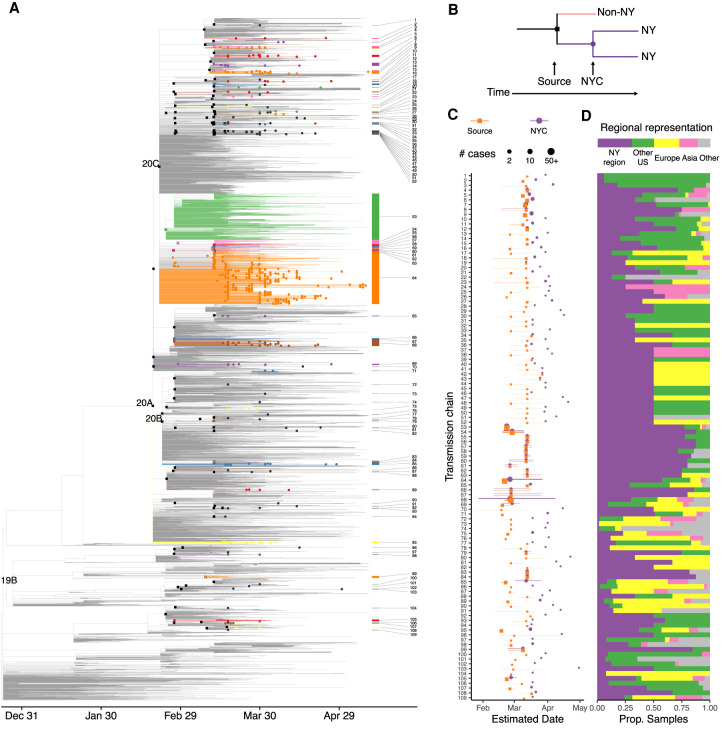
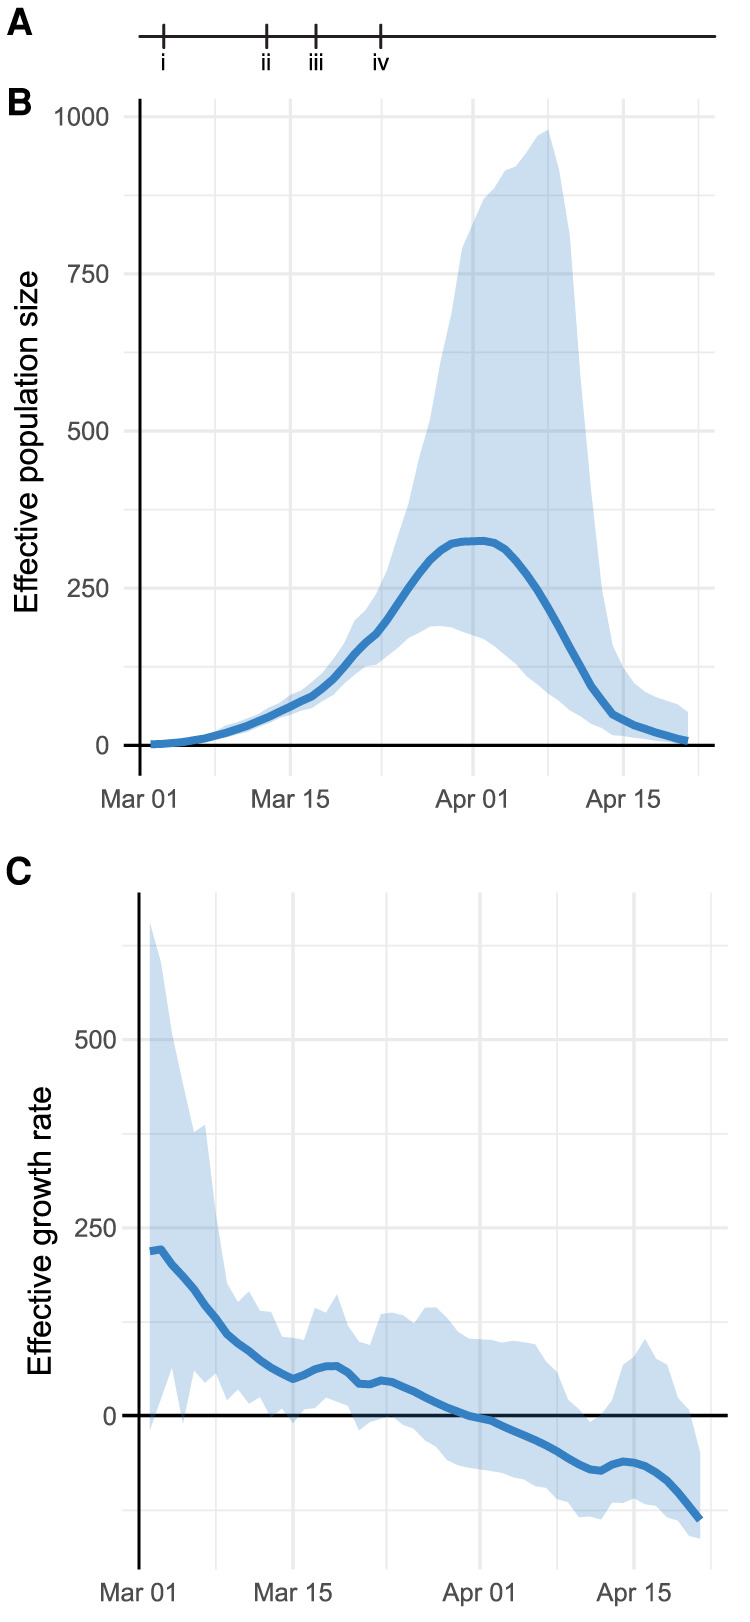
Effective public response to a pandemic relies upon accurate measurement of the extent and dynamics of an outbreak. Viral genome sequencing has emerged as a powerful approach to link seemingly unrelated cases, and large-scale sequencing surveillance can inform on critical epidemiological parameters. Here, we report the analysis of 864 SARS-CoV-2 sequences from cases in the New York City metropolitan area during the COVID-19 outbreak in spring 2020. The majority of cases had no recent travel history or known exposure, and genetically linked cases were spread throughout the region. Comparison to global viral sequences showed that early transmission was most linked to cases from Europe. Our data are consistent with numerous seeds from multiple sources and a prolonged period of unrecognized community spreading. This work highlights the complementary role of genomic surveillance in addition to traditional epidemiological indicators.


Figures

Figure 1.
Figure 1.
Demographic parameters of sequenced SARS-CoV-2 cases in the NYULH system. Cases are broken down as follows: (A) Age and sex; (B) collecting hospital; (C) residential location, grouped by borough and outlying counties; “Other” includes counties with few cases. (D) Localization of case residences within the New York City region. The color scale indicates number of cases per ZIP code. Collecting hospitals are labeled with rounded boxes. (E) Potential exposure status, categorized by occupation as healthcare worker, travel history, and contact with a COVID-19-positive individual. The pie chart depicts the geographical destination of the potential travel-related exposures. (F) Potential exposure status by collection date.
Figure 2.
Figure 2.
Phylogenetic relationship of regional viral sequences. Maximum likelihood phylogeny inferred from 864 cases. Nodes with bootstrap support values above 75 are colored. Inner rings indicate groups of clade-defining mutations. Outer ring indicates county of residence. Scale bar, nucleotide substitutions per site.
Figure 3.
Figure 3.
Timescaled phylogeny showing global sequence context. (A) Colored edges highlight transmission chains. Black squares indicate source nodes; dots, detected presence in the northeast United States. (B) Schematic of approach to infer introductions and transmission chains. (C,D) Transmission chains in the New York City region ordered by inferred divergence date from source. (C) Dates estimated for source transmission (orange) and earliest detected local transmission (purple) inferred from sequenced cases; lines represent 90% confidence intervals. Point size corresponds to the number of strains under source and all transmission chains. (D) Representation of global regions in each source transmission. Bar at top shows overall representation of regions in the phylogeny.
Figure 4.
Figure 4.
Phylodynamic analysis of outbreak trajectory. (A) Timeline of New York City outbreak, highlighting (i) announcement of first community-acquired case (March 3); (ii) ban on gatherings exceeding 500 people (March 12); (iii) closure of schools, restaurants, and bars, and other venues (March 16); (iv) closure of nonessential businesses (March 22). (B,C) Outbreak trajectory estimated from genetic data showing effective population size relative to March 1 (B) and growth rate of effective population size (C; units of 1/yr). Shaded regions represent 95% credible interval.

Update of

  • Sequencing identifies multiple early introductions of SARS-CoV-2 to the New York City Region.
    Maurano MT, Ramaswami S, Zappile P, Dimartino D, Boytard L, Ribeiro-Dos-Santos AM, Vulpescu NA, Westby G, Shen G, Feng X, Hogan MS, Ragonnet-Cronin M, Geidelberg L, Marier C, Meyn P, Zhang Y, Cadley J, Ordoñez R, Luther R, Huang E, Guzman E, Arguelles-Grande C, Argyropoulos KV, Black M, Serrano A, Call ME, Kim MJ, Belovarac B, Gindin T, Lytle A, Pinnell J, Vougiouklakis T, Chen J, Lin LH, Rapkiewicz A, Raabe V, Samanovic MI, Jour G, Osman I, Aguero-Rosenfeld M, Mulligan MJ, Volz EM, Cotzia P, Snuderl M, Heguy A. Maurano MT, et al. medRxiv [Preprint]. 2020 Aug 19:2020.04.15.20064931. doi: 10.1101/2020.04.15.20064931. medRxiv. 2020. Update in: Genome Res. 2020 Dec;30(12):1781-1788. doi: 10.1101/gr.266676.120. PMID: 32511587 Free PMC article. Updated. Preprint.

References

    1. Andersen KG, Rambaut A, Lipkin WI, Holmes EC, Garry RF. 2020. The proximal origin of SARS-CoV-2. Nat Med 26: 450–452. 10.1038/s41591-020-0820-9 - DOI - PMC - PubMed
    1. Bedford T, Greninger AL, Roychoudhury P, Starita LM, Famulare M, Huang M-L, Nalla A, Pepper G, Reinhardt A, Xie H, et al. 2020. Cryptic transmission of SARS-CoV-2 in Washington state. Science 370: 571–575. 10.1126/science.abc0523 - DOI - PMC - PubMed
    1. Bolger AM, Lohse M, Usadel B. 2014. Trimmomatic: a flexible trimmer for Illumina sequence data. Bioinformatics 30: 2114–2120. 10.1093/bioinformatics/btu170 - DOI - PMC - PubMed
    1. Carroll MW, Matthews DA, Hiscox JA, Elmore MJ, Pollakis G, Rambaut A, Hewson R, García-Dorival I, Bore JA, Koundouno R, et al. 2015. Temporal and spatial analysis of the 2014–2015 Ebola virus outbreak in West Africa. Nature 524: 97–101. 10.1038/nature14594 - DOI - PMC - PubMed
    1. Davis JT, Chinazzi M, Perra N, Mu K, Pastore y Piontti A, Ajelli M, Dean NE, Gioannini C, Litvinova M, Merler S, et al. 2020. Estimating the establishment of local transmission and the cryptic phase of the COVID-19 pandemic in the USA. medRxiv 10.1101/2020.07.06.20140285 - DOI

Publication types