

How many human pathogens are there in Laos? An estimate of national human pathogen diversity and analysis of historical trends
- PMID: 33093128
- PMCID: PMC7584012
- DOI: 10.1136/bmjgh-2020-002972
How many human pathogens are there in Laos? An estimate of national human pathogen diversity and analysis of historical trends
Abstract
Objective: The emergence of infectious diseases pose major global health threats. Estimates of total in-country human pathogen diversity, and insights as to how and when species were described through history, could be used to estimate the probability of new pathogen discoveries. Data from the Lao People's Democratic Republic (Laos) were used in this proof-of-concept study to estimate national human pathogen diversity and to examine historical discovery rate drivers.
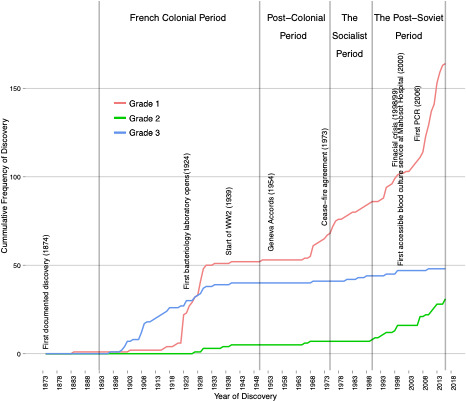
Methods: A systematic survey of the French and English scientific and grey literature of pathogen description in Laos between 1874 and 2017 was conducted. The first descriptions of each known human pathogen in Laos were coded according to the diagnostic evidence available. Cumulative frequency of discovery across time informed the rate of discovery. Four distinct periods of health systems development in Laos were identified prospectively and juxtaposed to the unmodelled rate of discovery. A model with a time-varying rate of discovery was fitted to these data using a Markov-Chain- Monte-Carlo technique.
Results: From 6456 pathogen descriptions, 245 discoveries of known human pathogens in Laos, including repeat discoveries using different grades of evidence, were identified. The models estimate that the Laos human pathogen species diversity in 2017 is between 169 and 206. During the last decade, there has been a 33-fold increase in the discovery rate coinciding with the strengthening of medical research and microbiology.
Conclusion: Discovery curves can be used to model and estimate country-level human pathogen diversity present in a territory. Combining this with historical assessment improves the understanding of the factors affecting local pathogen discovery.
Prospero registration number: A protocol of this work was registered on PROSPERO (ID:CRD42016046728).
Keywords: epidemiology; health systems evaluation; mathematical modelling; public health.
© Author(s) (or their employer(s)) 2020. Re-use permitted under CC BY. Published by BMJ.
Conflict of interest statement
Competing interests: None declared.
Figures


Similar articles
-
High heterogeneity in Plasmodium falciparum risk illustrates the need for detailed mapping to guide resource allocation: a new malaria risk map of the Lao People's Democratic Republic.Malar J. 2010 Feb 24;9:59. doi: 10.1186/1475-2875-9-59. Malar J. 2010. PMID: 20181273 Free PMC article.
-
Investigation of infectious reproductive pathogens of large ruminants: Are neosporosis, brucellosis, leptospirosis and BVDV of relevance in Lao PDR?Acta Trop. 2018 Jan;177:118-126. doi: 10.1016/j.actatropica.2017.10.007. Epub 2017 Oct 9. Acta Trop. 2018. PMID: 29024616
-
The evolution of the national licensing system of health care professionals: a qualitative descriptive case study in Lao People's Democratic Republic.Hum Resour Health. 2017 Aug 7;15(1):51. doi: 10.1186/s12960-017-0215-2. Hum Resour Health. 2017. PMID: 28784154 Free PMC article.
-
The Isolation of Orientia tsutsugamushi and Rickettsia typhi from Human Blood through Mammalian Cell Culture: a Descriptive Series of 3,227 Samples and Outcomes in the Lao People's Democratic Republic.J Clin Microbiol. 2020 Nov 18;58(12):e01553-20. doi: 10.1128/JCM.01553-20. Print 2020 Nov 18. J Clin Microbiol. 2020. PMID: 32999008 Free PMC article. Review.
-
Melioidosis in the Lao People's Democratic Republic.Trop Med Infect Dis. 2018 Feb 19;3(1):21. doi: 10.3390/tropicalmed3010021. Trop Med Infect Dis. 2018. PMID: 30274419 Free PMC article. Review.
Cited by
-
Febrile illness mapping-much of the world without data and without evidence-based treatments.BMC Med. 2020 Sep 21;18(1):287. doi: 10.1186/s12916-020-01747-y. BMC Med. 2020. PMID: 32958035 Free PMC article. No abstract available.
-
Antimicrobial use and resistance data in human and animal sectors in the Lao PDR: evidence to inform policy.BMJ Glob Health. 2021 Nov;6(12):e007009. doi: 10.1136/bmjgh-2021-007009. BMJ Glob Health. 2021. PMID: 34853032 Free PMC article.
References
Publication types
MeSH terms
Grants and funding
LinkOut - more resources
Full Text Sources