. 2020 Dec;32(12):3792-3811.
doi: 10.1105/tpc.20.00283. Epub 2020 Oct 22.

SAUR17 and SAUR50 Differentially Regulate PP2C-D1 during Apical Hook Development and Cotyledon Opening in Arabidopsis

Affiliations

SAUR17 and SAUR50 Differentially Regulate PP2C-D1 during Apical Hook Development and Cotyledon Opening in Arabidopsis

Jiajun Wang et al. Plant Cell. 2020 Dec.

Abstract

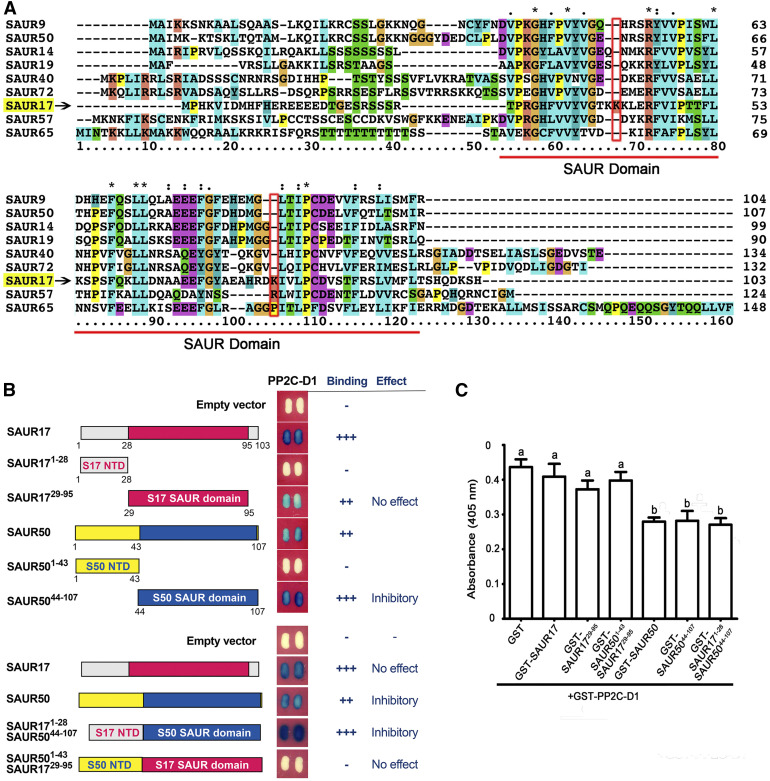
Following germination in the dark, Arabidopsis (Arabidopsis thaliana) seedlings undergo etiolation and develop apical hooks, closed cotyledons, and rapidly elongating hypocotyls. Upon light perception, the seedlings de-etiolate, which includes the opening of apical hooks and cotyledons. Here, we identify Arabidopsis Small Auxin Up RNA17 (SAUR17) as a downstream effector of etiolation, which serves to bring about apical hook formation and closed cotyledons. SAUR17 is highly expressed in apical hooks and cotyledons and is repressed by light. The apical organs also express a group of light-inducing SAURs, as represented by SAUR50, which promote hook and cotyledon opening. The development of etiolated or de-etiolated apical structures requires asymmetric differential cell growth. We present evidence that the opposing actions of SAUR17 and SAUR50 on apical development largely result from their antagonistic regulation of Protein Phosphatase 2C D-clade 1 (PP2C-D1), a phosphatase that suppresses cell expansion and promotes apical hook development in the dark. SAUR50 inhibits PP2C-D1, whereas SAUR17 has a higher affinity for PP2C-D1 without inhibiting its activity. PP2C-D1 predominantly associates with SAUR17 in etiolated seedlings, which shields it from inhibitory SAURs such as SAUR50. Light signals turn off SAUR17 and upregulate a subgroup of SAURs including SAUR50 at the inner side of the hook and cotyledon cells, leading to cell expansion and unfolding of the hook and cotyledons.


Figures

Figure 1.
Figure 1.
Arabidopsis SAUR17 Is Specifically Expressed in the Hooks and Cotyledons of Dark-Grown Seedlings. (A) SAUR17 transcript levels in various organs of the wild-type (Col-0) seedlings. Three-day-old etiolated seedlings (D) were exposed to white light for 0 h (D), 1 h (DL1h), or 6 h (DL6h). Whole seedlings, or dissected tissues of hooks and cotyledons, hypocotyls, and roots were for RNA analysis by RT-qPCR. Error bars represent sd of three biological replicates. PP2A was used as an internal control. (B) Images showing the apical organ morphology and fluorescence of ProSAUR17:GFP and ProSAUR17:SAUR17-GFP seedlings. Three-day-old dark-grown seedlings (D) were exposed to white light for the indicated number of hours (DL1h to DL12h) or kept in darkness for 12 h (D12h). Photographs were taken under a Leica stereoscope. (C) Localization patterns of SAUR17 in hooks and cotyledons. Etiolated 35S:GFP (control), ProSAUR17:GFP, and ProSAUR17:SAUR17-GFP seedlings (3 d) were pressed to separate the cotyledons. The fluorescence was observed under a Zeiss confocal microscope. (D) SAUR17 transcript levels in the wild-type (Col-0) seedlings during growth in the dark. Dark-grown seedlings at 1 to 7 d of growth (1D to 7D) were collected whole or after cutting below the hook. The upper part (hooks and cotyledons) and lower part (hypocotyls and roots) of the seedling were separately analyzed by RT-PCR. The data represent one of three repeats of independent experiments, with the two other repeats shown in Supplemental Figure 2. Standard deviation (means ± sd, n = 3) is based on three technical repeats. PP2A was used as an internal control. (E) ProSAUR17:GFP and ProSAUR17:SAUR17-GFP fluorescence signals peak at 2 and 3 d in the dark. D1 to D5 indicate 1- to 5-d dark-grown seedlings, and L3 indicates 3-d light-grown seedlings.
Figure 2.
Figure 2.
SAUR17 Functions in Apical Hook Development and Cotyledon Closure in the Dark. (A) and (B) saur17 shows an apical hook defect under ethylene treatment. (A) Col and two different lines of saur17 seedlings were grown on solid medium containing 10 μM ACC or without ACC (mock) in the dark for 3 d. Bar = 1 mm. (B) Hook angles of the seedlings described in (A). n ≥ 32. Statistical significance was calculated by one-way ANOVA along with Bonferroni’s post test. On each box, the central line indicates the median, and the bottom and top edges of the box indicate the 25th and 75th percentiles, respectively. The whiskers mark the highest and lowest data points of the group. Different lowercase letters above the bars indicate significantly different groups. (C) and (D) Cotyledon phenotypes of the wild type and saur17 mutants during the dark-to-light transition. (C) Col and saur17 seedlings grown in the dark for 3 d were transferred to white light (80 μmol/m2/s) at the indicated time points. Bar = 1 mm. (D) Cotyledon opening angles of wild type and saur17 mutants at the indicated time points. Data are shown as means ± se (n ≥ 29; one-way ANOVA, Bonferroni’s post test, *P < 0.05, **P < 0.01, ***P < 0.001; ns, no significant difference). (E) Expression levels of the subfamily genes of SAUR17 and SAUR54 in cotyledons and hooks. The 3-d-old etiolated wild-type seedlings were kept in the dark (D) or exposed to white light for 1 h (DL1h), and cotyledon and hook tissues were dissected for RNA analysis. Data shown are mean ± sd (three replicates). PP2A was used as an internal control. (F) Apical phenotypes in two independent lines of saur17 single mutants, saur44,45,46,47,51,54,57 septuple mutants (saurSe), and saur17,44,45,46,47,51,54,57 octuple mutants (saurSe saur17). Seedlings were grown in the dark for 2 d. Bar = 1 mm. (G) Percentages of seedlings exhibiting separated cotyledons. Seedlings of the indicated genotypes were grown in the dark for 3 d. Data were analyzed from three biological replicates (mean ± sd). n > 40 for each replicate. Cotyledon separation angles greater than 20° were scored as open cotyledons. Statistical significance was calculated by one-way ANOVA along with Bonferroni’s post test. Different lowercase letters above the bars indicate significant differences at P < 0.01. (H) Hook angles of saur17-related mutants and the wild-type seedlings during the course of growth in the dark. Two independent lines for each group of mutants are shown. Different letters indicate statistically significant differences (one-way ANOVA, Bonferroni’s multiple comparison, P < 0.01).
Figure 3.
Figure 3.
A Group of lirSAURs Promotes Hook and Cotyledon Opening. (A) to (C) saur6,12,14,16,50 quintuple mutants exhibit stronger apical hooks in the dark and slower hook and cotyledon opening than the wild type. Two independent mutant lines were examined. (A) Apical morphology of the seedlings grown in the dark for 3 d and transferred to white light (80 μmol/m2/s) at the indicated time points. Bar = 1 mm. (B) Hook angles of the wild type and saur6,12,14,16,50 during the dark-to-light transition. Data are shown as means ± se. n > 50 for each sample point. One-way ANOVA was used to calculate significant differences. Bonferroni’s post test, P < 0.01. (C) Percentage of seedlings exhibiting open cotyledons at the indicated time points after light exposure. Cotyledon separation angles greater than 20° were scored as open cotyledons. Three biological replicates were performed. n > 50 for each replicate. Data are shown as means ± sd (one-way ANOVA, Bonferroni’s post test, P < 0.01). (D) Localization pattern at the apical region in 2.5-d dark-grown ProSAUR6:GFP, ProSAUR12:GFP, ProSAUR14:GFP, ProSAUR16:GFP, and ProSAUR50:GFP seedlings. Insets inside the panels show enlarged images of the hook region. The fluorescence was observed under a Leica stereoscope. Bar = 0.5 mm.
Figure 4.
Figure 4.
In Vitro and in Vivo Binding of SAUR17 to PP2C-D1 and the Lack of Inhibition of PP2C-D1 Phosphatase Activity. (A) SAUR50, but not SAUR17, inhibits the phosphatase activity of PP2C-D1. The pNPP phosphatase assays contained GST-PP2C-D1 (0.3 µM) with 1 μM GST, GST-SAUR17, GST-SAUR14, or GST-SAUR50. Error bars indicate ± sd (n = 4). (B) Increasing concentrations of SAUR17 have no effects on PP2C-D1 phosphatase activity, in contrast to SAUR50. The pNPP phosphatase assays contained GST-PP2C-D1 (0.3 μM) with the indicated concentrations of GST-SAUR17 or GST-SAUR50. Data are shown as means ± sd (n = 3). (C) PP2C-D1 exhibits higher binding affinity to SAUR17 than to SAUR50. Equilibrium Kds between PP2C-D1 and SAUR50 (left) or between PP2C-D1 and SAUR17 (right) were determined using Biacore T200 software. His-PP2C-D1 was bound to CM5 chip, and the indicated concentrations of His-SAUR17 or His-SAUR50 were used. (D) SAUR17 predominantly associates with endogenous PP2C-D1 in etiolated seedlings. Three-day-old dark-grown seedlings of the indicated transgenic lines were used for IP-MS. The PSM scores of PP2C-D members from 35S:GFP, 35S:SAUR17-GFP, and 35S:SAUR50-GFP parallel IP-MS are shown. The nomenclature of PP2C-D members is according to Spartz et al. (2014). Also see Supplemental Data Set 1. (E) PP2C-D1 primarily binds to endogenous SAUR17 in etiolated seedlings. 35S:GFP and 35S:PP2C-D1-GFP seedlings were grown in the dark for 3 d and collected for IP-MS. Four SAURs were identified from the PP2C-D1 IP, along with AHA1 and AHA2. The PSM scores for the respective proteins are shown. Also see Supplemental Data Set 2.
Figure 5.
Figure 5.
SAUR17 Prevents SAUR50 from Binding to and Inhibiting PP2C-D1. (A) Increasing amounts of SAUR17 restore the phosphatase activity of PP2C-D1, which was inhibited by SAUR50. In vitro pNPP phosphatase assay of GST-PP2C-D1 (0.4 μM) with the indicated SAUR proteins. One-way ANOVA was used to calculated significant differences. Bonferroni’s post test, P < 0.01. Data are shown as means ± sd (n = 3). Different lowercase letters above the bars indicate a significant difference. (B) Yeast three-hybrid assay showing that coexpression of SAUR17 weakened the interaction of BD-PP2C-D1 and AD-SAUR50, whereas coexpression of SAUR50 did not affect the interaction of BD-PP2C-D1 and AD-SAUR17. The plates were incubated for 15 or 30 h to visualize color differences. (C) In vitro pull-down assay showing competition between SAUR17 and SAUR50 in binding to PP2C-D1. His-PP2C-D1 was pre-bound with GST-SAURs, and the indicated amounts of competitor His-SAURs were added to the mixtures. GST beads were used in the pull-down assay, and His-PP2C-D1 in the pellet was examined by immunoblot analysis using anti-His antibodies.
Figure 6.
Figure 6.
Identifying the PP2C-D1 Binding and Inhibition Domains of SAUR17 and SAUR50. (A) Multiple sequence alignment between SAUR17 and the SAURs known to inhibit PP2C-D1. SAUR protein sequences (The Arabidopsis Information Resource; https://www.arabidopsis.org/) were analyzed using the clustalX2.1 complete alignment algorithmic program. The red line marks the SAUR domain. The numbers on the right indicate the number of the last amino acid in each line. Asterisk (*) indicates positions with a single, fully conserved residue. Colon (:) indicates conservation between groups of strongly similar properties and roughly equivalent to scoring >0.5 in the Gonnet PAM 250 matrix. Period (.) indicates conservation between groups of weakly similar properties and roughly equivalent to scoring ≤0.5 and >0 in the Gonnet PAM 250 matrix. (B) Yeast-two-hybrid assay testing the interaction between PP2C-D1 and various mutant versions of SAUR17 and SAUR50. Constructs with deletions and SAUR17-SAUR50 chimeric proteins are shown as schematic diagrams on the left. Results are shown next to the corresponding diagrams. (C) In vitro pNPP phosphatase assays of PP2C-D1 with GST or the indicated GST-SAUR chimeric proteins. Only proteins containing the SAUR domain from SAUR50 showed inhibition of PP2C-D1 activity. Significant differences were calculated by one-way ANOVA, Bonferroni’s post test, P < 0.01. Error bars indicate sd (n = 3). Different lowercase letters above the bars indicate a significant difference.
Figure 7.
Figure 7.
Function of PP2C-D1 in Apical Hook Development Is Antagonistically Regulated by SAUR17 and SAUR50. (A) to (C) PP2C-D1 overexpression promotes apical hook development in the dark and delays light-induced apical hook and cotyledon opening. (A) Apical phenotype of 35S:PP2C-D1-GFP seedlings grown in the dark for 3.5 d and transferred to white light (70 μmol/m2/s) at the indicated time points. (B) Hook angles of the wild type and 35S:PP2C-D1-GFP lines during the dark-to-light transition. Error bars indicate ±se. n > 40 per sample point. (C) Cotyledon opening angles of the wild type and 35S:PP2C-D1-GFP lines at the indicated time points after light exposure. Error bars indicate ±se. n > 40 per sample point. (D) to (F) PP2C-D1 overexpression phenotype is suppressed by saur17,44,57. (D) Apical phenotypes of the wild type, saur17 saur44 saur57 (saur17,44,57), 35S:PP2C-D1-GFP (PP2C-D1OE), and saur17 saur44 saur57/35S:PP2C-D1-GFP (saur17,44,57/PP2C-D1OE). Seedlings were grown in the dark for 3 d. Bar = 1 mm. (E) Hook angles of seedlings of the indicated genotypes. Statistical significance was calculated by one-way ANOVA along with Bonferroni’s post test. n ≥ 35. (F) Cotyledon opening angles of dark-grown seedlings of the indicated genotype. One-way ANOVA with Bonferroni’s post-test was used to calculate statistically significant difference. n ≥ 35. (G) to (I) PP2C-D1 overexpression phenotype is suppressed by SAUR50 overexpression. (G) Apical phenotypes of 3-d dark-grown seedlings of the indicated genotype. Bar = 1 mm. (H) Hook angles of the wild type, PP2C-D1OE, SAUR50OE, and SAUR50OE/PP2C-D1OE. (I) Cotyledon opening angles of seedlings of the indicated genotypes. (H) and (I) n ≥ 42 per sample point. Statistical significance was calculated by one-way ANOVA along with Bonferroni’s post test.
Figure 8.
Figure 8.
SAUR57 Displays an Asymmetric Localization to the Outer Side of the Hook and Inhibits PP2C-D1. (A) SAUR57 displays stronger expression on the outer side of the apical hook. ProSAUR57:GFP was grown in the dark for 2 d, and the images were acquired under a fluorescent stereoscope. (B) SAUR57 is evenly distributed in etiolated cotyledons. ProSAUR57:GFP was grown in the dark for 3 d. Cotyledons were pressed to separate for imaging observation using a laser scanning confocal microscope. (C) Tissue-specific expression pattern of SAUR57 is altered after light irradiation. ProSAUR57:GFP seedlings were grown in the dark for 2 d (D) and transferred to the light for 12 h (DL12h). (D) SAUR57 inhibits the phosphatase activity of PP2C-D1. GST-PP2C-D1 (0.25 μM) was incubated with 1 μM GST, 1 μM GST-SAUR50, or 1 μM GST-SAUR57, and pNPP phosphatase assays were performed. Data are shown as means ± sd (n = 3).
Figure 9.
Figure 9.
Schematic Diagrams of the Roles of SUAR17/SAUR50 in Apical Development and the Localization Patterns of the SAURs in the Apical Hook. (A) A simplified schematic representation of the differential regulation of PP2C-D1 by SAUR17 and SAUR50 that contributes to apical morphological development during etiolation and de-etiolation. In etiolated seedlings, the SAUR17-PP2C-D1 complex abundantly accumulates in the hook and cotyledon region, where PP2C-D1 is active in suppressing cell expansion. This is critical for apical hook formation and maintenance as well as cotyledon closure. Upon illumination, light turns off SAUR17 and upregulates SAUR50 in cotyledons and hooks. This allows SAUR50 to bind to PP2C-D1 and inhibits its activity, resulting in cell expansion and ultimately hook and cotyledon opening. (B) Localization patterns of relevant SAURs and PP2C-D1 in apical hooks. SAUR57 is enriched at the convex cells of the hook, whereas SAUR12, SAUR16, and SAUR50, as well as SAUR32 (Park et al., 2007) and PP2C-D1 (Ren et al., 2018), are enriched in the concave cells of the hook. SAUR17 is uniformly localized throughout the hook.

Similar articles

Cited by

References

    1. Abbas M., Alabadí D., Blázquez M.A.(2013). Differential growth at the apical hook: All roads lead to auxin. Front. Plant Sci. 4: 441. - PMC - PubMed
    1. Arsovski A.A., Galstyan A., Guseman J.M., Nemhauser J.L.(2012). Photomorphogenesis. The Arabidopsis Book 10: e0147. - PMC - PubMed
    1. Atamian H.S., Creux N.M., Brown E.A., Garner A.G., Blackman B.K., Harmer S.L.(2016). Circadian regulation of sunflower heliotropism, floral orientation, and pollinator visits. Science 353: 587–590. - PubMed
    1. Bemer M., van Mourik H., Muiño J.M., Ferrándiz C., Kaufmann K., Angenent G.C.(2017). FRUITFULL controls SAUR10 expression and regulates Arabidopsis growth and architecture. J. Exp. Bot. 68: 3391–3403. - PMC - PubMed
    1. Buchan D.W.A., Jones D.T.(2019). The PSIPRED Protein Analysis Workbench: 20 years on. Nucleic Acids Res. 47 (W1): W402–W407. - PMC - PubMed

Publication types

MeSH terms

LinkOut - more resources