. 2020 Dec 25;295(52):18160-18178.
doi: 10.1074/jbc.RA120.015683. Epub 2020 Oct 22.

Disease-associated mutations in inositol 1,4,5-trisphosphate receptor subunits impair channel function

Affiliations

Disease-associated mutations in inositol 1,4,5-trisphosphate receptor subunits impair channel function

Lara E Terry et al. J Biol Chem. .

Abstract

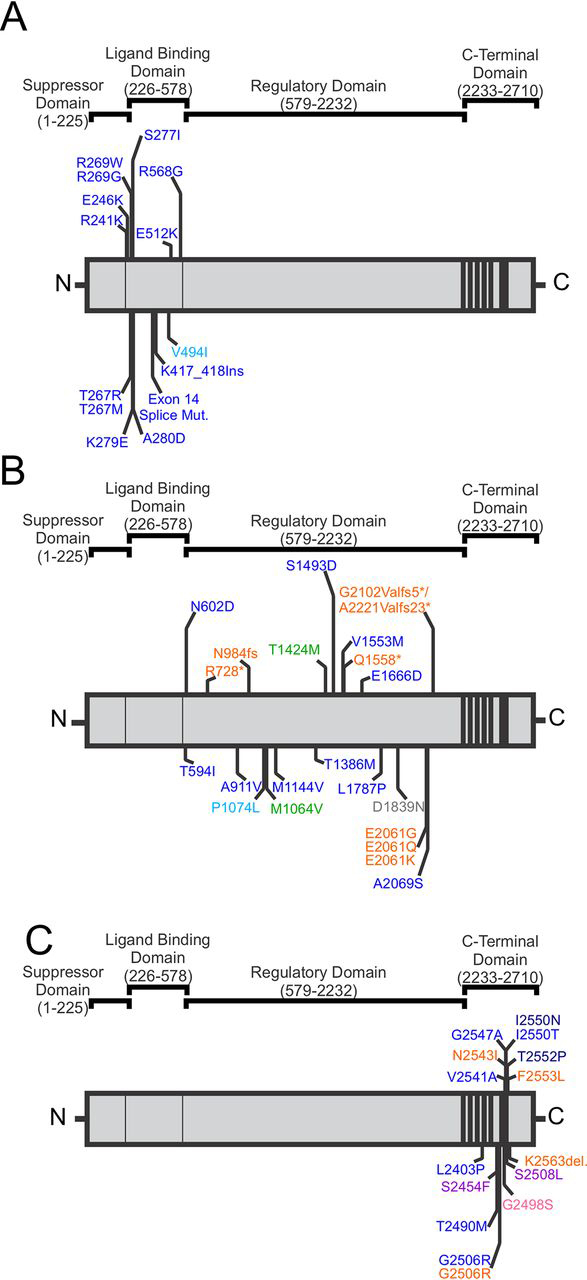
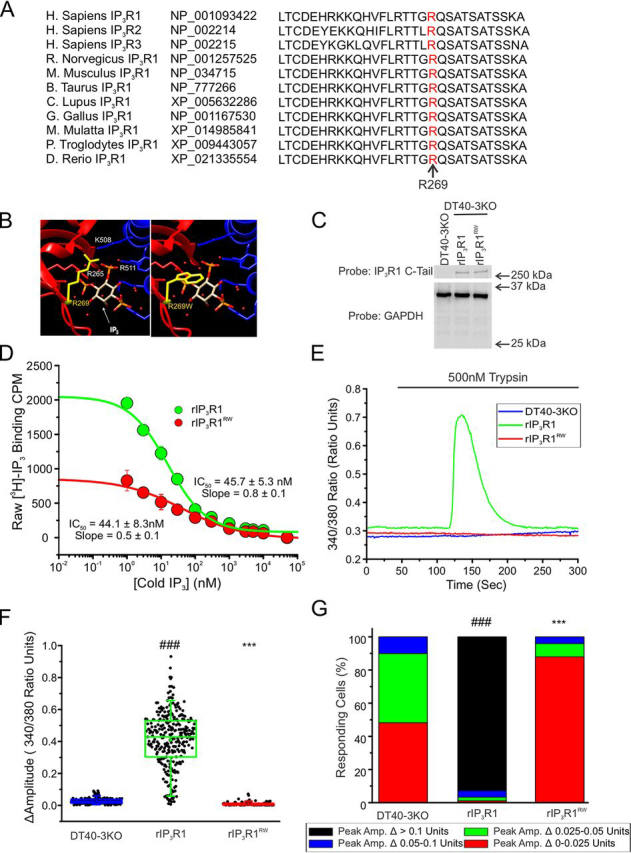
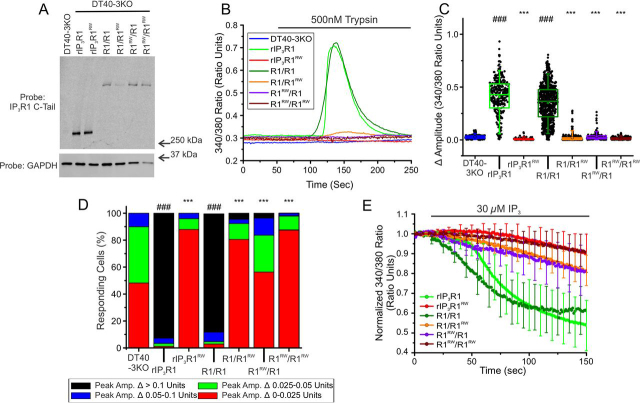
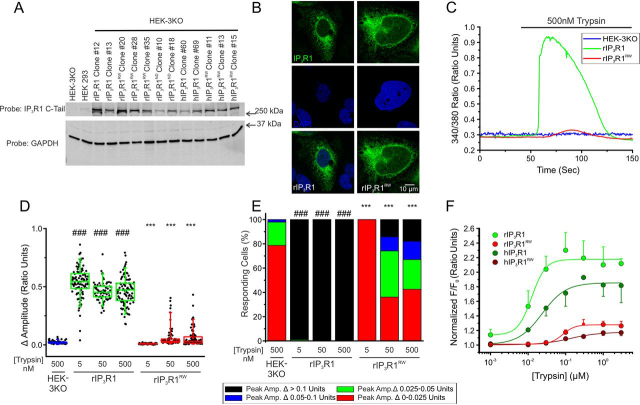
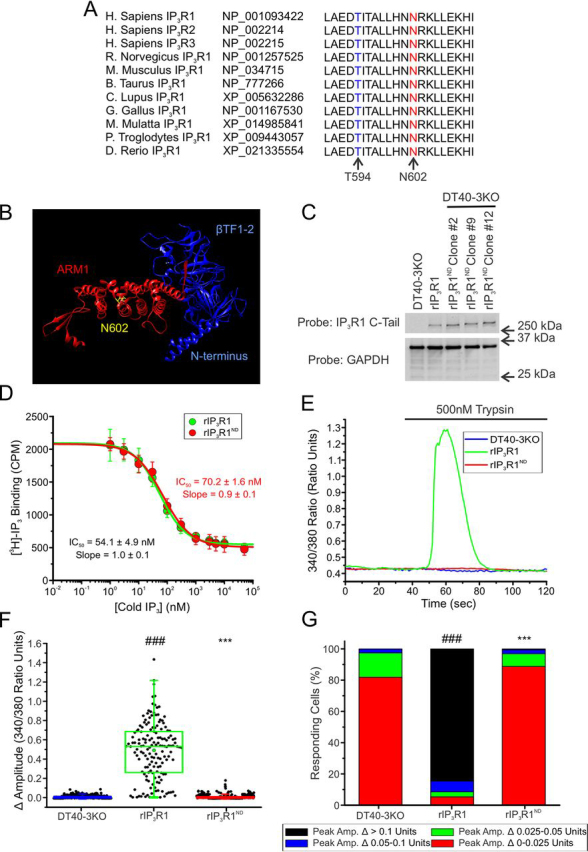
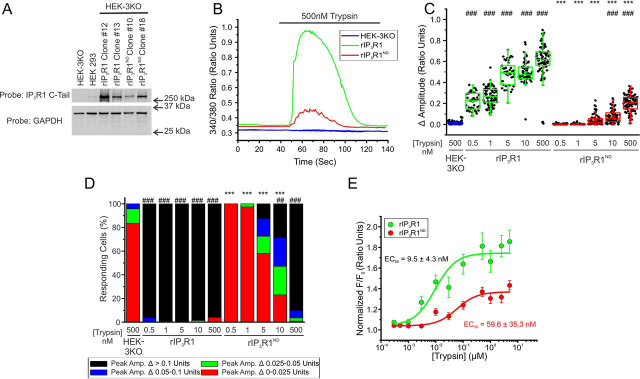
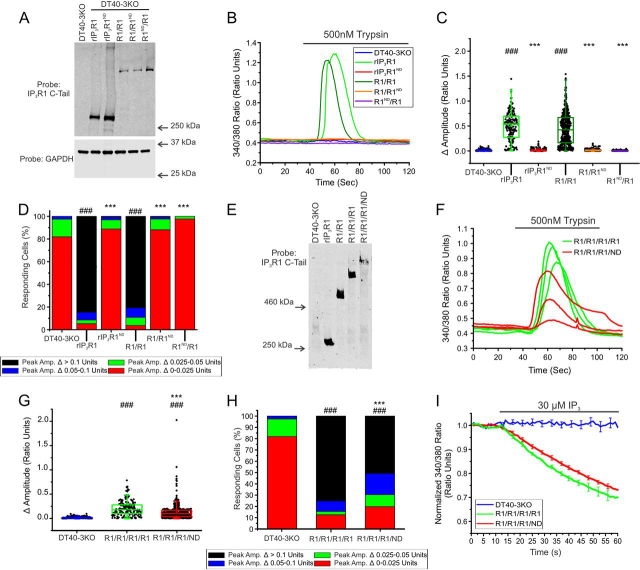
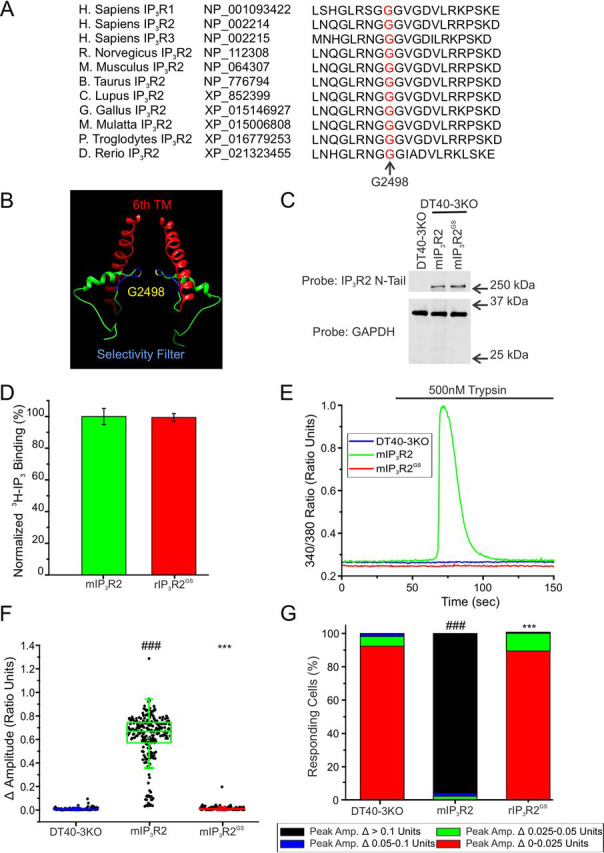
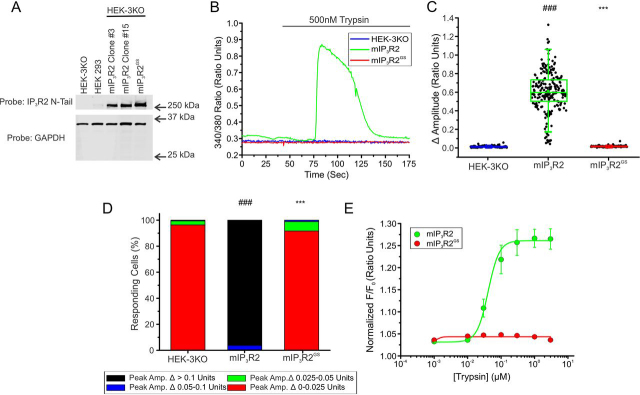
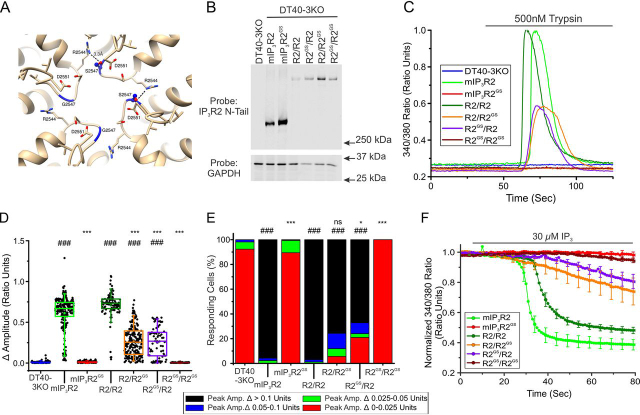
The inositol 1,4,5-trisphosphate (IP3) receptors (IP3Rs), which form tetrameric channels, play pivotal roles in regulating the spatiotemporal patterns of intracellular calcium signals. Mutations in IP3Rs have been increasingly associated with many debilitating human diseases such as ataxia, Gillespie syndrome, and generalized anhidrosis. However, how these mutations affect IP3R function, and how the perturbation of as-sociated calcium signals contribute to the pathogenesis and severity of these diseases remains largely uncharacterized. Moreover, many of these diseases occur as the result of autosomal dominant inheritance, suggesting that WT and mutant subunits associate in heterotetrameric channels. How the in-corporation of different numbers of mutant subunits within the tetrameric channels affects its activities and results in different disease phenotypes is also unclear. In this report, we investigated representative disease-associated missense mutations to determine their effects on IP3R channel activity. Additionally, we designed concatenated IP3R constructs to create tetrameric channels with a predefined subunit composition to explore the functionality of heteromeric channels. Using calcium imaging techniques to assess IP3R channel function, we observed that all the mutations studied resulted in severely attenuated Ca2+ release when expressed as homotetramers. However, some heterotetramers retained varied degrees of function dependent on the composition of the tetramer. Our findings suggest that the effect of mutations depends on the location of the mutation in the IP3R structure, as well as on the stoichiometry of mutant subunits assembled within the tetrameric channel. These studies provide insight into the pathogenesis and penetrance of these devastating human diseases.

Keywords: Gillespie syndrome (GS); anhidrosis; calcium channel; calcium imaging; calcium intracellular release; calcium signaling; imaging; inositol 1,4,5-trisphosphate (IP3); inositol 1,4,5-trisphosphate receptor (IP3R); inositol trisphosphate receptor (InsP3R); signal transduction; spinocerebellar ataxia; spinocerebellar ataxia (SCA).


Conflict of interest statement

Conflict of interest—The authors declare no conflicts of interest in regards to the content of this manuscript.

Figures

Figure 1
Figure 1
Linear schematic of the four domains of the IP3R and the disease-associated IP3R mutations found in the LBD, regulatory and coupling, and C-terminal domains.A, disease-associated mutations found in the LBD (4950, 51, 5253, 6869, 7071). B, disease-associated mutations found in the regulatory and coupling domain (47–49, 52–54, 65, 7273, 74, 75, 76, 77, 78, 79, 80, 8182). C, disease-associated mutations found in the C-terminal domain (5253, 5455, 65, 8384, 85, 86, 87, 8889). Diseases associated with mutations in at least one isoform of IP3R include SCA29 (blue), Gillespie syndrome (orange), anhidrosis (pink), neuropathy (green), pontocerebellar hypoplasia (dark blue), spinocerebellar ataxia 15/16 (light blue), head and neck squamous cell carcinoma (red), Sézary Syndrome (purple), and familial isolated primary hyperparathyroidism (gray).
Figure 2
Figure 2
rIP3R1RW is nonfunctional when expressed in DT40-3KO due to decreased IP3 binding.A, Arg-269 (red) is conserved among all three human IP3R isoforms and evolutionarily conserved in the IP3R1 isoform. B, chimera (PDB code 3JAV) was used to visualize WT Arg-269 (yellow, left panel) and R269W mutant Trp-269 (yellow, right panel) interacting with IP3 in the ligand binding cleft. C, WT rIP3R1 and mutant rIP3R1RW cell lines were generated in the IP3R-null DT40-3KO cells and Western blotted. D, binding of 2.5 nm [3H]IP3 to WT rIP3R1 and rIP3R1RW in the presence of increasing concentrations (0 nm, 1 nm, 3 nm, 10 nm, 30 nm, 100 nm, 300 nm, 1 μm, 3 μm, 5 μm, 10 μm, and 50 μm) of cold IP3 in a competitive radioligand-binding assay. Data are mean ± S.E. of three (n = 3) independent experiments. E, representative traces show Ca2+ signals of IP3R-null DT40-3KO cells (blue), WT rIP3R1 (green), and rIP3R1RW (red) in response to trypsin (500 nm) when loaded with Fura-2/AM. F, scatter plots summarizing change in amplitude (peak ratio – basal ratio: average of initial 5 ratio points) for experiments similar to those shown in E. Boxes represent the 25th, 50th, and 75th percentiles, whereas whiskers represent 5th and 95th percentiles and mean is represented by colored circles. G, stacked bar graph summarizing the percentage of amplitudes from F, which fall into pre-determined ranges such that only those cells with an amplitude change greater than 0.1 ratio units (black portion of bars) are considered to be responding to the trypsin stimulus shown in E. Unless otherwise stated, all data above comes from at least n = 3 experiments. ***, p < 0.001 when compared with WT rIP3R1 cell line and ###, p < 0.001 when compared with DT40-3KO cell line; one-way ANOVA with Tukey's test performed in F (F19,4699= 753.0, p < 0.0001) and G (F19,50 = 284.6, p < 0.0001).
Figure 3
Figure 3
Heterotetramers of WT rIP3R1 and rIP3R1RW are predominantly nonfunctional when expressed in DT40-3KO.A, monomeric WT rIP3R1 and mutant rIP3R1RW cell lines, as well as dimeric R1/R1, R1/R1RW, R1RW/R1, and R1RW/R1RW cell lines were generated in the IP3R-null DT40-3KO cells and Western blotted. B, representative traces show Ca2+ signals of IP3R-null DT40-3KO cells (blue), WT rIP3R1 (green), and rIP3R1RW (red), R1/R1 (dark green), R1/R1RW (orange), R1RW/R1 (purple), and R1RW/R1RW (dark red) in response to trypsin (500 nm) when loaded with Fura-2/AM. C, scatter plots summarizing change in amplitude (peak ratio – basal ratio: average of initial 5 ratio points) for experiments similar to those shown in B. Boxes represent the 25th, 50th, and 75th percentiles, whereas whiskers represent 5th and 95th percentiles and mean is represented by colored circles. D, stacked bar graph summarizing the percentage of amplitudes from C, which fall into pre-determined ranges such that only those cells with an amplitude change greater than 0.1 ratio units (black portion of bars) are considered to be responding to the trypsin stimulus shown in B. E, traces show Ca2+ signals of β-escin permeabilized WT rIP3R1 (green), and rIP3R1RW (red), R1/R1 (dark green), R1/R1RW (orange), R1RW/R1 (purple), and R1RW/R1RW (dark red) cell lines in response to IP3 (30 μm) when loaded with Mag-Fura-2/AM. Data are mean ± S.E. of three (n = 3) independent experiments. Data for DT40-3KO, rIP3R1, and rIP3R1RW in B–D were from Fig. 2. Unless otherwise stated, all data above comes from at least n = 3 experiments. ***, p < 0.001 when compared with WT rIP3R1 cell line and ###, p < 0.001 when compared with DT40-3KO cell line; one-way ANOVA with Tukey's test was performed in C (F19,4699 = 753.0, p < 0.0001) and D (F19,50 = 284.6, p < 0.0001).
Figure 4
Figure 4
rIP3R1RW is poorly functional when expressed in HEK-3KO.A, multiple WT rIP3R1, WT hIP3R1, mutant rIP3R1RW, mutant rIP3R1ND, and mutant hIP3R1RW cell lines were generated in the IP3R-null HEK-3KO cells and Western blotted. B, immunocytochemistry for HEK-3KO cell lines expressing either WT rIP3R1 (left) or mutant rIP3R1RW (right). Top, IP3R1 detection (green); middle, DAPI detection (blue); bottom, merged images of IP3R1 and DAPI. Scale bars, 10 μm. C, representative traces show Ca2+ signals of IP3R-null HEK-3KO cells (blue), WT rIP3R1 (green), and rIP3R1RW (red) in response to trypsin (500 nm) when loaded with Fura-2/AM. D, scatter plots summarizing change in amplitude (peak ratio – basal ratio: average of initial 5 ratio points) for experiments similar to those shown in C when treated with 5, 50, and 500 nm of trypsin. Boxes represent the 25th, 50th, and 75th percentiles, whereas whiskers represent 5th and 95th percentiles and mean is represented by colored circles. E, stacked bar graph summarizing the percentage of amplitudes from D, which fall into pre-determined ranges such that only those cells with an amplitude change greater than 0.1 ratio units (black portion of bars) are considered to be responding to the trypsin stimulus shown in C. F, dose-response curve showing Ca2+ response of Fura-2/AM-loaded WT rIP3R1, WT hIP3R1, rIP3R1RW, and hIP3R1RW cells when treated with increasing concentrations (1 nm, 10 nm, 30 nm, 100 nm, 300 nm, 1 μm, and 3 μm) of trypsin using a Flexstation3 96-well–plate reader. Data are mean ± S.E. of three (n = 3) independent experiments. ***, p < 0.001 when compared with WT rIP3R1 cell line and ###, p < 0.001 when compared with HEK-3KO cell line; one-way ANOVA with Tukey's test was performed in D (F15,1352 = 407.1, p < 0.0001) and E (F15,34 = 108.5, p < 0.0001). Unless otherwise stated, all data above comes from at least n = 3 experiments.
Figure 5
Figure 5
rIP3R1ND is nonfunctional when expressed in DT40-3KO.A, Asn-602 (red) and Thr-594 (blue) are conserved among all three human IP3R isoforms and evolutionarily conserved in the IP3R1 isoform. B, chimera (PDB 6MU1) was used to visualize WT Asn-602 (yellow) between two α-helical regions in the ARM1 domain (red) and adjacent to the β-TF1 and β-TF2 domains in the N terminus (blue). C, WT rIP3R1 and several mutant rIP3R1ND cell lines generated in the IP3R-null DT40-3KO cells were Western blotted. D, binding of 2.5 nm [3H]IP3 to WT rIP3R1 (green) and rIP3R1ND (red) in the presence of increasing concentrations (0 nm, 1 nm, 3 nm, 10 nm, 30 nm, 100 nm, 300 nm, 1 μm, 3 μm, 5 μm, 10 μm, and 50 μm) of cold IP3 in a competitive radioligand binding assay. Data are mean ± S.E. of three (n = 3) independent experiments. E, representative traces show Ca2+ signals of IP3R-null DT40-3KO cells (blue), WT rIP3R1 (green), and rIP3R1ND (red) in response to trypsin (500 nm) when loaded with Fura-2/AM. F, scatter plots summarizing change in amplitude (peak ratio – basal ratio: average of initial 5 ratio points) for experiments similar to those shown in E. Boxes represent the 25th, 50th, and 75th percentiles, whereas whiskers represent 5th and 95th percentiles and mean is represented by colored circles. G, stacked bar graph summarizing the percentage of amplitudes from F, which fall into pre-determined ranges such that only those cells with an amplitude change greater than 0.1 ratio units (black portion of bars) are considered to be responding to the trypsin stimulus shown in E. Unless otherwise stated, all data above comes from at least n = 3 experiments. ***, p < 0.001 when compared with WT rIP3R1 cell line and ###, p < 0.001 when compared with DT40-3KO cell line; one-way ANOVA with Tukey's test was performed in F (F7,3070 = 525.9, p < 0.0001) and G (F9,19 = 177.2, p < 0.0001).
Figure 6
Figure 6
rIP3R1ND is poorly functional when expressed in HEK-3KO.A, multiple WT rIP3R1 and mutant rIP3R1ND cell lines were generated in the IP3R-null HEK-3KO cells and Western blotted. B, representative traces show Ca2+ signals of IP3R-null HEK-3KO cells (blue), WT rIP3R1 (green), and rIP3R1ND (red) in response to trypsin (500 nm) when loaded with Fura-2/AM. C, scatter plots summarizing change in amplitude (peak ratio – basal ratio: average of initial 5 ratio points) for experiments similar to those shown in B when treated with 0.5, 1, 10, and 500 nm trypsin. Boxes represent the 25th, 50th, and 75th percentiles, whereas whiskers represent 5th and 95th percentiles and mean is represented by colored circles. D, stacked bar graph summarizing the percentage of amplitudes from C, which fall into pre-determined ranges such that only those cells with an amplitude change greater than 0.1 ratio units (black portion of bars) are considered to be responding to the trypsin stimulus shown in B. E, dose-response curve showing Ca2+ response of Fura-2/AM-loaded WT rIP3R1 and rIP3R1ND cells when treated with increasing concentrations (0.5 nm, 1 nm, 3 nm, 10 nm, 30 nm, 100 nm, 300 nm, 500 nm, 1 μm, 2.5 μm, and 5 μm) of trypsin using a Flexstation3 96-well–plate reader. Data are mean ± S.E. of three (n = 3) independent experiments. **, p < 0.01 and ***, p < 0.001 when compared with WT rIP3R1 cell line and ###, p < 0.001 when compared with HEK-3KO cell line; one-way ANOVA with Tukey's test was performed in C (F10,791 = 532.1, p < 0.0001) and D (F10,22 = 108.6, p < 0.0001). Unless otherwise stated, all data above comes from at least n = 3 experiments.
Figure 7
Figure 7
Heterotetramers of WT rIP3R1 and rIP3R1ND are predominantly nonfunctional when expressed in DT40-3KO.A, monomeric WT rIP3R1 and mutant rIP3R1ND cell lines, as well as dimeric R1/R1, R1/R1ND, and R1ND/R1 cell lines were generated in the IP3R-null DT40-3KO cells and Western blotted. B, representative traces show Ca2+ signals of IP3R-null DT40-3KO cells (blue), WT rIP3R1 (green), and rIP3R1ND (red), R1/R1 (dark green), R1/R1ND (orange), and R1ND/R1 (purple) in response to trypsin (500 nm) when loaded with Fura-2/AM. C, scatter plots summarizing the change in amplitude (peak ratio – basal ratio: average of initial 5 ratio points) for experiments similar to those shown in B. Boxes represent the 25th, 50th, and 75th percentiles, whereas whiskers represent the 5th and 95th percentiles and the mean is represented by colored circles. D, stacked bar graph summarizing the percentage of amplitudes from C, which fall into pre-determined ranges such that only those cells with an amplitude change greater than 0.1 ratio units (black portion of bars) are considered to be responding to the trypsin stimulus shown in B. E, monomeric WT rIP3R1, dimeric R1/R1, trimeric R1/R1/R1, and tetrameric R1/R1/R1/ND cell lines generated in the IP3R-null DT40-3KO cells were Western blotted. F, multiple representative traces show Ca2+ signals of IP3R-null DT40-3KO cells expressing R1/R1/R1/R1 (green) and R1/R1/R1/ND (red) tetramers in response to trypsin (500 nm) when loaded with Fura-2/AM. G, scatter plots summarizing change in amplitude for experiments similar to those shown in F when treated with 500 nm trypsin. H, stacked bar graph summarizing the percentage of amplitudes from G, which fall into pre-determined ranges such that only those cells with an amplitude change greater than 0.1 ratio units (black portion of bars) are considered to be responding to the trypsin stimulus shown in F. I, traces show Ca2+ signals of β-escin permeabilized IP3R-null DT40-3KO cells (blue), R1/R1/R1/R1 (green), and R1/R1/R1/ND (red) cell lines in response to IP3 (30 μm) when loaded with Mag-Fura-2/AM. Data are mean ± S.E. of three (n = 3) independent experiments. Data for rIP3R1 and rIP3R1ND in B–D and DT40-3KO in B–H came from Fig. 5. Unless otherwise stated, all data above comes from at least n = 3 experiments. ***, p < 0.001 when compared with WT rIP3R1 cell line and ###, p < 0.001 when compared with DT40-3KO cell line; one-way ANOVA with Tukey's test was performed in C (F7,3070 = 525.9, p < 0.0001), D (F9,19 = 177.2, p < 0.0001), G (F7,3070 = 525.9, p < 0.0001), and H (F9,19 = 177.2, p < 0.0001).
Figure 8
Figure 8
mIP3R2GS is nonfunctional when expressed in DT40-3KO.A, Gly-2498 (red) is conserved among all three human IP3R isoforms and evolutionarily conserved in the IP3R2 isoform. B, chimera (PDB 6MU1) was used to visualize WT Gly-2498 (yellow) in the selectivity filter (blue) of two monomers, just prior to the 6th transmembrane (TM) domain (red). C, WT mIP3R2 and mutant mIP3R2GS cell lines were generated in the IP3R-null DT40-3KO cells and Western blotted. D, binding of 2.5 nm [3H]IP3 to WT mIP3R2 and mIP3R2GS in the presence of a maximal concentration of 50 μm cold IP3 in a competitive radioligand binding assay (p = 0.9077). Data are mean ± S.E. of three (n = 3) independent experiments. E, representative traces show Ca2+ signals of IP3R-null DT40-3KO cells (blue), WT mIP3R2 (green), and mIP3R2GS (red) in response to trypsin (500 nm) when loaded with Fura-2/AM. F, scatter plots summarizing change in amplitude (peak ratio – basal ratio: average of initial 5 ratio points) for experiments similar to those shown in E. Boxes represent the 25th, 50th, and 75th percentiles, whereas whiskers represent 5th and 95th percentiles and mean is represented by colored circles. G, stacked bar graph summarizing the percentage of amplitudes from F, which fall into pre-determined ranges such that only those cells with an amplitude change greater than 0.1 ratio units (black portion of bars) are considered to be responding to the trypsin stimulus shown in E. Unless otherwise stated, all data above comes from at least n = 3 experiments. ***, p < 0.001 when compared with WT rIP3R1 cell line and ###, p < 0.001 when compared with HEK-3KO cell line; unpaired t test was performed in D and one-way ANOVA with Tukey's test was performed in F (F9,1568 = 437.7, p < 0.0001) and G (F9,27 = 61.27, p < 0.0001).
Figure 9
Figure 9
mIP3R2GS is predominantly nonfunctional when expressed in HEK-3KO.A, multiple WT mIP3R2 and mutant mIP3R2GS cell lines were generated in the IP3R-null HEK-3KO cells and Western blotted. B, representative traces show Ca2+ signals of IP3R-null HEK-3KO cells (blue), WT mIP3R2 (green), and mIP3R2GS (red) in response to trypsin (500 nm) when loaded with Fura-2/AM. C, scatter plots summarizing change in amplitude (peak ratio – basal ratio: average of initial 5 ratio points) for experiments similar to those shown in B when treated with 500 nm trypsin. Boxes represent the 25th, 50th, and 75th percentiles, whereas whiskers represent 5th and 95th percentiles and mean is represented by colored circles. D, stacked bar graph summarizing the percentage of amplitudes from C, which fall into pre-determined ranges such that only those cells with an amplitude change greater than 0.1 ratio units (black portion of bars) are considered to be responding to the trypsin stimulus shown in B. E, dose-response curve showing Ca2+ response of Fura-2/AM-loaded WT mIP3R2 and mIP3R2GS cells when treated with increasing concentrations (1 nm, 10 nm, 30 nm, 100 nm, 300 nm, 1 μm, and 3 μm) of trypsin using a Flexstation3 96-well–plate reader. Data are mean ± S.E. of three (n = 3) independent experiments. ***, p < 0.001 when compared with WT rIP3R1 cell line and ###, p < 0.001 when compared with HEK-3KO cell line; one-way ANOVA with Tukey's test was performed in C (F6,809 = 707.1, p < 0.0001) and D (F6,17 = 335.6, p < 0.0001). Unless otherwise stated, all data above comes from at least n = 3 experiments.
Figure 10
Figure 10
Heterotetramers of WT mIP3R2 and mIP3R2GS retain partial functionality when expressed in DT40-3KO.A, the current IP3R structural model based on the cryo-EM structure of IP3R1 (PDB codes 6MU1 and 6MU2) indicates that the G2498S substitution may form H bonds with neighboring Arg-2544. B, monomeric WT mIP3R2 and mutant mIP3R2GS cell lines, as well as dimeric R2/R2, R2/R2GS, R2GS/R2, and R2GS/R2GS cell lines generated in the IP3R-null DT40-3KO cells were Western blotted. C, representative traces show Ca2+ signals of IP3R-null DT40-3KO cells (blue), WT mIP3R2 (green), and mIP3R2GS (red), R2/R2 (dark green), R2/R2GS (orange), R2GS/R2 (purple), and R2GS/R2GS (dark red) in response to trypsin (500 nm) when loaded with Fura-2/AM. D, scatter plots summarizing change in amplitude (peak ratio – basal ratio: average of initial 5 ratio points) for experiments similar to those shown in C. Boxes represent the 25th, 50th, and 75th percentiles, whereas whiskers represent the 5th and 95th percentiles and mean is represented by colored circles. E, stacked bar graph summarizing the percentage of amplitudes from D, which fall into pre-determined ranges such that only those cells with an amplitude change greater than 0.1 ratio units (black portion of bars) are considered to be responding to the trypsin stimulus shown in C. F, traces show Ca2+ signals of β-escin permeabilized WT mIP3R2 (green), and mIP3R2GS (red), R2/R2 (dark green), R2/R2GS (orange), R2GS/R2 (purple), and R2GS/R2GS (dark red) cell lines in response to IP3 (30 μm) when loaded with Mag-Fura-2/AM. Data are mean ± S.E. of three (n = 3) independent experiments. Data for DT40-3KO, mIP3R2, and mIP3R2GS in D–-F came from Fig. 8. *, p < 0.05 and ***, p < 0.001 when compared with corresponding WT cell line (WT mIP3R2 for monomers and R2/R2 cell line for dimers) and ###, p < 0.001 when compared with DT40-3KO cell line; one-way ANOVA with Tukey's test was performed in D (F9,1568 = 437.7, p < 0.0001) and E (F9,27 = 61.27, p < 0.0001). Unless otherwise stated, all data above comes from at least n = 3 experiments. ns, non-significant.

References

    1. Chin K.V., Cade C., Brostrom C.O., Galuska E.M., Brostrom M.A. Calcium-dependent regulation of protein synthesis at translational initiation in eukaryotic cells. J. Biol. Chem. 1987;262:16509–16514. 3680263. - PubMed
    1. Nicotera P., Orrenius S. Ca2+ and cell death. Ann. N. Y. Acad. Sci. 1992;648:17–27. doi: 10.1111/j.1749-6632.1992.tb24520.x. 1637044. - DOI - PubMed
    1. Berridge M.J. Inositol trisphosphate and calcium signalling. Nature. 1993;361:315–325. doi: 10.1038/361315a0. 8381210. - DOI - PubMed
    1. Berridge M.J., Bootman M.D., Lipp P. Calcium: a life and death signal. Nature. 1998;395:645–648. doi: 10.1038/27094. 9790183. - DOI - PubMed
    1. Berridge M.J., Lipp P., Bootman M.D. The versatility and universality of calcium signalling. Nat. Rev. Mol. Cell Biol. 2000;1:11–21. doi: 10.1038/35036035. 11413485. - DOI - PubMed

Publication types

Substances

LinkOut - more resources