. 2020 Nov 10;117(45):28014-28025.
doi: 10.1073/pnas.2000260117. Epub 2020 Oct 22.

Visualization of the HIV-1 Env glycan shield across scales

Affiliations

Visualization of the HIV-1 Env glycan shield across scales

Zachary T Berndsen et al. Proc Natl Acad Sci U S A. .

Abstract

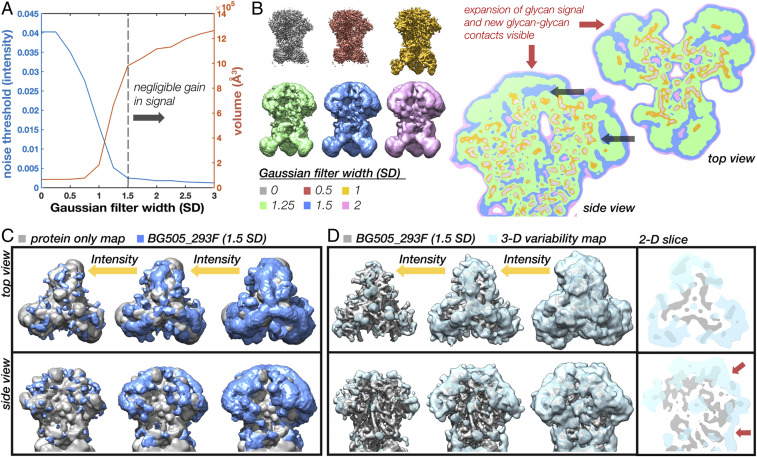
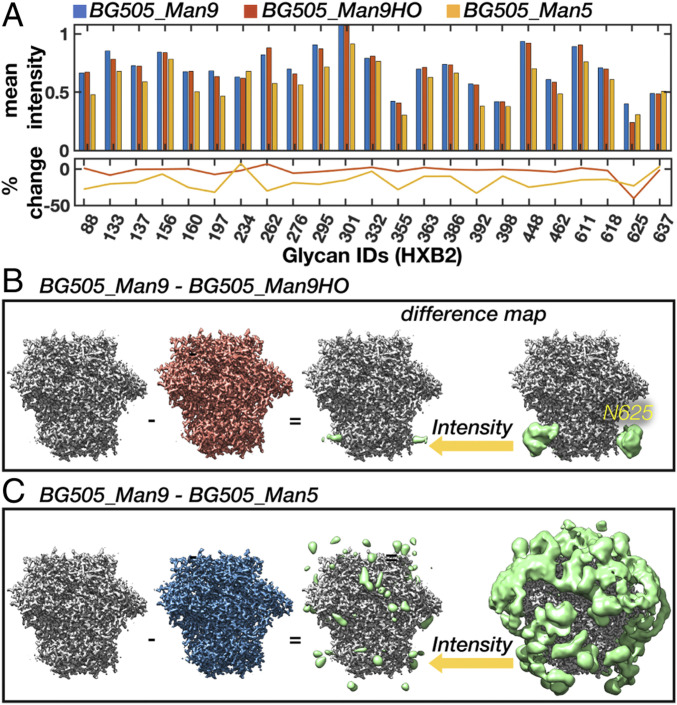
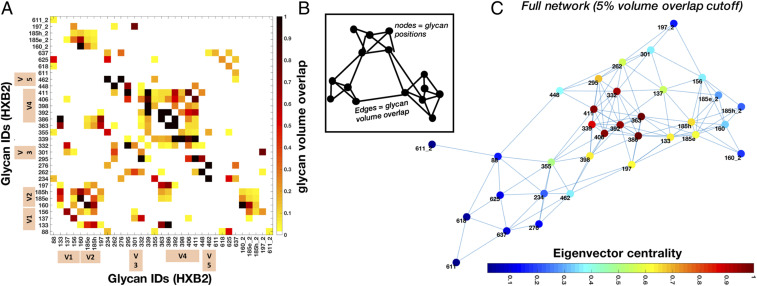
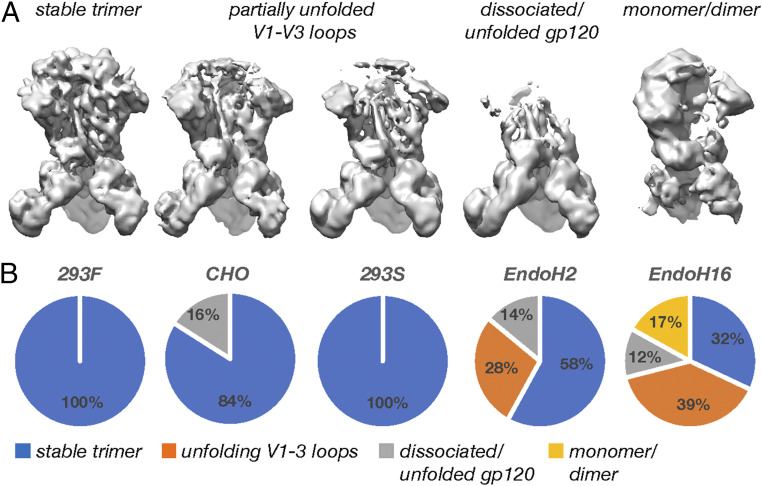
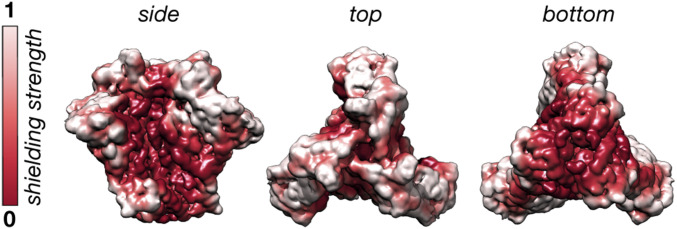
The dense array of N-linked glycans on the HIV-1 envelope glycoprotein (Env), known as the "glycan shield," is a key determinant of immunogenicity, yet intrinsic heterogeneity confounds typical structure-function analysis. Here, we present an integrated approach of single-particle electron cryomicroscopy (cryo-EM), computational modeling, and site-specific mass spectrometry (MS) to probe glycan shield structure and behavior at multiple levels. We found that dynamics lead to an extensive network of interglycan interactions that drive the formation of higher-order structure within the glycan shield. This structure defines diffuse boundaries between buried and exposed protein surface and creates a mapping of potentially immunogenic sites on Env. Analysis of Env expressed in different cell lines revealed how cryo-EM can detect subtle changes in glycan occupancy, composition, and dynamics that impact glycan shield structure and epitope accessibility. Importantly, this identified unforeseen changes in the glycan shield of Env obtained from expression in the same cell line used for vaccine production. Finally, by capturing the enzymatic deglycosylation of Env in a time-resolved manner, we found that highly connected glycan clusters are resistant to digestion and help stabilize the prefusion trimer, suggesting the glycan shield may function beyond immune evasion.

Keywords: HIV-1; cryo-EM; glycoprotein; molecular modeling; vaccine.


Conflict of interest statement

The authors declare no competing interest.

Figures

Fig. 1.
Fig. 1.
Soluble SOSIP in complex with a base-specific Fab as a model system for cryo-EM analysis of the native HIV-1 Env glycan shield. (A) Segmented cryo-EM map of BG505 SOSIP.664 in complex with three copies of the RM20A3 Fab. The green circle is meant to represent the glycan shield. HC, heavy chain; LC, light chain. (B) Refined atomic model with stars highlighting several N-linked glycans. (C) Three-dimensional angular distribution histogram. (D) Surface representation of the refined atomic model viewed from the side and from the bottom with the Fab chains removed. (E) Sharpened 3.1-Å-resolution cryo-EM map at high and low threshold colored by local resolution. (F) Symbol nomenclature for glycan depiction (74) of a representative high-mannose and complex-type glycan (Left). Cryo-EM map density for six representative glycans from the refined atomic model (numbers corresponding to the stars in B).
Fig. 2.
Fig. 2.
Scale-space and 3-D variability analysis reveals a low-resolution structure in the glycan shield. (A) Noise threshold and volume at the noise threshold as a function of Gaussian filter width measured in SDs showing the emergence of glycan signal at low resolutions and plateau around 1.5 SD. (B) BG505_293F cryo-EM map at six representative scales along with 2-D slices through the maps overlaid on top of one another showing the emergence of glycan signal and new glycan–glycan contacts visible at low resolutions and thresholds (red arrows). Black arrows are pointing to protein surfaces occluded by glycans. (C) Gaussian filtered (1.5 SD) BG505_293F map (blue) visualized at three intensity thresholds along with a protein-only map (gray). (D) SPARX 3-D variability map (light blue) visualized at three intensity thresholds along with the BG505_293F map (gray) and 2-D slices through the top and side of the map with red arrows highlighting glycan–glycan contacts.
Fig. 3.
Fig. 3.
ALLOSMOD-based HT-AM pipeline for fast and robust sampling of fully glycosylated Env. (A) Ten homology models used as protein scaffolds. (B) One of the 10 models with a single relaxed Man9 glycan at each site. (C) One fully glycosylated and relaxed model for each of the 10 protein scaffolds. (D) Close-up of the N88 glycan showing a single glycan pose (Left) and all 1,000 poses (Right). (E) Full glycan average rmsf for all 1,000 poses. (F) Glycan-only rmsf for all 1,000 poses. (G) Full glycan average rmsf for all 1,000 poses at the fifth mannose residue for both the Man9 and Man5 ensembles.
Fig. 4.
Fig. 4.
Simulated cryo-EM maps from the HT-AM ensembles reproduce defining features of the experimental data. (A) Simulated cryo-EM map generated from the Man9 ALLOSMOD ensemble (teal) and a protein-only (PO, gray) ensemble. Each of the 1,000 models was projected at 100 uniformly distributed angles with added white noise and reconstructed in Relion with C3 symmetry then sharpened with a data derived B-factor. (B) Noise threshold and volume at the noise threshold as a function of Gaussian filter width (SD) for the BG505_Man9, BG505_Man5, and BG505_PO simulated cryo-EM maps with dashed lines indicating the volume sampled by each ensemble. (C) Gaussian filtered (1.5 SD) BG505_Man9 (teal) and BG505_PO (gray) maps along with the SPARX 3-D variability map (light blue) viewed at high- and low-intensity thresholds.
Fig. 5.
Fig. 5.
Measuring glycan dynamics from cryo-EM maps reveals close agreement between simulation and experiment. (A) Gaussian filtered (1.5 SD) BG505_Man9 simulated cryo-EM map (transparent) and atomic model used for local intensity analysis. Also shown is a single glycan stem with a spherical probe around the BMA residue. (B) Normalized mean intensity around BMA residues for BG505_Man9 (probe radius 2.3 Å) and the inverse normalized full glycan average rmsf. Pearson correlation coefficient ∼0.88 (P value = 2.1e-8). (C) Normalized mean intensity around BMA residues for BG505_293F and BG505_Man9 along with the absolute difference at each site. Pearson correlation coefficient ∼0.46 (P = 0.03).
Fig. 6.
Fig. 6.
Detecting changes in glycan dynamics, occupancy, and chemical composition from simulated cryo-EM maps. (A) Mean intensity around each glycan BMA residue for the BG505_Man9, BG505_Man5, and BG505_Man9HO maps along with the percent change from BG505_Man9. (B and C) BG505_Man9 − BG505_Man9HO (B) and BG505_Man9 − BG505_Man5 (C) difference maps (Gaussian filtered) at two intensity thresholds (Right; green) along with high-resolution sharpened maps (Left).
Fig. 7.
Fig. 7.
Detection of cell type-specific changes in glycan shield composition and dynamics with cryo-EM. (A) Mean intensity at each glycan BMA residue for the BG505_293F, BG505_293S, and BG505_CHO cryo-EM maps along with the percent change from BG505_293F. (BD) BG505_293F − BG505_293S (B), BG505_CHO − BG505_293S (C), and BG505_293F − BG505_CHO (D) difference maps at two intensity thresholds. All difference maps were multiplied by a soft mask around the RM20A3 Fabs and then smoothed with a 2-SD Gaussian filter. (EH) Flyouts of the regions outlined by dashed red boxes in BD.
Fig. 8.
Fig. 8.
Probabilistic glycan–glycan interaction network for the Man9 ensemble. (A) Glycan–glycan volume overlap matrix. Interprotomer overlap is given by the suffix “_2” and the variable loop glycans are indicated by tan color bars. The overlap fraction is normalized with at least 50% overlap being designated as 1. (B) Cartoon model of the glycan–glycan interaction network generated by interpreting the overlap matrix as an adjacency matrix. The edge length is drawn inversely proportional to the overlap value. Edges represent the overlap between two glycans represented by nodes. (C) Glycan–glycan interaction network calculated from the matrix in A with nodes colored by normalized eigenvector centrality.
Fig. 9.
Fig. 9.
Time-resolved cryo-EM reveals that highly connected glycan clusters are resistant to enzymatic digestion. (A) Cartoon schematic of the Endo H digestion of high-mannose glycans and an illustration of the three reaction times captured by time-resolved cryo-EM. (B) Mean intensity around glycan BMA residues for the BG505_293S, BG505_EndoH2, and BG505_EndoH16 cryo-EM maps along with the percent occupancy at each site. Occupancy was calculated assuming a linear relationship between occupancy and intensity with the initial occupancy determined by MS. (C) BG505_293S − BG505_EndoH2 and BG505_EndoH2 − BG505_EndoH16 difference maps at two intensity thresholds. Difference maps were first multiplied by a soft mask around the RM20A3 Fabs and smoothed with a 2-SD Gaussian filter. Also shown is the residual glycan signal remaining after 16 h of digestion isolated by masking out the protein density. (D) Overlay of the three maps from B colored according to susceptibility to Endo H digestion. (E) Normalized Endo H protection score measured as the cumulative occupancy at each site in the two digestion intermediates and the normalized eigencentrality from the Man9 volume overlap network. Pearson correlation coefficient of ∼0.8 (P = 1.14e-05).
Fig. 10.
Fig. 10.
Digestion of the glycan shield leads to progressive destabilization of the Env trimer. (A) Representative cryo-EM maps of the unfolding intermediates captured by 3-D classification. (B) Pie charts showing the relative percentages of each class present in the five cryo-EM datasets presented here.
Fig. 11.
Fig. 11.
Quantifying the glycan shielding effect from cryo-EM maps. The normalized glycan shielding effect for BG505_CHO defined as the total glycan signal within an ∼7-Å-radius spherical probe centered at each voxel. White surfaces are strongly shielded by glycans.

References

    1. Fenouillet E., Gluckman J. C., Jones I. M., Functions of HIV envelope glycans. Trends Biochem. Sci. 19, 65–70 (1994). - PubMed
    1. Grundner C., et al. , Factors limiting the immunogenicity of HIV-1 gp120 envelope glycoproteins. Virology 330, 233–248 (2004). - PubMed
    1. Dacheux L., et al. , Evolutionary dynamics of the glycan shield of the human immunodeficiency virus envelope during natural infection and implications for exposure of the 2G12 epitope. J. Virol. 78, 12625–12637 (2004). - PMC - PubMed
    1. Lasky L. A., et al. , Neutralization of the AIDS retrovirus by antibodies to a recombinant envelope glycoprotein. Science 233, 209–212 (1986). - PubMed
    1. Doores K. J., et al. , Envelope glycans of immunodeficiency virions are almost entirely oligomannose antigens. Proc. Natl. Acad. Sci. U.S.A. 107, 13800–13805 (2010). - PMC - PubMed

Publication types

MeSH terms

LinkOut - more resources