. 2020 Nov 10;117(45):28393-28401.
doi: 10.1073/pnas.2005531117. Epub 2020 Oct 22.

High-amplitude cofluctuations in cortical activity drive functional connectivity

Affiliations

High-amplitude cofluctuations in cortical activity drive functional connectivity

Farnaz Zamani Esfahlani et al. Proc Natl Acad Sci U S A. .

Abstract

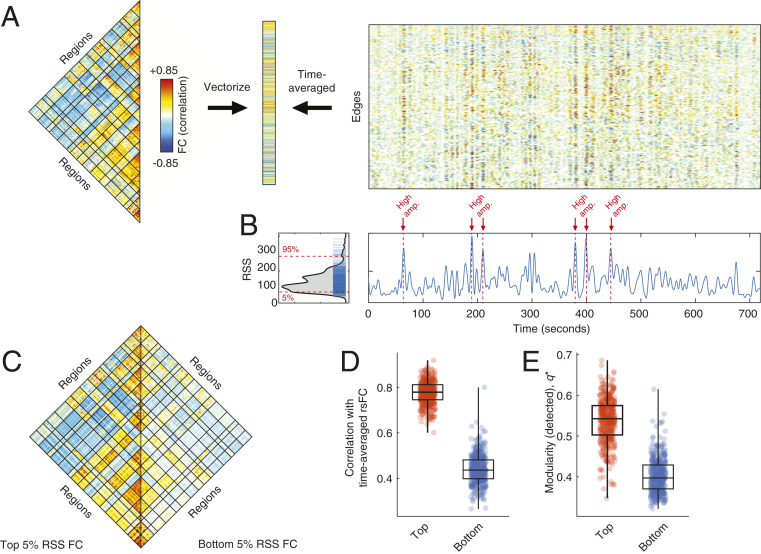
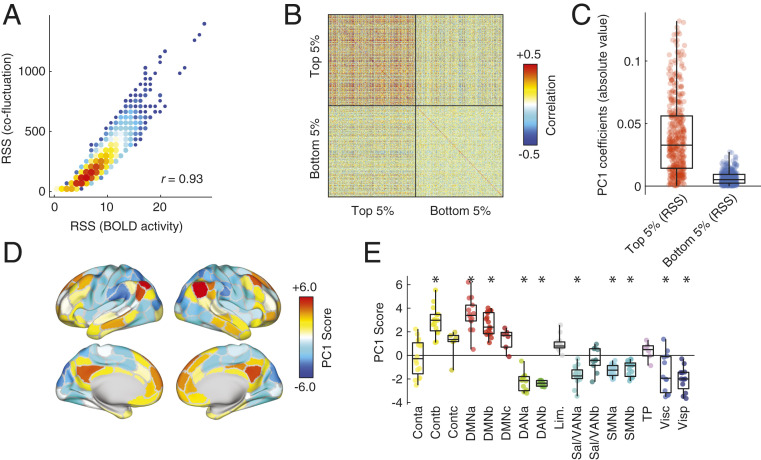
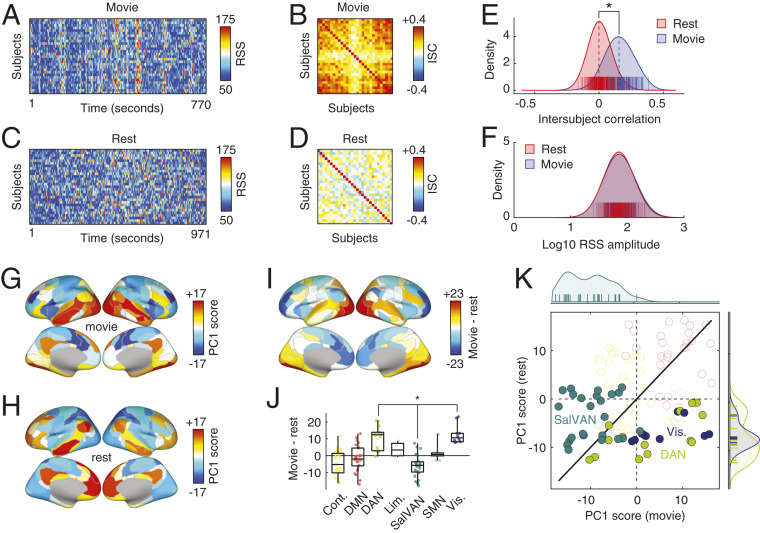
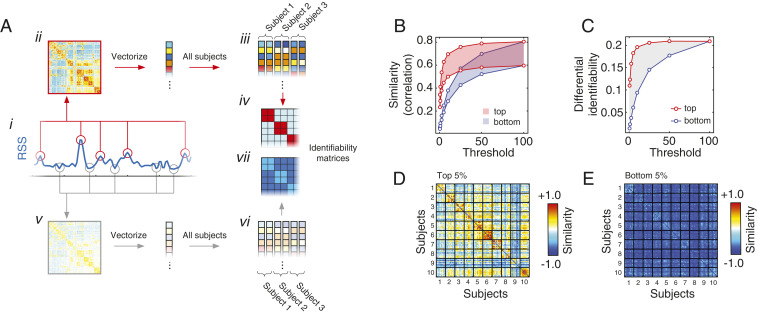
Resting-state functional connectivity is used throughout neuroscience to study brain organization and to generate biomarkers of development, disease, and cognition. The processes that give rise to correlated activity are, however, poorly understood. Here we decompose resting-state functional connectivity using a temporal unwrapping procedure to assess the contributions of moment-to-moment activity cofluctuations to the overall connectivity pattern. This approach temporally resolves functional connectivity at a timescale of single frames, which enables us to make direct comparisons of cofluctuations of network organization with fluctuations in the blood oxygen level-dependent (BOLD) time series. We show that surprisingly, only a small fraction of frames exhibiting the strongest cofluctuation amplitude are required to explain a significant fraction of variance in the overall pattern of connection weights as well as the network's modular structure. These frames coincide with frames of high BOLD activity amplitude, corresponding to activity patterns that are remarkably consistent across individuals and identify fluctuations in default mode and control network activity as the primary driver of resting-state functional connectivity. Finally, we demonstrate that cofluctuation amplitude synchronizes across subjects during movie watching and that high-amplitude frames carry detailed information about individual subjects (whereas low-amplitude frames carry little). Our approach reveals fine-scale temporal structure of resting-state functional connectivity and discloses that frame-wise contributions vary across time. These observations illuminate the relation of brain activity to functional connectivity and open a number of directions for future research.

Keywords: dynamics; functional connectivity; naturalistic stimuli; time-varying connectivity.


Conflict of interest statement

The authors declare no competing interest.

Figures

Fig. 1.
Fig. 1.
Cofluctuation time series reveal bursty structure of resting-state functional connectivity. (A) We use a temporal unwrapping of the Pearson correlation to generate cofluctuation time series for every pair of brain regions (edges). The elements of the cofluctuation time series are the element-wise products of z-scored regional BOLD time series that, when averaged across time, yield vectors that are exactly equal to the Pearson correlation coefficient and can be rearranged to create a resting-state functional connectivity matrix. (B) We find that the cofluctuation time series contains moments in time where many edges collectively cofluctuate. We can identify these moments by calculating the RSS across all cofluctuation time series and plotting this value as a function of time. In B we label high- and low-amplitude frames. The distribution of edge cofluctuation amplitude is heavy tailed. We wanted to assess the contribution of high- and low-amplitude frames to the overall pattern of functional connectivity. To do this, we extracted the top and bottom 5% of all time points (ordered by cofluctuation amplitude) and estimated functional connectivity from those points alone. (C) Average functional connectivity across 100 subjects using top 5% (Left) and bottom 5% (Right). (D) In general, the networks estimated using the top 5% of time points were much more similar to traditional functional connectivity than those estimated using the bottom 5% of time points. (E) We performed a similar comparison of network modularity using networks reconstructed using top and bottom 5% frames.
Fig. 2.
Fig. 2.
Relationship of network cofluctuations with BOLD fluctuations. In rsFC Is Driven by Short-Lived and High-Amplitude Cofluctuation Events we demonstrated that resting-state functional connectivity could be explained on the basis of relatively few frames during which high-amplitude cofluctuations occurred. Here we relate those cofluctuation frames to BOLD activity fluctuations. We first calculate the RSS amplitude of BOLD activity at each time point and compare that to the amplitude of cofluctuations. (A) Pooling data from across subjects, we find that these two variables are highly correlated. (B) To investigate this relationship further, we extract mean activity patterns for each subject and for each scan during the top and bottom 5% time points, indexed according to cofluctuation amplitude. Here we show the correlation matrix of those activity vectors. (C) We then performed a principal component analysis of this correlation matrix and found that absolute value of coefficients for the first component (PC1) were greater for the top 5% than the bottom 5%, and (D and E) the PC1 score corresponded to activity patterns that emphasized correlated fluctuations of default mode and control networks that were weakly or anticorrelated with fluctuations elsewhere in the brain. Asterisks indicate systems whose mean PC1 score was significantly greater (more positive or negative) than expected by chance (permutation test; FDR fixed at 5%; padjusted=0.018). These observations suggest that high-amplitude cofluctuations, which drive resting-state functional connectivity, are underpinned by instantaneous activation and deactivation of default mode and control network areas.
Fig. 3.
Fig. 3.
Whole-brain cofluctuation amplitude synchronizes during passive movie watching. We compared cofluctuation time series during resting state and movie watching. For both conditions, we computed cofluctuation time series for 29 subjects. We show those time series in A (movie) and C (rest). We find that when subjects watch movies, their cofluctuation time series are synchronous, presumably due to the shared audiovisual stimulus. At rest, cofluctuation time series are asynchronous. We demonstrate this synchrony by computing the intersubject correlation matrix of subjects’ cofluctuation time series. We show matrices for movie watching and rest in B and D, respectively. By comparing the elements of these matrices, we demonstrate statistically that movie watching leads to increased intersubject correlations. We show the distributions in E. We find, however, that the overall amplitude of fluctuations (RSS) is not statistically different from one condition to the other (F). To further contrast these two conditions, we repeated the analysis from High-Amplitude Frames Are Driven by Fluctuations of Task-Positive/Task-Negative Mode of Brain Activity to identify modes of brain activity that underpin high-amplitude frames. We find that the resting mode recapitulates the topographic distribution reported in the previous section (H), emphasizing a task-positive/task-negative division. During movie watching, however, the mode of activity emphasizes contributions of visual and dorsal attention networks (G). In IK, we compare rest and movie-watching modes of activity more directly. I depicts the region-wise differences in modes, J groups those differences by system, and K presents them as a scatterplot, highlighting differences associated with visual, dorsal attention, and salience/ventral attention networks.
Fig. 4.
Fig. 4.
Connectome fingerprints are strong during high-amplitude frames and weaker during low-amplitude frames. We investigated whether subject-specific features of rsFC were more prevalent during high- or low-amplitude cofluctuations. To address this question, we identified frames (time points) with the highest and lowest cofluctuation amplitude and estimated subjects FC using these data only. We then calculated the intersubject similarity matrix, i.e., the identifiability matrix. (A) Illustration of this general procedure, beginning by isolating high-amplitude time points (i), estimation of FC (ii), repeating this procedure for all subjects (iii), and estimating the intersubject similarity matrix (iv). An identical procedure was carried out for low-amplitude frames and is illustrated in vvii. (B) We calculated the mean within- and between-subject similarity using both the top (red) and bottom (blue) frames, ordered by cofluctuation amplitude. For each set of frames, we produce two separate curves, one for the within-subject similarity and another for the between-subject similarity. The area between the curves is the differential identifiability, or the extent to which subjects’ FC patterns are more similar to themselves than to FC estimated from other subjects. (C) We found that differential identifiability was always greater when FC was estimated using the top frames, ordered by amplitude. For the sake of visualization, we show identifiability matrices estimated using (D) high- and (E) low-amplitude frames.

References

    1. Craddock R. C., et al. , Imaging human connectomes at the macroscale. Nat. Methods 10, 524–539 (2013). - PMC - PubMed
    1. Rogers B. P., Morgan V. L., Newton A. T., Gore J. C., Assessing functional connectivity in the human brain by fMRI. Magn. Reson. Imaging 25, 1347–1357 (2007). - PMC - PubMed
    1. Gu S., et al. , Emergence of system roles in normative neurodevelopment. Proc. Natl. Acad. Sci. U.S.A. 112, 13681–13686 (2015). - PMC - PubMed
    1. Betzel R. F., et al. , Changes in structural and functional connectivity among resting-state networks across the human lifespan. Neuroimage 102, 345–357 (2014). - PubMed
    1. Cole M. W., Bassett D. S., Power J. D., Braver T. S., Petersen S. E., Intrinsic and task-evoked network architectures of the human brain. Neuron 83, 238–251 (2014). - PMC - PubMed

Publication types

LinkOut - more resources