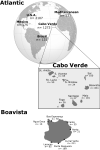
Distribution of genetic diversity reveals colonization patterns and philopatry of the loggerhead sea turtles across geographic scales
- PMID: 33093463
- PMCID: PMC7583243
- DOI: 10.1038/s41598-020-74141-6
Distribution of genetic diversity reveals colonization patterns and philopatry of the loggerhead sea turtles across geographic scales
Abstract
Understanding the processes that underlie the current distribution of genetic diversity in endangered species is a goal of modern conservation biology. Specifically, the role of colonization and dispersal events throughout a species' evolutionary history often remains elusive. The loggerhead sea turtle (Caretta caretta) faces multiple conservation challenges due to its migratory nature and philopatric behaviour. Here, using 4207 mtDNA sequences, we analysed the colonisation patterns and distribution of genetic diversity within a major ocean basin (the Atlantic), a regional rookery (Cabo Verde Archipelago) and a local island (Island of Boa Vista, Cabo Verde). Data analysis using hypothesis-driven population genetic models suggests the colonization of the Atlantic has occurred in two distinct waves, each corresponding to a major mtDNA lineage. We propose the oldest lineage entered the basin via the isthmus of Panama and sequentially established aggregations in Brazil, Cabo Verde and in the area of USA and Mexico. The second lineage entered the Atlantic via the Cape of Good Hope, establishing colonies in the Mediterranean Sea, and from then on, re-colonized the already existing rookeries of the Atlantic. At the Cabo Verde level, we reveal an asymmetric gene flow maintaining links across island-specific nesting groups, despite significant genetic structure. This structure stems from female philopatric behaviours, which could further be detected by weak but significant differentiation amongst beaches separated by only a few kilometres on the island of Boa Vista. Exploring biogeographic processes at diverse geographic scales improves our understanding of the complex evolutionary history of highly migratory philopatric species. Unveiling the past facilitates the design of conservation programmes targeting the right management scale to maintain a species' evolutionary potential.
Conflict of interest statement
The authors declare no competing interests.
Figures


Similar articles
-
Living on the edge: how philopatry maintains adaptive potential.Proc Biol Sci. 2013 May 29;280(1763):20130305. doi: 10.1098/rspb.2013.0305. Print 2013 Jul 22. Proc Biol Sci. 2013. PMID: 23720544 Free PMC article.
-
Geographic patterns of genetic variation in a broadly distributed marine vertebrate: new insights into loggerhead turtle stock structure from expanded mitochondrial DNA sequences.PLoS One. 2014 Jan 23;9(1):e85956. doi: 10.1371/journal.pone.0085956. eCollection 2014. PLoS One. 2014. PMID: 24465810 Free PMC article.
-
Population genetics and phylogeography of sea turtles.Mol Ecol. 2007 Dec;16(23):4886-907. doi: 10.1111/j.1365-294X.2007.03542.x. Epub 2007 Oct 16. Mol Ecol. 2007. PMID: 17944856
-
Investigating sea turtle migration using DNA markers.Curr Opin Genet Dev. 1994 Dec;4(6):882-6. doi: 10.1016/0959-437x(94)90074-4. Curr Opin Genet Dev. 1994. PMID: 7888759 Review.
-
Patterns of diversity of the Rissoidae (Mollusca: Gastropoda) in the Atlantic and the Mediterranean region.ScientificWorldJournal. 2012;2012:164890. doi: 10.1100/2012/164890. Epub 2012 May 22. ScientificWorldJournal. 2012. PMID: 22693430 Free PMC article. Review.
Cited by
-
Origin and expansion of the world's most widespread pinniped: Range-wide population genomics of the harbour seal (Phoca vitulina).Mol Ecol. 2022 Mar;31(6):1682-1699. doi: 10.1111/mec.16365. Epub 2022 Feb 9. Mol Ecol. 2022. PMID: 35068013 Free PMC article.
-
Long-term survey of sea turtles (Caretta caretta) reveals correlations between parasite infection, feeding ecology, reproductive success and population dynamics.Sci Rep. 2020 Oct 29;10(1):18569. doi: 10.1038/s41598-020-75498-4. Sci Rep. 2020. PMID: 33122760 Free PMC article.
-
Population genetics of the critically endangered three-striped turtle, Batagur dhongoka, from the Ganga river system using mitochondrial DNA and microsatellite analysis.Sci Rep. 2024 Mar 11;14(1):5920. doi: 10.1038/s41598-024-54816-0. Sci Rep. 2024. PMID: 38467641 Free PMC article.
-
DNA Methylation Carries Signatures of Sublethal Effects Under Thermal Stress in Loggerhead Sea Turtles.Evol Appl. 2024 Sep 15;17(9):e70013. doi: 10.1111/eva.70013. eCollection 2024 Sep. Evol Appl. 2024. PMID: 39286762 Free PMC article.
-
Effects of global warming on species with temperature-dependent sex determination: Bridging the gap between empirical research and management.Evol Appl. 2021 Apr 4;14(10):2361-2377. doi: 10.1111/eva.13226. eCollection 2021 Oct. Evol Appl. 2021. PMID: 34745331 Free PMC article. Review.
References
-
- Brunner FS, Deere JA, Egas M, Eizaguirre C, Raeymaekers JA. The diversity of eco-evolutionary dynamics: Comparing the feedbacks between ecology and evolution across scales. Funct. Ecol. 2019;33:7–12. doi: 10.1111/1365-2435.13268. - DOI
-
- Carotenuto F, et al. The influence of climate on species distribution over time and space during the late Quaternary. Quatern. Sci. Rev. 2016;149:188–199. doi: 10.1016/j.quascirev.2016.07.036. - DOI
-
- Loveless MD, Hamrick JL. Ecological determinants of genetic-structure in plant populations. Annu. Rev. Ecol. Syst. 1984;15:65–95. doi: 10.1146/annurev.es.15.110184.000433. - DOI
Publication types
MeSH terms
Substances
LinkOut - more resources
Full Text Sources
Research Materials
Miscellaneous

