. 2020 Oct 22;10(1):18045.
doi: 10.1038/s41598-020-73755-0.

High-throughput continuous-flow microfluidic electroporation of mRNA into primary human T cells for applications in cellular therapy manufacturing

Affiliations

High-throughput continuous-flow microfluidic electroporation of mRNA into primary human T cells for applications in cellular therapy manufacturing

Charles A Lissandrello et al. Sci Rep. .

Abstract

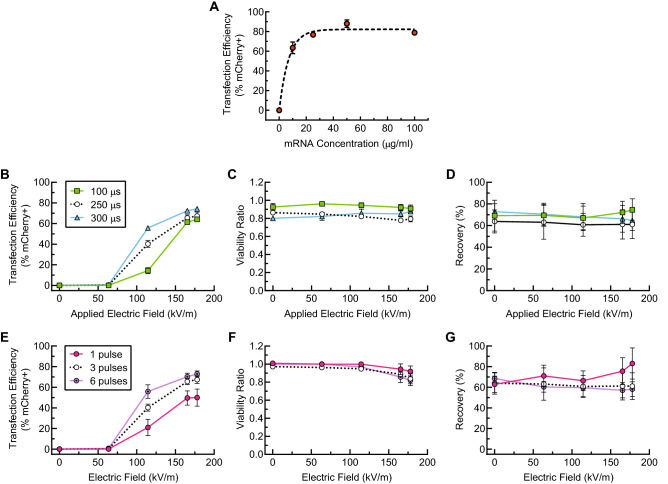
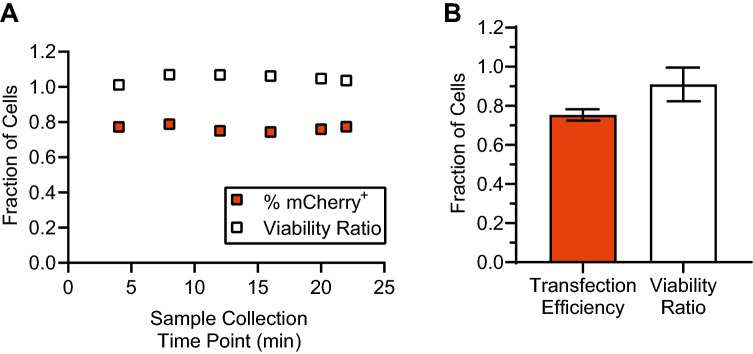
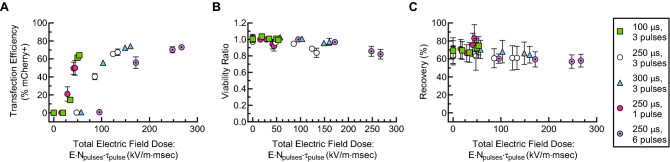
Implementation of gene editing technologies such as CRISPR/Cas9 in the manufacture of novel cell-based therapeutics has the potential to enable highly-targeted, stable, and persistent genome modifications without the use of viral vectors. Electroporation has emerged as a preferred method for delivering gene-editing machinery to target cells, but a major challenge remaining is that most commercial electroporation machines are built for research and process development rather than for large-scale, automated cellular therapy manufacturing. Here we present a microfluidic continuous-flow electrotransfection device designed for precise, consistent, and high-throughput genetic modification of target cells in cellular therapy manufacturing applications. We optimized our device for delivery of mRNA into primary human T cells and demonstrated up to 95% transfection efficiency with minimum impact on cell viability and expansion potential. We additionally demonstrated processing of samples comprising up to 500 million T cells at a rate of 20 million cells/min. We anticipate that our device will help to streamline the production of autologous therapies requiring on the order of 10[Formula: see text]-10[Formula: see text] cells, and that it is well-suited to scale for production of trillions of cells to support emerging allogeneic therapies.


Conflict of interest statement

CAL, JRC, JLB, and VT are listed as inventors on patent applications related to the technology presented. JAS, PH, MW, VLM, ESK, JC, NJH, AGS, AC, DKF, and DAF declare no competing interests.

Figures

Figure 1
Figure 1
Our microfluidic, continuous-flow electrotransfection device. (A) Scheme of our device. High-conductivity cell culture medium (RPMI in this study) is introduced into the sheath inlets, and low-conductivity electroporation medium (BTXpress in this study) with cells and transfection payload are introduced into the central cell inlet. As cells flow through the device, platinum electrodes in contact with the sheath streams are energized to deliver pulsed electric fields. (B) Photograph of our microfluidic electrotransfection device. (C) Scheme of the voltage waveform that is applied to the electrodes for transfection, with important parameters highlighted. In this study, monophasic square-wave pulse trains are applied with a peak voltage of Vo, a pulse duration of τpulse, and a pulse frequency or repetition rate of f.
Figure 2
Figure 2
Simulations of electric fields generated in our device as a function of applied voltage. (A) A combination of convective transport due to imposed flow and diffusive mixing contribute to the steady-state fluid conductivity distribution in our device. High-conductivity RPMI (σ = 14 mS/cm) is introduced into each side inlet at 550 μl/min, and low-conductivity BTXpress electroporation media with cells and mRNA (σ 0.5 mS/cm) is introduced into the center stream. The conductivity of the cell stream increases toward the device outlet due to infiltration of ions from the side streams by diffusion. The midplane in channel depth is shown. (B) Electric field magnitude distribution that results when 70 V is applied to the electrodes. Due to the conductivity distribution, the electric field magnitude is much higher in the cell stream. Mixing of the high and low-conductivity streams due to diffusion compresses and intensifies the high-field region near the outlet. (C) Spatially-averaged electric field magnitude in the cell stream as a function of applied voltage. (A) and (B) were generated using COMSOL Multiphysics software and (C) was generated using GraphPad Prism software.
Figure 3
Figure 3
Parametric study of transfection of resting primary human T cells from three independent, healthy donors (n = 3) with mCherry-encoding mRNA using our device. For all of these data, cells were suspended in BTXpress electroporation medium at a concentration of 2 million/ml. (A) Transfection efficiency in our device as a function of mRNA concentration. The applied Voltage, Vo, was 65 V (corresponding to an electric field magnitude of 165 kV/m); the pulse duration, τpulse, was 250 μs; the pulse frequency, f, was 10 Hz (approximately 3 pulses per cell residence time in the device). An exponential fit is shown to help guide the eye. (BD) show the transfection efficiency, viability ratio, and recovery, respectively, for a parameter sweep in which the pulse frequency, f, was held fixed at 10 Hz (approximately 3 pulses per cell residence time). The applied voltage, Vo, was varied from 0 to 70 V (Electric field magnitude ranging from 0 to 178 kV/m), and pulse durations of 100, 250, and 300 μs were tested. (EG) show transfection efficiency, viability ratio, and recovery, respectively, for a parameter sweep in which the pulse duration, τpulse, was held fixed at 250 μs. The applied voltage, Vo, was varied from 0 to 70 V, and pulse repetition rates of 3.3, 10, and 20 Hz corresponding to approximately 1, 3, and 6 pulses per cell residence time were tested. All data presented are an average of replicates from three independent, healthy donors and error bars represent standard error of the mean. Some error bars are too small to be visible. This figure was generated using GraphPad Prism software.
Figure 4
Figure 4
Electrical current and voltage measurements during application of pulsed electric fields enables verification of successful waveform delivery. (A) Representative data showing amplified voltage output delivered to the microfluidic device for pulses 250-μs in duration and 25, 45, 65, and 70 V in magnitude. For each voltage, a single pulse is shown. (B) Corresponding measured electrical currents for the pulses shown in (A). (C) The currents measured during the transfection experiments corresponding to the data shown in Fig. 3B–G are plotted against the applied voltage and compared to the COMSOL model prediction. For each donor replicate (n = 3) and each condition, the average peak current over 1 s was measured. The mean of the donor replicates is shown, and error bars represent standard error of the mean. This figure was generated using GraphPad Prism software.
Figure 5
Figure 5
Device throughput can be increased by running with a higher cell concentration. Transfection efficiency is presented for resting T-cell concentrations ranging from 2 to 50 million/ml, and mCherry-encoding mRNA concentrations of 20 μg/ml and 50 μg/ml. High transfection efficiency (70–85%) is maintained at cell concentrations up to 50 million/ml. At the highest cell concentration tested, the device processed approximately 20 million cells/min. The data for 50 million cells/ml was only run with the 50 μg/ml mRNA concentration. These data are an average of replicates from three independent, healthy donors (n = 3). The same three donors were used for experiments run at 2, 10, and 20 million cells/ml, and a new set of three donors was used for experiments run at 50 million cells/ml. Error bars represent standard error of the mean. This figure was generated using GraphPad Prism software.
Figure 6
Figure 6
Long-term effects of continuous-flow microfluidic electrotransfection on T-cell viability and expansion rate. T cells were transfected with mRNA on Day 0. (A) Viability of activated, expanding T cells over a period spanning 13 days normalized to the pre-transfection viability on Day 0. After a short-term drop in viability by 5–13% 24 h after transfection, viability remained stable and similar to that of control cells that were not transfected or introduced into our device. (B) Population doubling times for transfected cells were nearly indistinguishable from control cells. (C) Comparison of mCherry expression over time post transfection between activated T cells and resting T cells. (D) Comparison of the total number of mCherry-expressing cells over time post transfection between activated T cells and resting T cells. The total cell number is normalized to the total number of cells on day 1 (24 h after transfection). All data presented are an average of replicates from three independent, healthy donors (n = 3) and error bars represent standard error of the mean. Some error bars are too small to be visible. This figure was generated using GraphPad Prism software.
Figure 7
Figure 7
Our device is consistent and effective when used for transfection of clinically-relevant numbers of cells (approximately 200 million–500 million cells per donor). (A) Representative data from one primary human T-cell donor. All of the T cells from one buffy coat donor (approximately 500 million cells total) were activated, resuspended in BTXpress electroporation media at 50 million cells/ml, and then transfected with mCherry-encoding mRNA (50 μg/ml) continuously in a single microfluidic electroporation channel over a time span of approximately 20 min. Samples taken at approximately 4-min intervals show that transfection efficiency and viability (measured 24 h post-transfection) are consistent throughout processing. (B) T cells were isolated from buffy coat samples from three independent, healthy donors and activated. Each donor produced approximately 200 million–500 million T cells. The entirety of each donor sample was then transfected with mCherry mRNA. Average transfection efficiency and viability ratio across the three donors is shown (n = 3), where error bars represent standard error of the mean. This figure was generated using GraphPad Prism software.
Figure 8
Figure 8
Transfection efficiency (A), viability ratio (B), and recovery (C) as a function of total electric field dose (the product of the electric field magnitude, the number of pulses applied, and the duration of each pulse) for the combined data sets presented in Fig. 3. Primary human T cells were suspended at a concentration of 2 million/ml with 20 μg/ml mCherry-encoding mRNA. Data points represent an average of replicates from three independent, healthy donors (n = 3), and error bars represent standard error of the mean. Some error bars are too small to be visible. This figure was generated using GraphPad Prism software.

References

    1. Aijaz A, et al. Biomanufacturing for clinically advanced cell therapies. Nat. Biomed. Eng. 2018;2:362–376. doi: 10.1038/s41551-018-0246-6. - DOI - PMC - PubMed
    1. June CH, O’Connor RS, Kawalekar OU, Ghassemi S, Milone MC. CAR T cell immunotherapy for human cancer. Science. 2018;359:1361–1365. doi: 10.1126/science.aar6711. - DOI - PubMed
    1. Maude SL, et al. Tisagenlecleucel in children and young adults with B-cell lymphoblastic leukemia. N. Engl. J. Med. 2018;378:439–448. doi: 10.1056/NEJMoa1709866. - DOI - PMC - PubMed
    1. Kochenderfer JN, Rosenberg SA. Treating B-cell cancer with T cells expressing anti-CD19 chimeric antigen receptors. Nat. Rev. Clin. Oncol. 2013;10:267–276. doi: 10.1038/nrclinonc.2013.46. - DOI - PMC - PubMed
    1. KYMRIAH (tisagenlecleucel)|Childhood Acute Lymphoblastic Leukemia Treatment. https://www.us.kymriah.com/acute-lymphoblastic-leukemia-children/. Accessed 6 Dec 2018.

Publication types