. 2020 Oct 22;10(1):18044.
doi: 10.1038/s41598-020-74874-4.

Neuroepithelial cell competition triggers loss of cellular juvenescence

Affiliations

Neuroepithelial cell competition triggers loss of cellular juvenescence

Faidruz Azura Jam et al. Sci Rep. .

Abstract

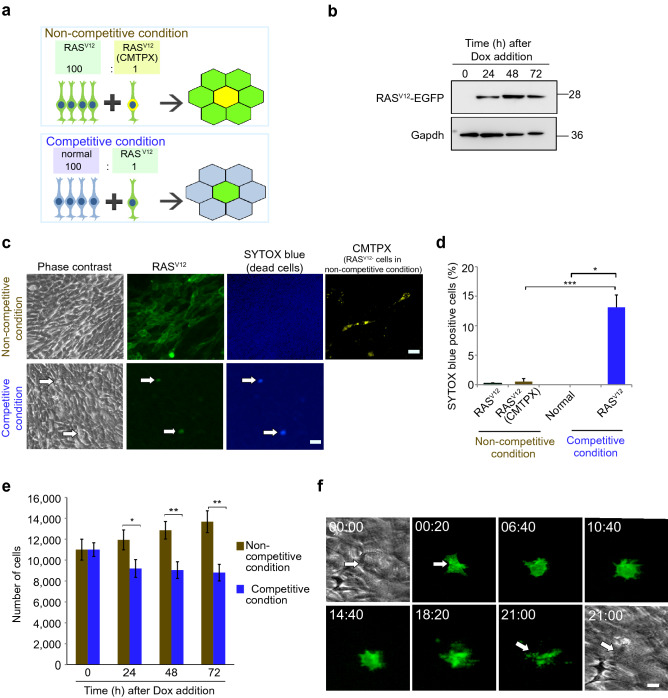
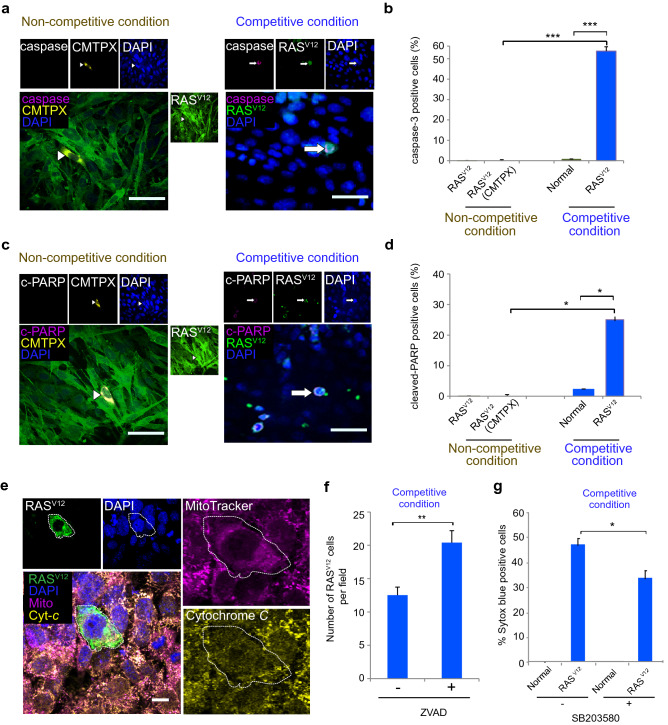
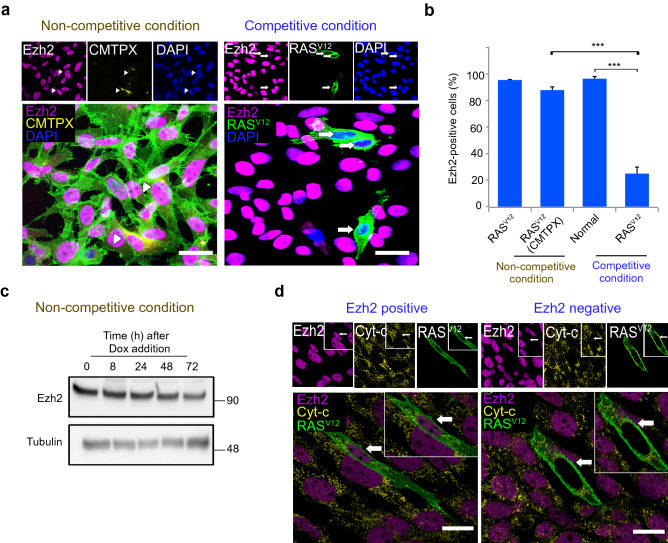
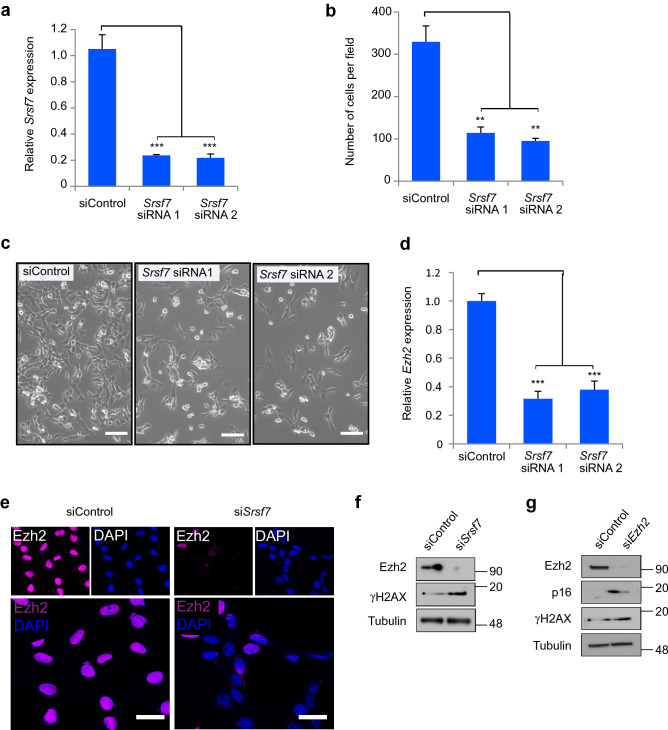
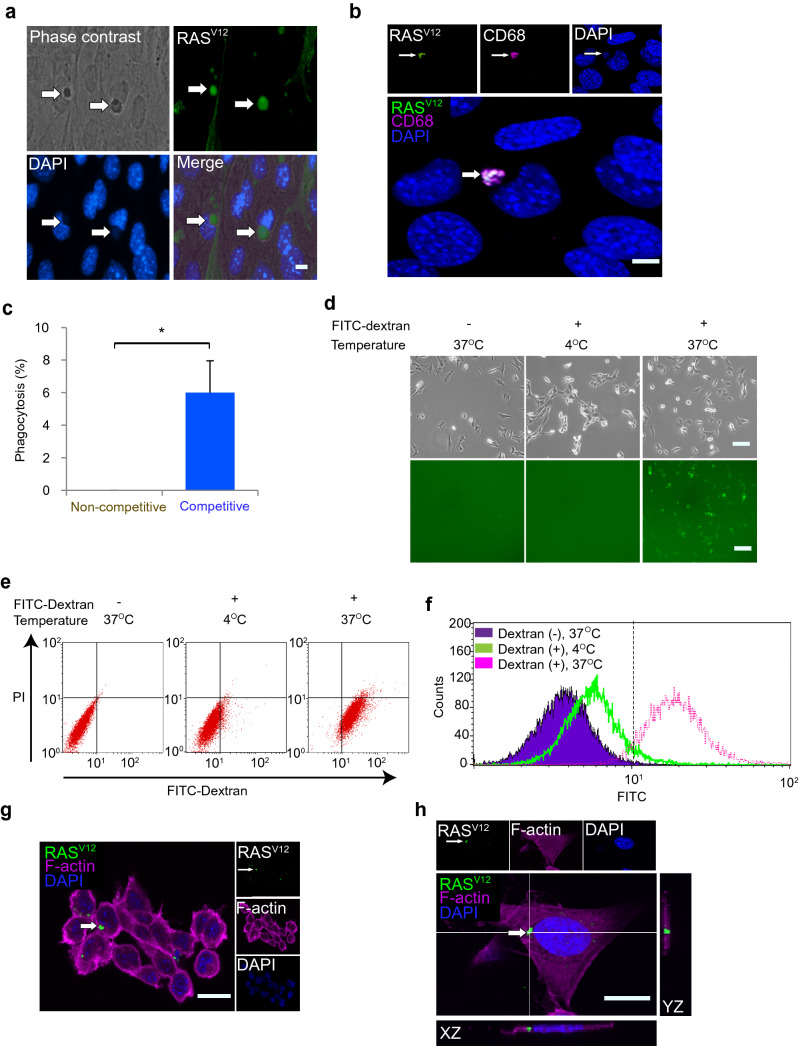
Cell competition is a cell-cell interaction mechanism which maintains tissue homeostasis through selective elimination of unfit cells. During early brain development, cells are eliminated through apoptosis. How cells are selected to undergo elimination remains unclear. Here we aimed to identify a role for cell competition in the elimination of suboptimal cells using an in vitro neuroepithelial model. Cell competition was observed when neural progenitor HypoE-N1 cells expressing RASV12 were surrounded by normal cells in the co-culture. The elimination through apoptosis was observed by cellular changes of RASV12 cells with rounding/fragmented morphology, by SYTOX blue-positivity, and by expression of apoptotic markers active caspase-3 and cleaved PARP. In this model, expression of juvenility-associated genes Srsf7 and Ezh2 were suppressed under cell-competitive conditions. Srsf7 depletion led to loss of cellular juvenescence characterized by suppression of Ezh2, cell growth impairment and enhancement of senescence-associated proteins. The cell bodies of eliminated cells were engulfed by the surrounding cells through phagocytosis. Our data indicates that neuroepithelial cell competition may have an important role for maintaining homeostasis in the neuroepithelium by eliminating suboptimal cells through loss of cellular juvenescence.


Conflict of interest statement

The authors declare no competing interests.

Figures

Figure 1
Figure 1
Establishment of the neuroepithelial cell competition model. (a) Experimental scheme for neuroepithelial cell competition. In non-competitive control condition, EGFP-expressing RASV12 cells were co-cultured with RASV12 labeled with CMTPX. In competitive condition, normal (wild type) cells were co-cultured with EGFP-RASV12. The ratio of co-cultured cells for both conditions were 100:1. (b) Western blot analysis showing RASV12 expression upon doxycycline induction. Gapdh was used as a loading control. (c) Representative images of SYTOX blue staining in non-competitive and competitive condition. Arrows indicate cells positive for SYTOX blue. Scale bars = 50 µm. (d) Frequency of SYTOX blue-positive cells in non-competitive and competitive condition. (e) Number of RASV12 (CMTPX) in non-competitive and RASV12 (EGFP) cells in competitive condition at 0, 24, 48 and 72 h. (f) Snapshot images of time-lapse movie showing elimination of RASV12 cell surrounded by normal cells through cell death induction. Scale bar = 20 µm. Data are shown as mean ± SEM from three independent experiments. (Student’s t-test *p < 0.05, **p < 0.01, ***p < 0.001).
Figure 2
Figure 2
Neuroepithelial cell competition occurs by non-cell autonomous induction of apoptosis. (a) Representative images of caspase-3 in RASV12 cells in non-competitive and competitive condition. Arrows indicate cells positive for caspase-3. Scale bars = 50 µm. (b) Frequency of caspase-3 positive cells in non-competitive and competitive condition. (c) Representative image of cleaved PARP in RASV12 cells in non-competitive and competitive condition. Arrows indicate positive for cleaved PARP. Scale bars = 50 µm. (d) Frequency of cleaved PARP positive cells in non-competitive and competitive condition. (e) Cytochrome-c and Mitotracker CMXROS staining in competitive condition showed cytochrome-c was diffusely stained in addition to co-localization with mitochondria in RASV12 cell surrounded by normal cells. Scale bar = 50 µm. (f) Number of RASV12 cells per field in competitive condition in the absence and presence of apoptosis inhibitor ZVAD. (g) Frequency of cell death indicated by SYTOX blue positivity in the competitive condition in the absence and presence of p38 inhibitor SB203580. Data are shown as mean ± SEM from three independent experiments (Student’s t-test *p < 0.05, **p < 0.01, ***p < 0.001).
Figure 3
Figure 3
Neuroepithelial cell competition triggers Srsf7 loss in RASV12 cells via proteasome-mediated degradation. (a) Representative images of Srsf7 expression in non-competitive and competitive condition. Arrows indicate Srsf7 loss in cells. Scale bars = 10 µm. (b) Frequency of Srsf7 positive cells in non-competitive and competitive condition. (c) Western blot analysis of Srsf7 expression in the non-competitive condition upon doxycycline induction. Gapdh was used as a loading control. (d) Ubiquitylation assay of Srsf7. Cells were transfected with HA-tagged ubiquitin and treated with MG132, 5 µM for 8 h before lysate collection. The ubiquitylation of Srsf7 was determined by IP-western. Note that samples were derived from the same experiment and blots were processed in parallel. Full length blots are presented in Supplementary Fig. S4. (e) Representative images of Srsf7 expression in the absence and presence of proteasome inhibitor MG132 during competitive condition. Arrows indicate Srsf7 positive cells. Scale bars = 20 µm. (f) Frequency of Srsf7 positive cells in the absence and presence of proteasome inhibitor MG132 during competitive condition. (g) Number of RASV12 cells counted after 24 h in the competitive condition of normal cells with control TdTomato RASV12 cells or HA-Srsf7 overexpressed RASV12 cells. (h) Frequency of caspase-3 positive in control TdTomato RASV12 cells or HA-Srsf7 overexpressed RASV12 cells during competitive condition. Data are shown as mean ± SEM from three independent experiments (Student’s t-test **p < 0.01, ***p < 0.001).
Figure 4
Figure 4
Loss of Srsf7 induces Ezh2 suppression in the loser cells. (a) Representative images of Ezh2 expression in non-competitive and competitive condition. Arrows indicate Ezh2 loss in cells. Scale bars = 20 µm. (b) Frequency of Ezh2 positive cells in non-competitive and competitive condition. (c) Western blot analysis of Ezh2 expression in the non-competitive condition upon doxycycline induction. Tubulin was used as a loading control. (d) Cytochrome-c staining showed punctate pattern in both RASV12 cells with Ezh2 positive and Ezh2 negative cell. Scale bars = 20 µm. Data are shown as mean ± SEM from three independent experiments (Student’s t-test ***p < 0.001).
Figure 5
Figure 5
Srsf7 suppression induces loss of cellular juvenescence. (a) qPCR analysis of Srsf7 knockdown efficiency in HypoE-N1 cells after 48 h transfection of control siRNA, Srsf7 siRNA1 or siRNA2. (b) Number of cells per field 72 h after transfection with control siRNA or Srsf7 siRNA1 and siRNA2. (c) Appearance of HypoE-N1 cells after transfection with control siRNA or Srsf7 siRNA 1 and siRNA 2. Scale bars = 50 µm. (d) qPCR analysis of Ezh2 mRNA expression 72 h after transfection with control siRNA, Srsf7 siRNA1 or siRNA2. (e) Immunofluorescent staining of Ezh2 in HypoE-N1 cells 48 h after transfection with control siRNA or Srsf7 siRNA. Scale bars = 20 µm. (f) Western blot analysis with HypoE-N1 cells 72 h after transfection with control siRNA or Srsf7 siRNA. Tubulin was used a loading control. (g) Western blot analysis with HypoE-N1 cells 72 h after transfection with control siRNA or Ezh2 siRNA. Tubulin was used a loading control. Data are shown as mean ± SEM from three independent experiments (Student’s t-test **p < 0.01, ***p < 0.001).
Figure 6
Figure 6
Neuroepithelial cell competition removes loser cell corpora via phagocytosis. (a) Representative image of RASV12 cell corpora phagocytized by surrounding normal HypoE-N1 cell. Arrows indicate RASV12 cells corpora. Scale bar = 10 µm. (b) Representative image of co-localization RASV12 cell corpora with CD68 (phagosome marker), depicted by arrows. Scale bar = 5 µm. (c) Percentage of phagocytosis at 48 h, counted from co-localization of CD68 and RASV12 cell corpora. (d) FITC-dextran uptake assay. HypoE-N1 cells were plated one day before and then exposed to 1 mg/ml FITC-dextran for 2.5 h at 37 °C and 4 °C (as negative control). Scale bars = 50 µm. (e) Flow cytometric analysis of FITC-dextran uptake in HypoE-N1 cells. HypoE-N1 cells incubated with FITC-dextran at 37 °C showed significant shift to the right quadrant. (f) The right-most open pink histogram represent HypoE-N1 cells incubated with FITC dextran at 37 °C , green histogram indicates HypoE-N1 cells incubated with FITC dextran at 4 °C and the filled purple histogram represent HypoE-N1 cells only at 37 °C. (g) Representative image for phagocytosis of apoptotic cell by HypoE-N1 cells during phagocytosis assay after 5 h co-incubation of UV-induced apoptosis RASV12 cells with HypoE-N1 cells at 10:1 ratio. Scale bar = 20 µm. (h) Confocal z-stack image (orthogonal projection) for internalization of UV-induced apoptosis RASV12 cells in HypoE-N1 cells. Scale bar = 5 µm. Data are shown as mean ± SEM from two independent experiments (Student’s t-test *p < 0.05).

References

    1. Sancho M, et al. Competitive interactions eliminate unfit embryonic stem cells at the onset of differentiation. Dev. Cell. 2013;26:19–30. doi: 10.1016/j.devcel.2013.06.012. - DOI - PMC - PubMed
    1. Clavería C, Giovinazzo G, Sierra R, Torres M. Myc-driven endogenous cell competition in the early mammalian embryo. Nature. 2013;500:39–44. doi: 10.1038/nature12389. - DOI - PubMed
    1. Sasaki A, et al. Obesity suppresses cell-competition-mediated apical elimination of RasV12-transformed cells from epithelial tissues. Cell Rep. 2018;23:974–982. doi: 10.1016/j.celrep.2018.03.104. - DOI - PMC - PubMed
    1. Ellis SJ, et al. Distinct modes of cell competition shape mammalian tissue morphogenesis. Nature. 2019;3:497–502. doi: 10.1038/s41586-019-1199-y. - DOI - PMC - PubMed
    1. Villa Del Campo C, et al. Myc overexpression enhances of epicardial contribution to the developing heart and promotes extensive expansion of the cardiomyocyte population. Sci. Rep. 2016;6:1–12. doi: 10.1038/s41598-016-0001-8. - DOI - PMC - PubMed

Publication types