. 2020 Oct 22;10(1):18020.
doi: 10.1038/s41598-020-74798-z.

Epigenetic alterations in skin homing CD4+CLA+ T cells of atopic dermatitis patients

Affiliations

Epigenetic alterations in skin homing CD4+CLA+ T cells of atopic dermatitis patients

Nathalie Acevedo et al. Sci Rep. .

Abstract

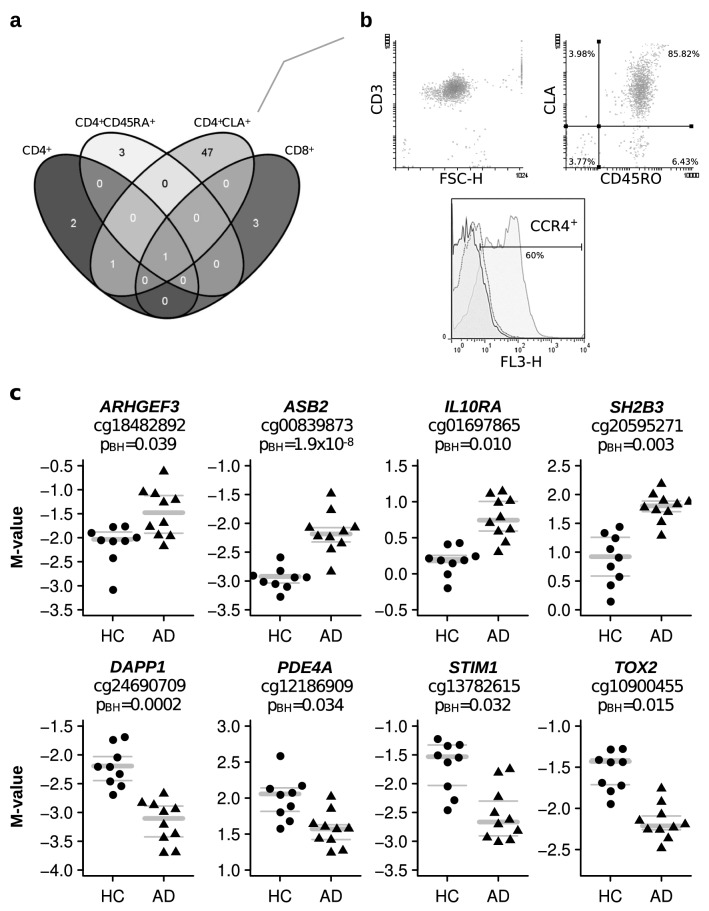
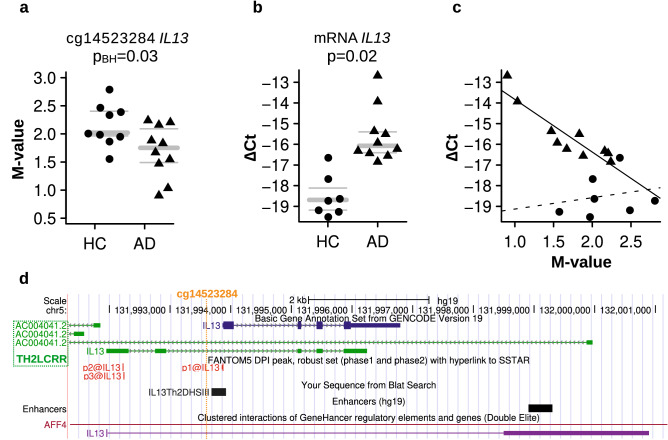
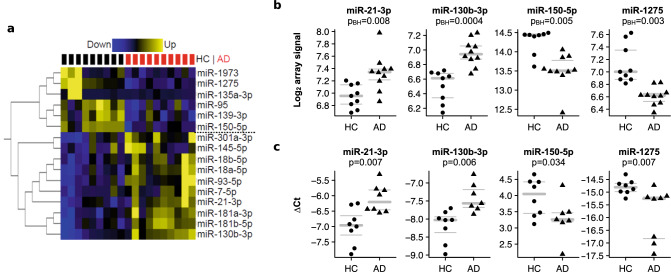
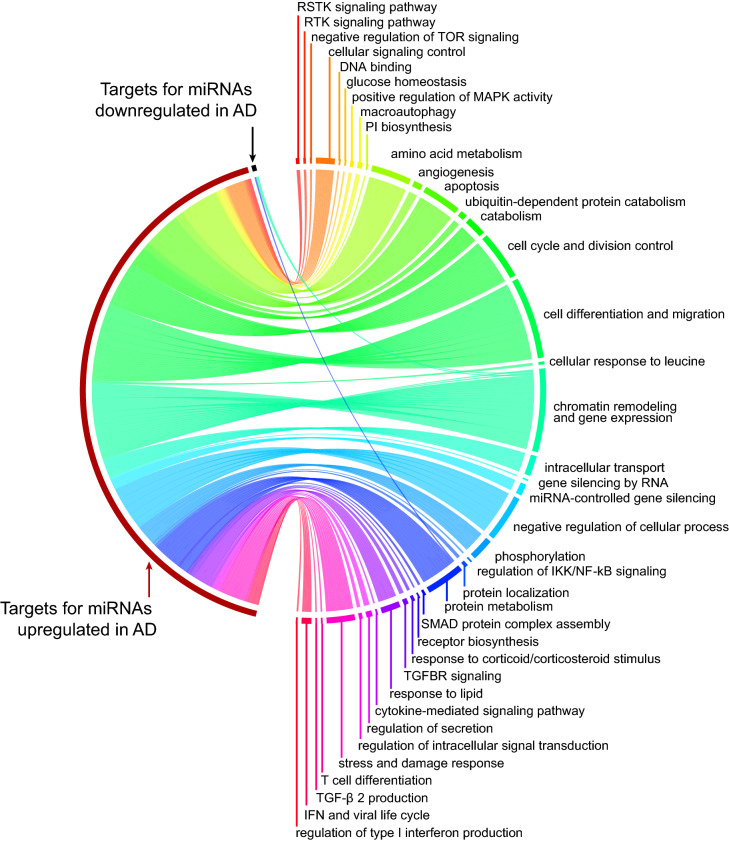
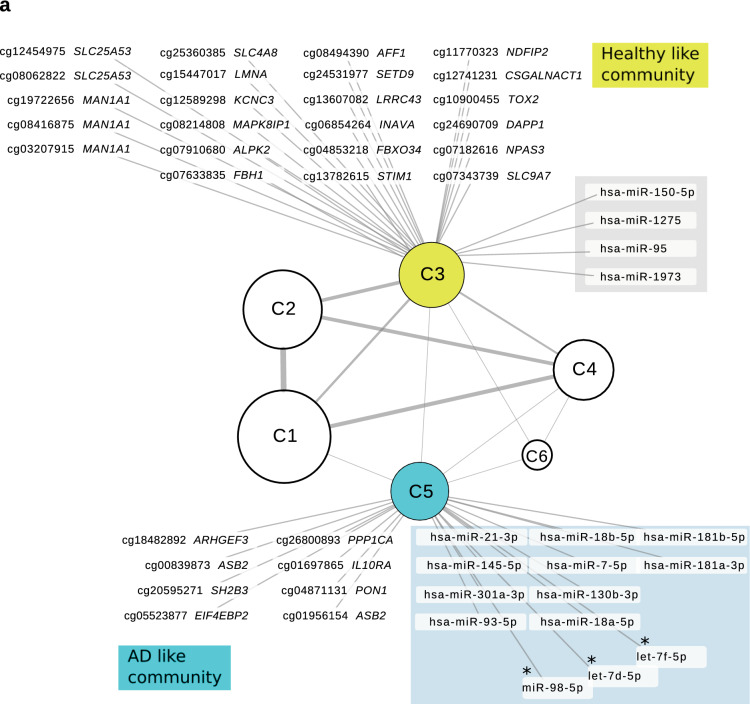
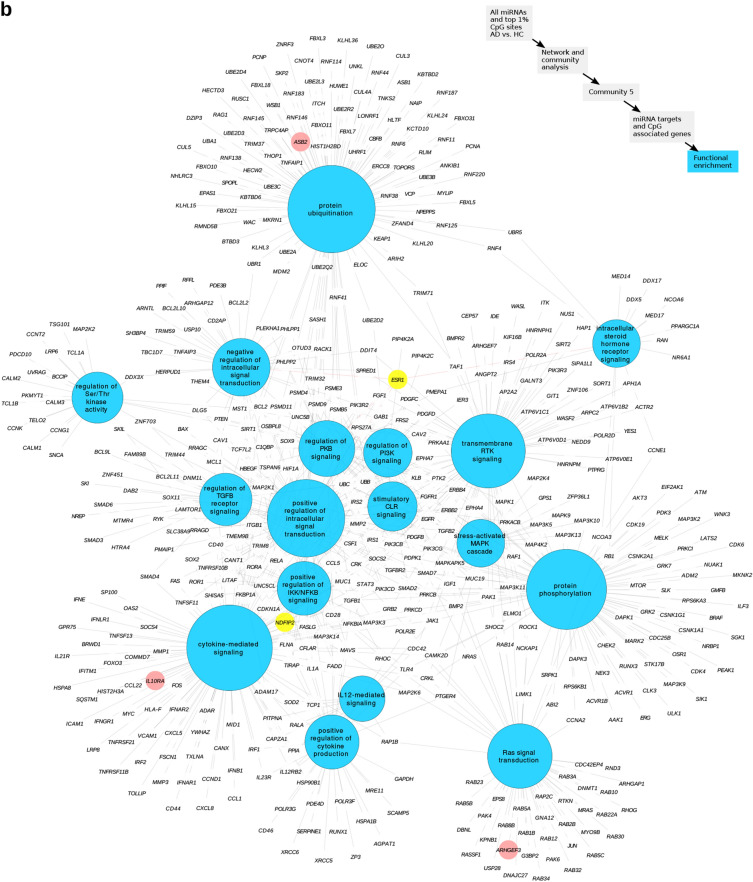
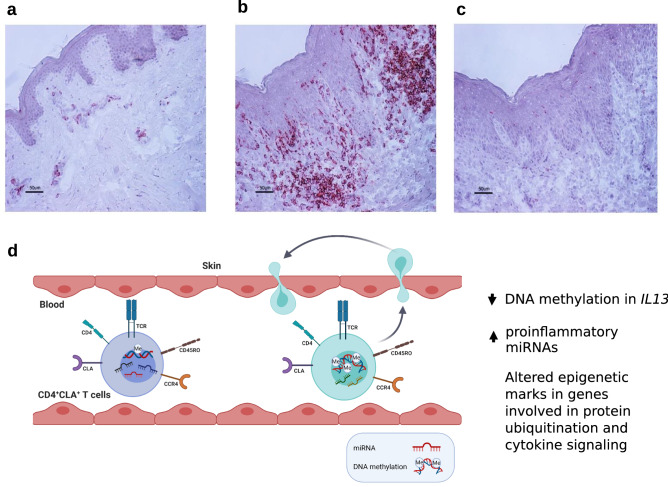
T cells expressing the cutaneous lymphocyte antigen (CLA) mediate pathogenic inflammation in atopic dermatitis (AD). The molecular alterations contributing to their dysregulation remain unclear. With the aim to elucidate putative altered pathways in AD we profiled DNA methylation levels and miRNA expression in sorted T cell populations (CD4+, CD4+CD45RA+ naïve, CD4+CLA+, and CD8+) from adult AD patients and healthy controls (HC). Skin homing CD4+CLA+ T cells from AD patients showed significant differences in DNA methylation in 40 genes compared to HC (p < 0.05). Reduced DNA methylation levels in the upstream region of the interleukin-13 gene (IL13) in CD4+CLA+ T cells from AD patients correlated with increased IL13 mRNA expression in these cells. Sixteen miRNAs showed differential expression in CD4+CLA+ T cells from AD patients targeting genes in 202 biological processes (p < 0.05). An integrated network analysis of miRNAs and CpG sites identified two communities of strongly interconnected regulatory elements with strong antagonistic behaviours that recapitulated the differences between AD patients and HC. Functional analysis of the genes linked to these communities revealed their association with key cytokine signaling pathways, MAP kinase signaling and protein ubiquitination. Our findings support that epigenetic mechanisms play a role in the pathogenesis of AD by affecting inflammatory signaling molecules in skin homing CD4+CLA+ T cells and uncover putative molecules participating in AD pathways.


Conflict of interest statement

A. Scheynius is a member in the Joint Steering Committee for the Human Translational Microbiome Program at Karolinska Institutet together with Ferring Pharmaceuticals, Switzerland. The rest of the authors declare that they have no relevant conflicts of interest.

Figures

Figure 1
Figure 1
Differentially methylated probes (DMPs) in peripheral blood T cells between AD patients and HC. (a) Venn diagram showing the overlap of DMPs in four different sorted T cell populations. Plotted with the open webtool venny 2.0 (https://bioinfogp.cnb.csic.es/tools/venny/). (b) Representative flow cytometry analysis of CD3, CLA, CD45RO and CCR4 in sorted CD4+CLA+ T cells. Numbers within quadrants represent percentage of cells. FSC-H: forward scatter height; in histogram solid black line: unstained; dotted line: isotype control; gray line: anti CCR4 staining. (c) Eight DMPs in CD4+CLA+ T cells. DNA methylation levels are expressed as M-values, gray bars indicate mean (bold), upper and lower (thin) quartiles. M values above 1 represent that the CpG site is methylated, and M values below − 1 represent that the CpG site is demethylated. Each dot represents an individual, HC (n = 9) and AD patients (n = 10). PBH = Benjamini Hochberg p value.
Figure 2
Figure 2
Differential DNA methylation and mRNA levels in the IL13 gene in CD4+CLA+ T cells between AD patients and HC. (a) DNA methylation levels for the DMP located at the IL13 promoter (cg14523284). Each dot represents an individual, HC (n = 9, circle) and AD patients (n = 10, triangle). PBH = Benjamini Hochberg p value. (b) IL13 mRNA levels in CD4+CLA+ T cells between HC (n = 7) and AD patients (n = 10) by qRT-PCR. Gray bars in the panels a and b indicate mean (bold), upper and lower (thin) quartiles. (c) Correlation between IL13 mRNA levels and IL13 DNA methylation levels. Lines of best fit are individually presented for AD (solid line, m < −2.5, p < 0.0005, R2 > 0.82) and HC (dashed line, m = 0.5, p = 0.65, R2 < 0.05). (d) Location of the CpG site cg14523284 at the promoter of IL13 within the T helper type 2 locus control region associated RNA at Chr 5q31.1 (https://genome.ucsc.edu).
Figure 3
Figure 3
Differentially expressed miRNAs in CD4+CLA+ T cells between AD patients and HC. (a) Differential miRNA expression by miRNA microarray between HC (n = 9) and AD patients (n = 10). Fold expression of 16 miRNAs with significant differences between AD patients and HC (Benjamini Hochberg corrected p value < 0.05). Blue indicates downregulation and yellow indicates upregulation. Each row corresponds to a miRNA and each column to 1 sample. Black and red squares on the top indicate HC and AD samples, respectively. Six down-regulated and 10 up-regulated and miRNAs in AD patients are indicated to the right of the heatmap. Software used Glucore Omics Explorer (https://www.qlucore.com/). (b) Log2 miRNA levels from the microarray analysis between HC and AD patients. The array level indicates the amount of miRNA based on the fluorescence signal in the Cy3 channel. PBH = Benjamini Hochberg p value. (c) ∆-Ct miRNA levels confirmed with qPCR between HC and AD patients. Gray bars in the panels B and C indicate mean (bold), upper and lower quartiles; each dot represents an individual.
Figure 4
Figure 4
Functional enrichment analysis on the targets of AD perturbed miRNAs (FDR < 0.05). On the right hand key biological processes are summarized by their similarity. The lines are proportional to the number of biological processes associated with targets of miRNAs that are upregulated (red) or downregulated (black) in AD patients. The complete list of 202 processes is presented in Supplementary Table S2 online. This circular layout was created with the free R package circlize (https://cran.r-project.org/web/packages/circlize/index.html).
Figure 5
Figure 5
Integrated network analysis of miRNAs and CpG sites (CpGs) highlights coordinated epigenetic changes in CD4+CLA+ T cells. (a) Based on the set of associated miRNAs and CpG sites (absolute Spearman ρ > 0.75, FDR < 0.001) we identified 6 communities (C1–C6) of highly interconnected miRNAs/CpGs. These shows coordinated expression patterns, with strong interconnections within but not between communities. Note that communities 3 (yellow) and 5 (blue) show many of the differential miRNAs/CpGs detected in HC and AD patients: CpG sites (black), miRNAs (shadow), and miRNAs targeting IL13 (with asterisk). The node size for each community is proportional to the number of elements in each community. Line thickness connecting the communities is proportional to the number of connections between them. Detailed information on these communities is presented in Supplementary Table S3 online. (b) Functional enrichment analysis on putative regulated targets revealed 17 key pathways associated with AD (community C5) and are indicated as blue circles. Genes highlighted in pink and yellow were also detected as differentially methylated in the comparison between AD patients and HC (Table 2). The networks were created in Cytoscape 3.7.2 (https://cytoscape.org/).
Figure 5
Figure 5
Integrated network analysis of miRNAs and CpG sites (CpGs) highlights coordinated epigenetic changes in CD4+CLA+ T cells. (a) Based on the set of associated miRNAs and CpG sites (absolute Spearman ρ > 0.75, FDR < 0.001) we identified 6 communities (C1–C6) of highly interconnected miRNAs/CpGs. These shows coordinated expression patterns, with strong interconnections within but not between communities. Note that communities 3 (yellow) and 5 (blue) show many of the differential miRNAs/CpGs detected in HC and AD patients: CpG sites (black), miRNAs (shadow), and miRNAs targeting IL13 (with asterisk). The node size for each community is proportional to the number of elements in each community. Line thickness connecting the communities is proportional to the number of connections between them. Detailed information on these communities is presented in Supplementary Table S3 online. (b) Functional enrichment analysis on putative regulated targets revealed 17 key pathways associated with AD (community C5) and are indicated as blue circles. Genes highlighted in pink and yellow were also detected as differentially methylated in the comparison between AD patients and HC (Table 2). The networks were created in Cytoscape 3.7.2 (https://cytoscape.org/).
Figure 6
Figure 6
Identification of CLA+ cells in skin biopsies and epigenetic changes detected in circulating CD4+CLA+ T cells from AD patients that might contribute to skin inflammation. A representative immunohistochemistry staining of the distribution of CLA+ cells in skin biopsies from (a) a healthy control, (b) lesional skin from an AD patient, and (c), rat IgM used as isotype control. Scale bars represent 50 µm. (d) Circulating CD4+CLA+ T cells from AD patients (light blue cell) show significant differences in DNA methylation and miRNA levels compared to CD4+CLA+ T cells from HC (purple cell). The main differences were detected in the reduced DNA methylation of the IL13 gene, the increased expression of proinflammatory miRNAs and coordinated epigenetic changes in genes involved in protein ubiquitination and cytokine signaling in AD patients. Since these CD4+CLA+ T cells can recirculate between skin and blood, these altered epigenetic marks might contribute to AD immunopathology.

References

    1. Weidinger S, Beck LA, Bieber T, Kabashima K, Irvine AD. Atopic dermatitis. Nat. Rev. Dis. Primers. 2018;4:1. doi: 10.1038/s41572-018-0001-z. - DOI - PubMed
    1. Liang Y, et al. Demethylation of the FCER1G promoter leads to FcepsilonRI overexpression on monocytes of patients with atopic dermatitis. Allergy. 2012;67:424–430. doi: 10.1111/j.1398-9995.2011.02760.x. - DOI - PubMed
    1. Liang Y, et al. Thymic stromal lymphopoietin epigenetically upregulates Fc receptor gamma subunit-related receptors on antigen-presenting cells and induces TH2/TH17 polarization through dectin-2. J. Allergy Clin. Immunol. 2019;144:1025–1035. doi: 10.1016/j.jaci.2019.06.011. - DOI - PubMed
    1. Cho HJ, et al. Prenatal 25-hydroxyvitamin D deficiency affects development of atopic dermatitis via DNA methylation. J. Allergy Clin. Immunol. 2019;143:1215–1218. doi: 10.1016/j.jaci.2018.10.010. - DOI - PubMed
    1. Kumar D, et al. A functional SNP associated with atopic dermatitis controls cell type-specific methylation of the VSTM1 gene locus. Genome Med. 2017;9:18. doi: 10.1186/s13073-017-0404-6. - DOI - PMC - PubMed

Publication types

MeSH terms