. 2021 Jun;28(6):649-666.
doi: 10.1038/s41417-020-00246-9. Epub 2020 Oct 22.

B-cell clonogenic activity of HIV-1 p17 variants is driven by PAR1-mediated EGF transactivation

Affiliations

B-cell clonogenic activity of HIV-1 p17 variants is driven by PAR1-mediated EGF transactivation

Cinzia Giagulli et al. Cancer Gene Ther. 2021 Jun.

Abstract

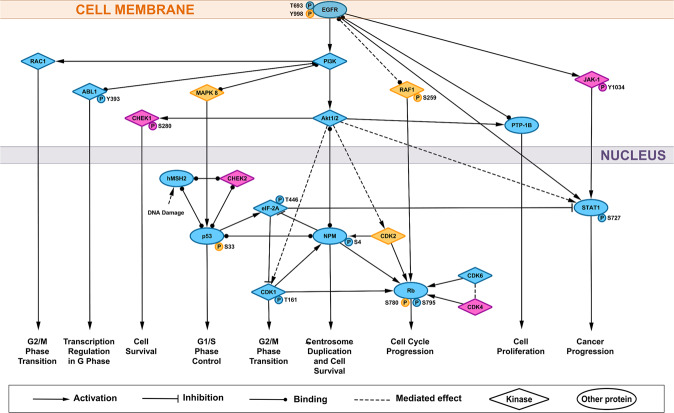
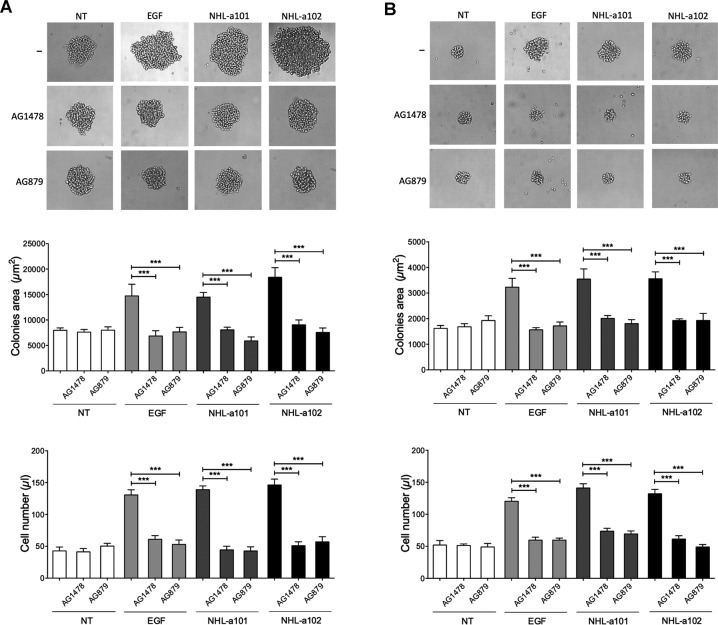
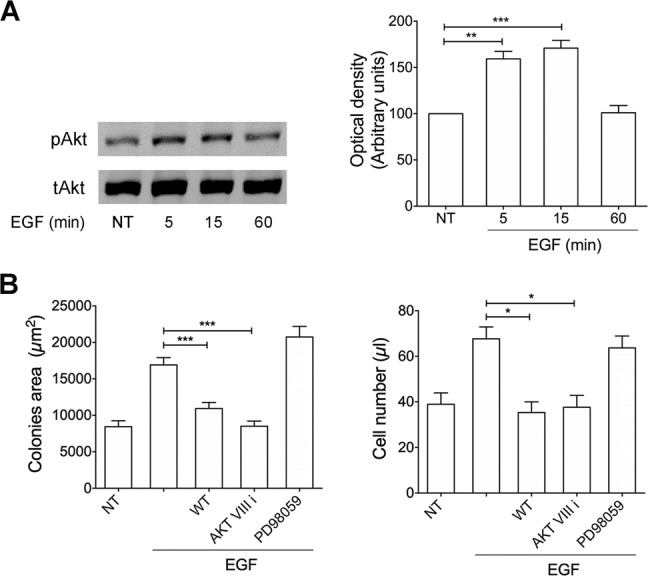
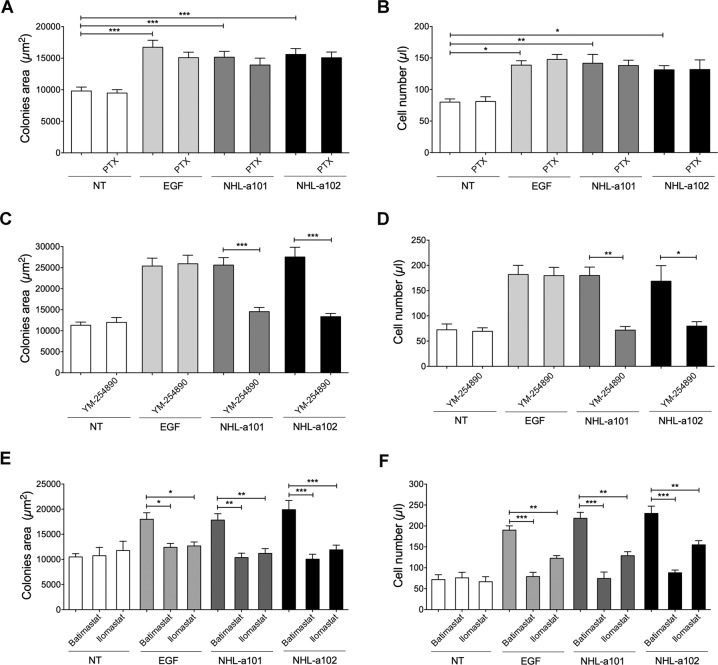
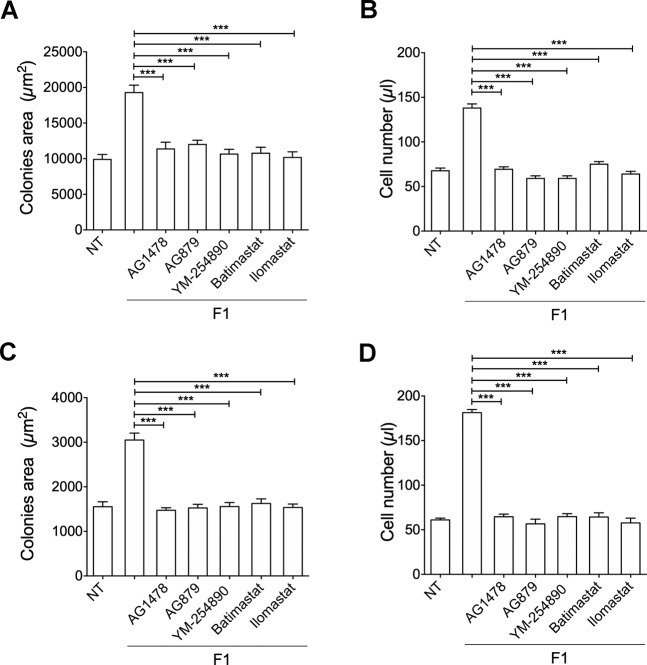
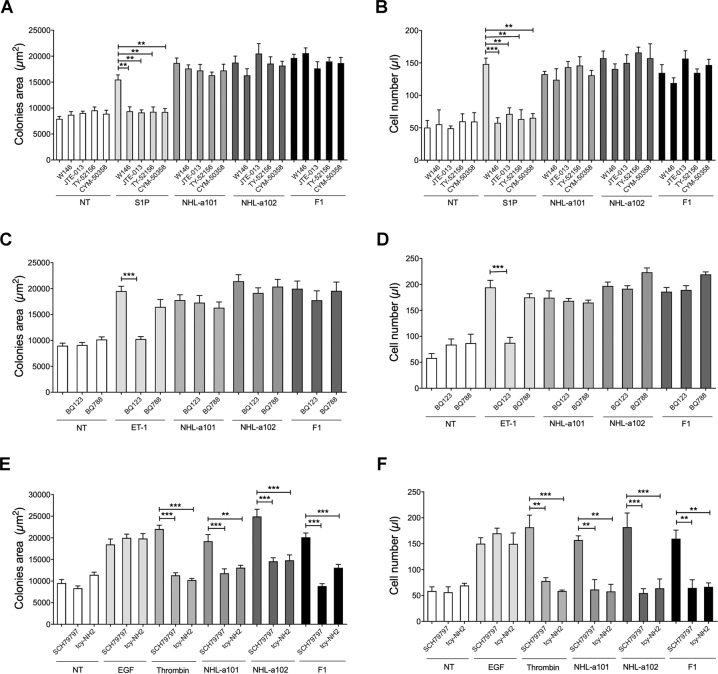
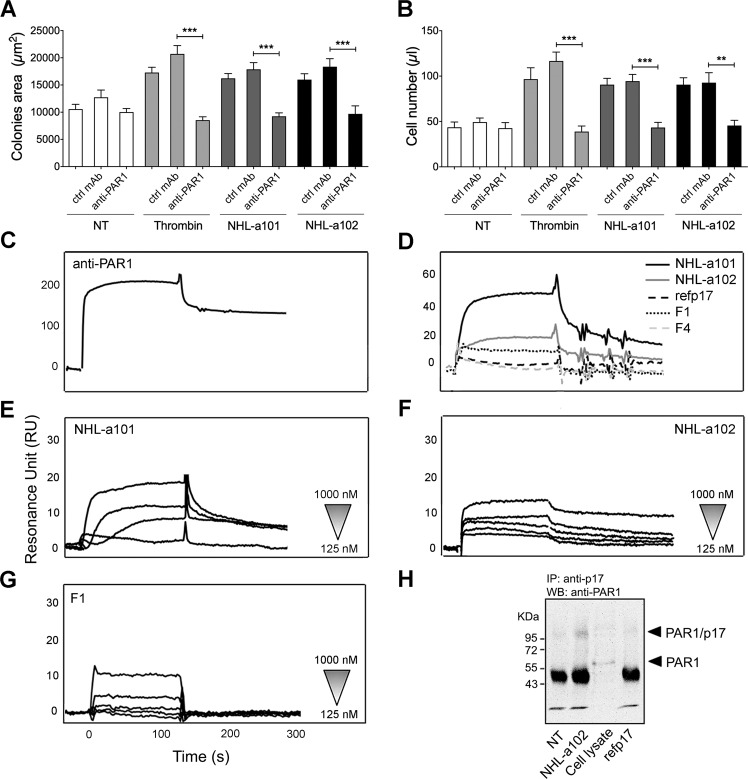
Combined antiretroviral therapy (cART) for HIV-1 dramatically slows disease progression among HIV+ individuals. Currently, lymphoma represents the main cause of death among HIV-1-infected patients. Detection of p17 variants (vp17s) endowed with B-cell clonogenic activity in HIV-1-seropositive patients with lymphoma suggests their possible role in lymphomagenesis. Here, we demonstrate that the clonogenic activity of vp17s is mediated by their binding to PAR1 and to PAR1-mediated EGFR transactivation through Gq protein. The entire vp17s-triggered clonogenic process is MMPs dependent. Moreover, phosphoproteomic and bioinformatic analysis highlighted the crucial role of EGFR/PI3K/Akt pathway in modulating several molecules promoting cancer progression, including RAC1, ABL1, p53, CDK1, NPM, Rb, PTP-1B, and STAT1. Finally, we show that a peptide (F1) corresponding to the vp17s functional epitope is sufficient to trigger the PAR1/EGFR/PI3K/Akt pathway and bind PAR1. Our findings suggest novel potential therapeutic targets to counteract vp17-driven lymphomagenesis in HIV+ patients.


Conflict of interest statement

The authors declare that they have no conflict of interest.

Figures

Fig. 1
Fig. 1. Representation of the signaling pathways involved in B-cell clonogenicity induced by clonogenic vp17s.
Stimulation of B cells with NHL-a101 and NHL-a102 vp17s induces the activation of several signaling molecules involved in promoting cell survival, cell proliferation, cell cycle progression, G1/S and G2/M phase transition. STRING database and literature data mining were used to identify known and experimentally verified interactions. The several kinases involved in the pathway are represented by diamonds, the other proteins by ellipses. The proteins represented in cyan are the ones activated by both NHL-a101 and NHL-a102. The molecules activated by NHL-a101 are in magenta, the ones stimulated by NHL-a102 in yellow. PI3K: phosphatidylinositol-3-kinase; Akt: protein kinase B; CDK1: cyclin-dependent kinase 1; ABL1: tyrosine-protein kinase ABL1; CDK2: cyclin-dependent kinase 2; CDK4: cyclin-dependent kinase 4; CDK6: cyclin-dependent kinase 6; CHEK1: serine/threonine-protein kinase Chk1; CHEK2: serine/threonine-protein kinase Chk2; EGFR: epidermal growth factor receptor; eIF-2A: interferon-induced, double-stranded RNA-activated protein kinase; hMSH2: DNA mismatch repair protein Msh2; JAK-1: tyrosine-protein kinase JAK1; MAPK 8: mitogen-activated protein kinase 8; NPM: nucleophosmin; p53: cellular tumor antigen p53; PTP-1B: tyrosine-protein phosphatase non-receptor type 1; RAC1: ras-related C3 botulinum toxin substrate 1; RAF1: tyrosine-protein kinase JAK1; Rb: Retinoblastoma-associated protein; STAT1: signal transducer and activator of transcription 1-alpha/beta.
Fig. 2
Fig. 2. EGFR activation by vp17s in Raji B cells.
Cellular extracts of Raji B cells treated for 5 min at 37 °C with or without EGF, NHL-a101 and NHL-a102 were evaluated for phosphorylation of EGFR family members by a human phosphorylation array. The intensities of the phospho-protein signals were quantified by densitometric analysis and normalized to either positive controls or not treated cells as suggested by the manufacturer’s instructions. Values reported for protein phosphorylation levels are representative of one representative experiment of 3 with similar results. NT, not treated.
Fig. 3
Fig. 3. Effect of EGFR and ErbB2 inhibitors on clonogenic activity of vp17s in B-cells.
A, B Raji (A) and Bjab (B) cells were cultured for 8 days and 12 days, respectively, in the presence or absence of EGF (100 ng/ml) or NHL-a101 or NHL-a102 (10 ng/ml) and EGFR inhibitor AG1478 (250 nM) or ErbB2 inhibitor AG879 (2 μM). Bright-field images represent the characteristic morphology of 2D colonies of Raji and Bjab (upper panels), one colony for each condition is shown (original magnification, ×40). The colony area was measured (15 colonies/condition) by using Leica Qwin image analysis software (central panel). The same number of colonies (15 colonies/condition) was aseptically harvested from 96-well plates and stained with propidium iodide (PI) to detect PI-viable cells by flow cytometry (lower panel). Absolute cell counts were obtained by the counting function of the MACSQuant® Analyzer. Bars represent the means ± SD of three independent experiments. The statistical significance between control and treated cultures was calculated using one-way ANOVA and the Bonferroni’s post-test was used to compare data. NT, not treated. ***P < 0.001.
Fig. 4
Fig. 4. EGFR triggering is linked to PI3K/Akt signaling pathway activation.
A Raji cells were stimulated with 100 ng/ml of EGF at 37 °C for the indicated times. Not treated cells (NT) were used as control (lane 1). Western blot analysis of Raji lysates shows that EGF ligand activates Akt, as shown by the respective phosphorylation state, verified by densitometric analysis and plotting of the phospho-Akt/total Akt (pAkt/tAkt). In the left panel blots from one representative experiment of 3 with similar results are shown. In the right panel, values reported for Akt phosphorylation are the mean ± SD of three independent experiments. Statistical analysis was performed by one-way ANOVA and the Bonferroni’s post-test was used to compare data. B Raji cells were cultured for 8 days in the presence or absence of EGF (100 ng/ml) and PI3K inhibitor WT (100 nM) or Akt inhibitor VIII (1 μM) or MEK/ERK1/2 inhibitor PD98059 (10 μM) The colony area was measured (15 colonies/condition) by using Leica Qwin image analysis software (left panel). The same number of colonies (15 colonies/condition) was aseptically harvested from 96-well plates and stained with propidium iodide (PI) to detect PI-viable cells by flow cytometry. Absolute cell counts were obtained by the counting function of the MACSQuant® Analyzer (right panel). Bars represent the means ± SD of three independent experiments. The statistical significance between control and treated cultures was calculated using one-way ANOVA and the Bonferroni’s post-test was used to compare data. *P < 0.05; **P < 0.01; ***P < 0.001.
Fig. 5
Fig. 5. Effect of Gi, Gq and MMPs inhibitors on vp17s-induced B-cell clonogenic activity.
A, C, E Raji cells were cultured for 8 days in the presence or absence of EGF (100 ng/ml) or NHL-a101 or NHL-a102 (10 ng/ml) and pertussis toxin (PTX; 10 ng/ml) (A) or YM-254890 (100 nM) (C) or Batimastat and Ilomastat (E). The colony area of Raji was measured (15 colonies/condition) by using Leica Qwin image analysis software. B, D, F The same number of colonies (15 colonies/condition) was aseptically harvested from 96-well plates and stained with propidium iodide (PI) to detect PI-viable cells by flow cytometry. Absolute cell counts were obtained by the counting function of the MACSQuant® Analyzer. Bars represent the means ± SD of three independent experiments. The statistical significance between control and treated cultures was calculated using one-way ANOVA and the Bonferroni’s post-test was used to compare data. NT , not treated. *P < 0.05; **P < 0.01; ***P < 0.001.
Fig. 6
Fig. 6. Effect of EGFR, ErbB2, Gq, and MMPs inhibitors on F1-induced B-cell clonogenicity.
A, C Raji (A) and Bjab (C) cells form colonies when sorted into 96-well plates as single cell. Plates were cultured for 8 and 12 days, respectively, in the presence or absence of F1 peptide (10 ng/ml) and EGFR inhibitor AG1478 (250 nM) or ErbB2 inhibitor AG879 (2 μM) or YM-254890 (100 nM), which blocks Gq-mediated signaling. The colony area of Raji (A) and Bjab (C) was measured (15 colonies/condition) by using Leica Qwin image analysis software (left panel). B, D The same number of colonies (15 colonies/condition) was aseptically harvested from 96-well plates and stained with propidium iodide (PI) to detect PI-viable cells by flow cytometry. Absolute cell counts were obtained by the counting function of the MACSQuant® Analyzer. Bars represent the means ± SD of three independent experiments. The statistical significance between control and treated cultures was calculated using one-way ANOVA and the Bonferroni’s post-test was used to compare data. NT, not treated. ***P < 0.001.
Fig. 7
Fig. 7. Effect of specific inhibitors for S1PRs, ETRs, and PARs on vp17s-induced B-cell clonogenicity.
A, C, E Raji cells were cultured for 8 days in the presence or absence of NHL-a101 or NHL-a102 (10 ng/ml) or A agonist S1P (100 nM) and selective antagonists W146 (100 nM), JTE-013 (10 nM), TY-52156 (100 nM), CYM-50358 (1 nM) for S1PR1, S1PR2, S1PR3, S1PR4, respectively, or C agonist ET-1 (100 nM) and ETA and ETB receptor antagonist BQ123 or BQ788 (0.65 μg/ml), respectively, or E EGF (used as negative control), thrombin (2 U/ml) and selective antagonist SCH79797 (10 nM) for PAR1 and tcy-NH2 (10 μM) for PAR4. The colony area of Raji was measured (15 colonies/condition) by using Leica Qwin image analysis software. B, D, F The same number of colonies (15 colonies/condition) was aseptically harvested from 96-well plates and stained with Propidium Iodide (PI) to detect PI-viable cells by flow cytometry. Absolute cell counts were obtained by the counting function of the MACSQuant® Analyzer. Bars represent the means ± SD of three independent experiments. The statistical significance between control and treated cultures was calculated using one-way ANOVA and the Bonferroni’s post-test was used to compare data. NT, not treated. **P < 0.01; ***P < 0.001.
Fig. 8
Fig. 8. The vp17s-induced B-cell clonogenic activity is mediated by their interaction with PAR1.
A Raji cells were cultured for 8 days in the presence or absence of NHL-a101 or NHL-a102 (10 ng/ml) or thrombin (2 U/ml) and neutralizing mAb ATAP2 to PAR1 (anti-PAR1) or isotype control mAb (Ctrl mAb; 1 μg/ml). The colony area of Raji was measured (15 colonies/condition) by using Leica Qwin image analysis software. B The same number of colonies (15 colonies/condition) was aseptically harvested from 96-well plates and stained with propidium iodide (PI) to detect PI-viable cells by flow cytometry. Absolute cell counts were obtained by the counting function of the MACSQuant® Analyzer. Bars represent the means ± SD of three independent experiments. The statistical significance between control and treated cultures was calculated using one-way ANOVA and the Bonferroni’s post-test was used to compare data. NT, not treated. **P < 0.01; ***P < 0.001. CG SPR analysis of the interaction of vp17s and F1 peptide with PAR1. C Blank subtracted sensorgram showing the binding of anti-PAR1 mAb (ATAP2). D Representative blank subtracted sensorgrams of refp17, NHL-a101, NHL-a102, F1, and F4 binding. E, F, G Overlay of blank subtracted sensorgrams, resulting from the injection of increasing concentration (from 125 to 1000 nM) of NHL-a101 (E), NHL-a102 (F) and F1 (G), used to determinate the kinetic parameter of interaction. RU, resonance unit. H Co-immunoprecipitation of p17/PAR1 complexes. Raji cells were incubate or not for 15 min at room temperature with 1.5 μg of vp17 NHL-a102 or refp17. After chemical cross-linking, PAR1 was immunoprecipitated from the lysates with an anti-p17 antibody (MBS-34). The immunoprecipitates were detected by western blotting using a mAb to PAR1 (ATAP2). One representative experiment of three with similar results is shown. NT, not treated.

References

    1. Rubinstein PG, Aboulafia DM, Zloza A. Malignancies in HIV/AIDS: from epidemiology to therapeutic challenges. AIDS. 2014;28:453–65. - PMC - PubMed
    1. Rabkin C. Epidemiology of AIDS‐related malignancies. Curr Opin Oncol. 1994;6:492–6. - PubMed
    1. He B, Qiao X, Klasse PJ, Chiu A, Chadburn A, Knowles DM, et al. HIV-1 envelope triggers polyclonal Ig class switch recombination through a CD40-independent mechanism involving BAFF and C-type lectin receptors. J Immunol. 2006;176:3931–41. - PubMed
    1. Kundu RK, Sangiorgi F, Wu LY, Pattengale PK, Hinton DR, Gill PS, et al. Expression of the human immunodeficiency virus-Tat gene in lymphoid tissues of transgenic mice is associated with B-cell lymphoma. Blood. 1999;94:275–82. - PubMed
    1. Popovic M, Tenner-Racz K, Pelser C, Stellbrink H-J, van Lunzen J, Lewis G, et al. Persistence of HIV-1 structural proteins and glycoproteins in lymph nodes of patients under highly active antiretroviral therapy. Proc Natl Acad Sci USA. 2005;102:14807–12. - PMC - PubMed

Publication types

MeSH terms

Substances