

Long non-coding RNA expression profiles and related regulatory networks in areca nut chewing-induced tongue squamous cell carcinoma
- PMID: 33093911
- PMCID: PMC7573881
- DOI: 10.3892/ol.2020.12165
Long non-coding RNA expression profiles and related regulatory networks in areca nut chewing-induced tongue squamous cell carcinoma
Abstract
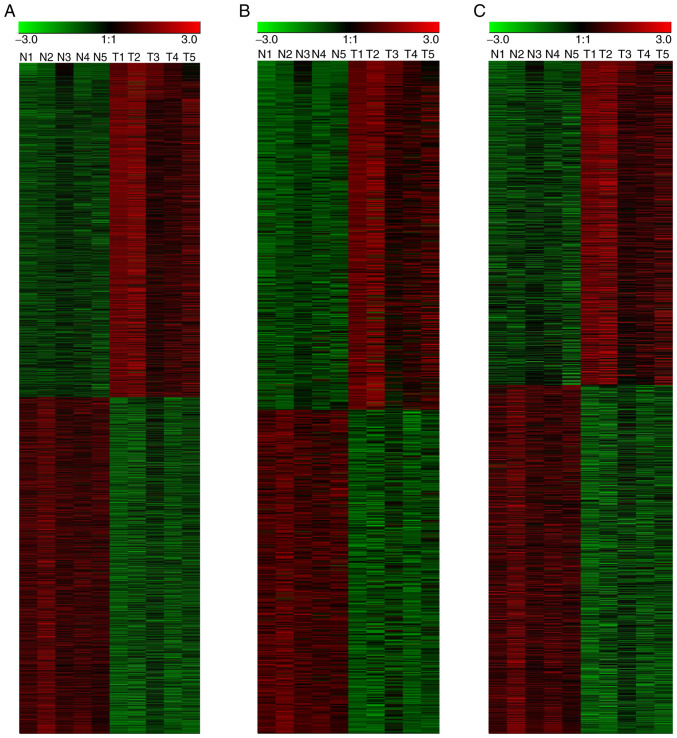
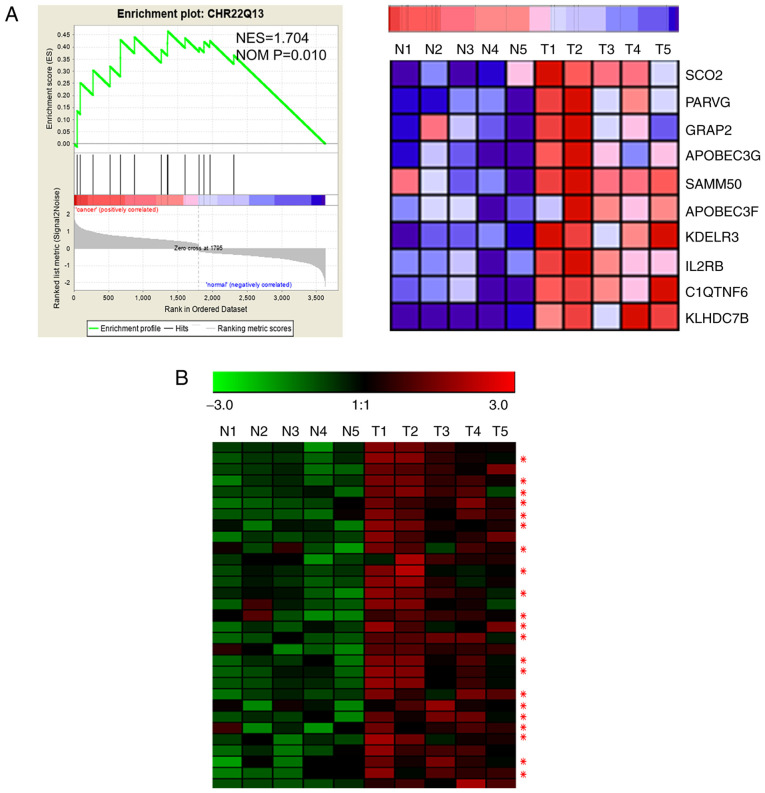
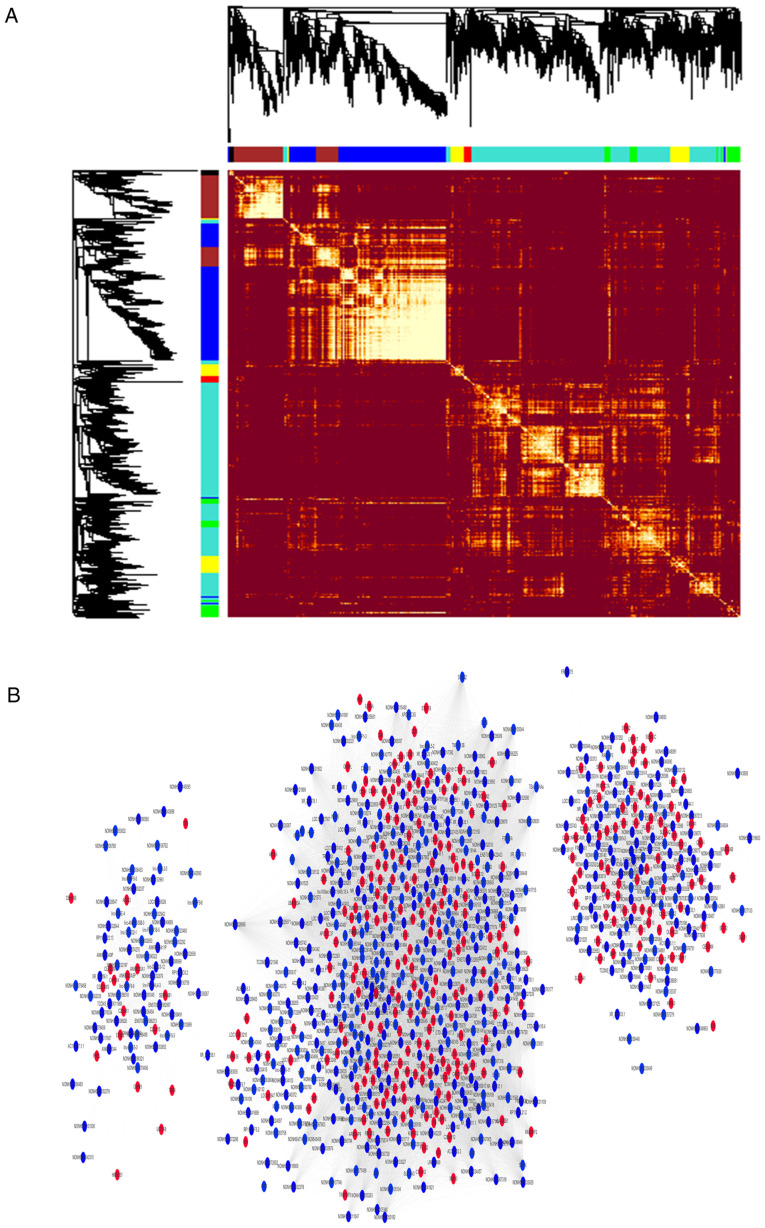
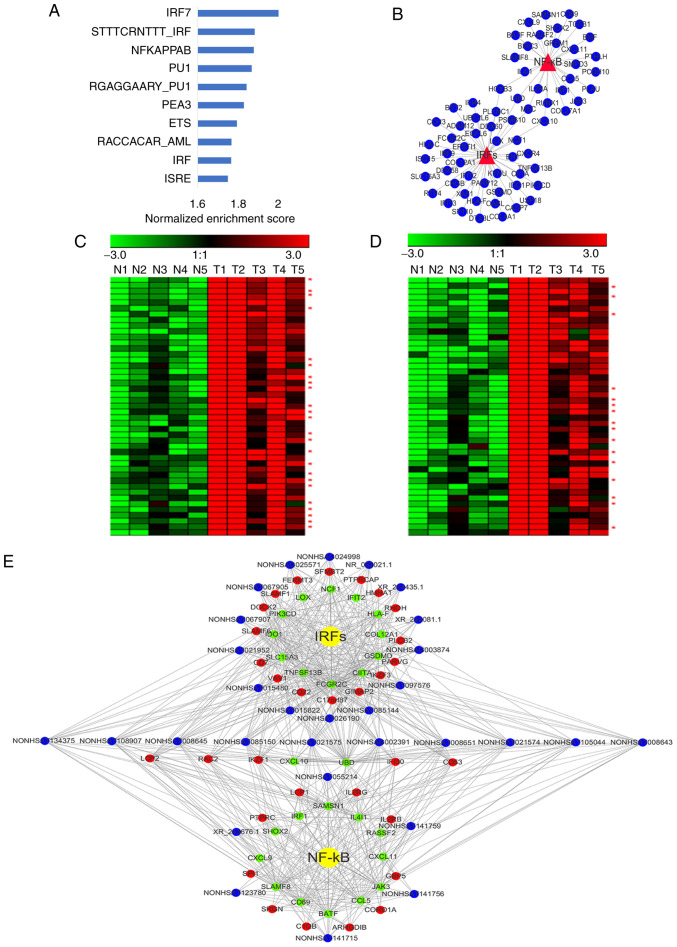
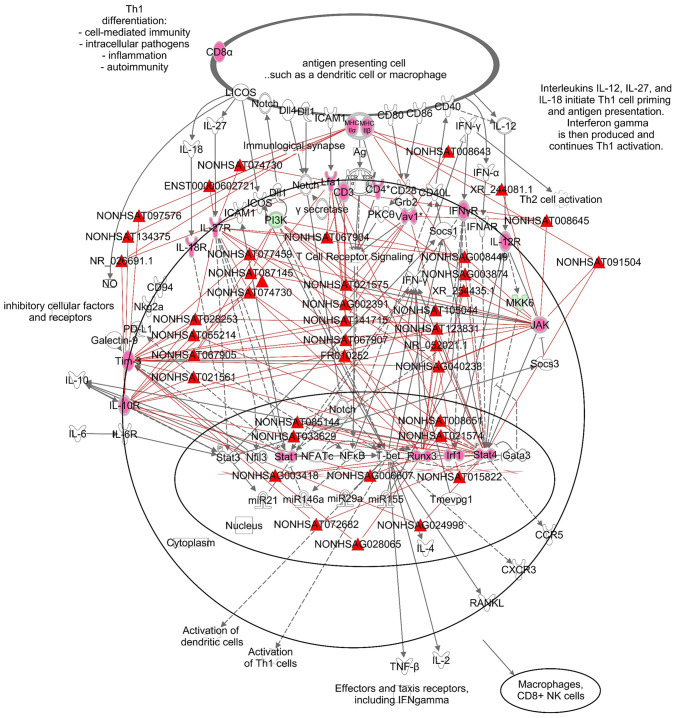
Areca nut chewing is an important risk factor for developing tongue squamous cell carcinoma (TSCC), although the underlying molecular mechanism is unknown. To determine the potential molecular mechanisms of areca nut chewing-induced TSCC, the present study performed whole-genome detection with five pairs of TSCC and adjacent normal tissues, via mRNA- and long non-coding (lnc)RNA-gene chip analysis. A total of 3,860 differentially expressed genes were identified, including 2,193 lncRNAs and 1,667 mRNAs. Gene set-enrichment analysis revealed that the differentially expressed mRNAs were enriched in chromosome 22q13, 8p21 and 3p21 regions, and were regulated by nuclear factor kappa B (NF-κB) and interferon regulatory factors (IRFs). The results of ingenuity pathway analysis revealed that these mRNAs were significantly enriched for inflammatory immune-related signaling pathways. A co-expression network of mRNAs and lncRNAs was constructed by performing weighted gene co-expression network analysis. The present study focused on NF-κB-, IRF- and Th cell-signaling pathway-related lncRNAs and the corresponding mRNA-lncRNA regulatory networks. To the best of our knowledge, the present study was the first to investigate differential mRNA- and lncRNA-expression profiles in TSCCs induced by areca nut chewing. Inflammation-related mRNA-lncRNA regulatory networks driven by IRFs and NF-κB were identified, as well as the Th cell-related signaling pathways that play important carcinogenic roles in areca nut chewing-induced TSCC. These differentially expressed mRNAs and lncRNAs, and their regulatory networks provide insight for further analysis on the molecular mechanism of areca nut chewing-induced TSCC, candidate molecular markers and targets for further clinical intervention.
Keywords: areca nut; expression profile; long non-coding RNA; network; tongue squamous cell carcinoma.
Copyright © 2020, Spandidos Publications.
Figures
Similar articles
-
Molecular Signature of Long Non-Coding RNA Associated with Areca Nut-Induced Head and Neck Cancer.Cells. 2023 Mar 11;12(6):873. doi: 10.3390/cells12060873. Cells. 2023. PMID: 36980216 Free PMC article.
-
Analysis of Differentially Expressed Long Non-coding RNAs and the Associated TF-mRNA Network in Tongue Squamous Cell Carcinoma.Front Oncol. 2020 Aug 14;10:1421. doi: 10.3389/fonc.2020.01421. eCollection 2020. Front Oncol. 2020. PMID: 32923393 Free PMC article.
-
Areca nut chewing and esophageal squamous-cell carcinoma risk in Asians: a meta-analysis of case-control studies.Cancer Causes Control. 2013 Feb;24(2):257-65. doi: 10.1007/s10552-012-0113-9. Epub 2012 Dec 8. Cancer Causes Control. 2013. PMID: 23224324 Review.
-
Integrated Analysis of Long Noncoding RNA and mRNA Expression Profile in Advanced Laryngeal Squamous Cell Carcinoma.PLoS One. 2016 Dec 29;11(12):e0169232. doi: 10.1371/journal.pone.0169232. eCollection 2016. PLoS One. 2016. PMID: 28033431 Free PMC article.
-
The oral health consequences of chewing areca nut.Addict Biol. 2002 Jan;7(1):115-25. doi: 10.1080/13556210120091482. Addict Biol. 2002. PMID: 11900631 Review.
Cited by
-
circSETD3 regulates MAPRE1 through miR-615-5p and miR-1538 sponges to promote migration and invasion in nasopharyngeal carcinoma.Oncogene. 2021 Jan;40(2):307-321. doi: 10.1038/s41388-020-01531-5. Epub 2020 Oct 29. Oncogene. 2021. PMID: 33122825
-
Long non-coding RNAs are involved in alternative splicing and promote cancer progression.Br J Cancer. 2022 May;126(8):1113-1124. doi: 10.1038/s41416-021-01600-w. Epub 2021 Nov 8. Br J Cancer. 2022. PMID: 34750493 Free PMC article. Review.
-
The role of alternative splicing in human cancer progression.Am J Cancer Res. 2021 Oct 15;11(10):4642-4667. eCollection 2021. Am J Cancer Res. 2021. PMID: 34765285 Free PMC article. Review.
-
Molecular Signature of Long Non-Coding RNA Associated with Areca Nut-Induced Head and Neck Cancer.Cells. 2023 Mar 11;12(6):873. doi: 10.3390/cells12060873. Cells. 2023. PMID: 36980216 Free PMC article.
-
Inhibition of miR-497 Attenuates Oral Submucous Fibrosis by Inhibiting Myofibroblast Transdifferentiation in Buccal Mucosal Fibroblasts.Oral Health Prev Dent. 2022 Aug 3;20:339-348. doi: 10.3290/j.ohpd.b3276183. Oral Health Prev Dent. 2022. PMID: 35920886 Free PMC article.
References
LinkOut - more resources
Full Text Sources
Molecular Biology Databases