

Metabolic traits in brown trout (Salmo trutta) vary in response to food restriction and intrinsic factors
- PMID: 33093959
- PMCID: PMC7566963
- DOI: 10.1093/conphys/coaa096
Metabolic traits in brown trout (Salmo trutta) vary in response to food restriction and intrinsic factors
Abstract
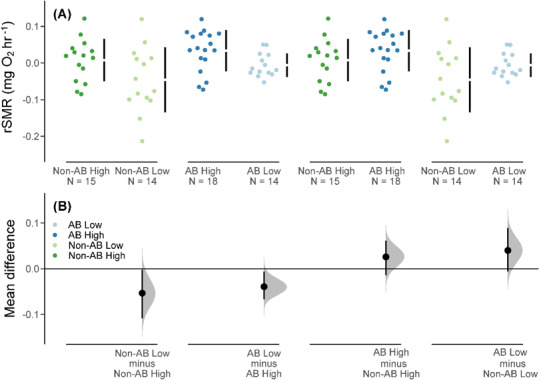
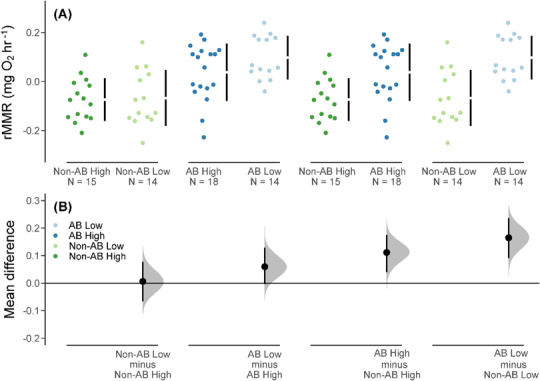
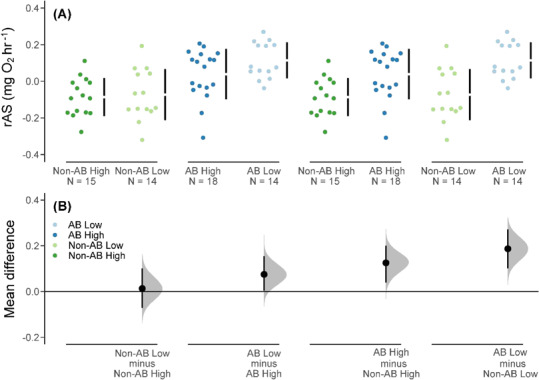
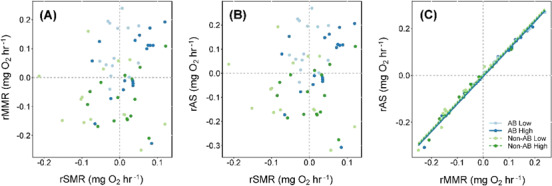
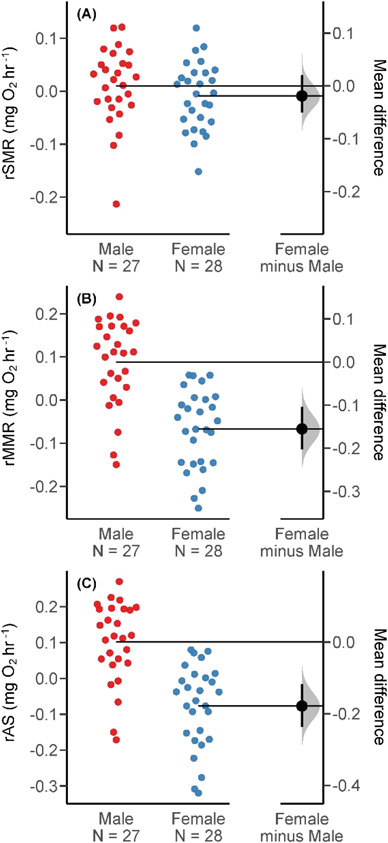
Metabolic rates vary hugely within and between populations, yet we know relatively little about factors causing intraspecific variation. Since metabolic rate determines the energetic cost of life, uncovering these sources of variation is important to understand and forecast responses to environmental change. Moreover, few studies have examined factors causing intraspecific variation in metabolic flexibility. We explore how extrinsic environmental conditions and intrinsic factors contribute to variation in metabolic traits in brown trout, an iconic and polymorphic species that is threatened across much of its native range. We measured metabolic traits in offspring from two wild populations that naturally show life-history variation in migratory tactics (one anadromous, i.e. sea-migratory, one non-anadromous) that we reared under either optimal food or experimental conditions of long-term food restriction (lasting between 7 and 17 months). Both populations showed decreased standard metabolic rates (SMR-baseline energy requirements) under low food conditions. The anadromous population had higher maximum metabolic rate (MMR) than the non-anadromous population, and marginally higher SMR. The MMR difference was greater than SMR and consequently aerobic scope (AS) was higher in the anadromous population. MMR and AS were both higher in males than females. The anadromous population also had higher AS under low food compared to optimal food conditions, consistent with population-specific effects of food restriction on AS. Our results suggest different components of metabolic rate can vary in their response to environmental conditions, and according to intrinsic (population-background/sex) effects. Populations might further differ in their flexibility of metabolic traits, potentially due to intrinsic factors related to life history (e.g. migratory tactics). More comparisons of populations/individuals with divergent life histories will help to reveal this. Overall, our study suggests that incorporating an understanding of metabolic trait variation and flexibility and linking this to life history and demography will improve our ability to conserve populations experiencing global change.
Keywords: anadromy; climate change; metabolism; partial migration; phenotypic flexibility; plasticity.
© The Author(s) 2020. Published by Oxford University Press and the Society for Experimental Biology.
Figures
References
-
- Allan EL, Froneman PW, Hodgson AN (2006) Effects of temperature and salinity on the standard metabolic rate (SMR) of the caridean shrimp Palaemon peringueyi. J Exp Mar Biol Ecol 337: 103–108.
-
- Almodóvar A, Nicola GG, Ayllón D, Elvira B (2012) Global warming threatens the persistence of Mediterranean brown trout. Glob Chang Biol 18: 1549–1560.
-
- Álvarez D, Cano JM, Nicieza AG (2006) Microgeographic variation in metabolic rate and energy storage of brown trout: countergradient selection or thermal sensitivity? Evol Ecol 20: 345–363.
-
- Angilletta MJ., Jr (2001) Variation in metabolic rate between populations of a geographically widespread lizard. Physiol Biochem Zool 74: 11–21. - PubMed
-
- Archer LC, Hutton SA, Harman L, McCormick SD, O’Grady MN, Kerry JP, Poole WR, Gargan P, McGinnity P, and Reed TE (2020) Food and temperature stressors have opposing effects in determining flexible migration decisions in brown trout (Salmo trutta). Glob Chang Biol 26: 2878–96. - PubMed
LinkOut - more resources
Full Text Sources
Research Materials
