

Public Health and Climate Benefits and Trade-Offs of U.S. Vehicle Electrification
- PMID: 33094205
- PMCID: PMC7567144
- DOI: 10.1029/2020GH000275
Public Health and Climate Benefits and Trade-Offs of U.S. Vehicle Electrification
Abstract
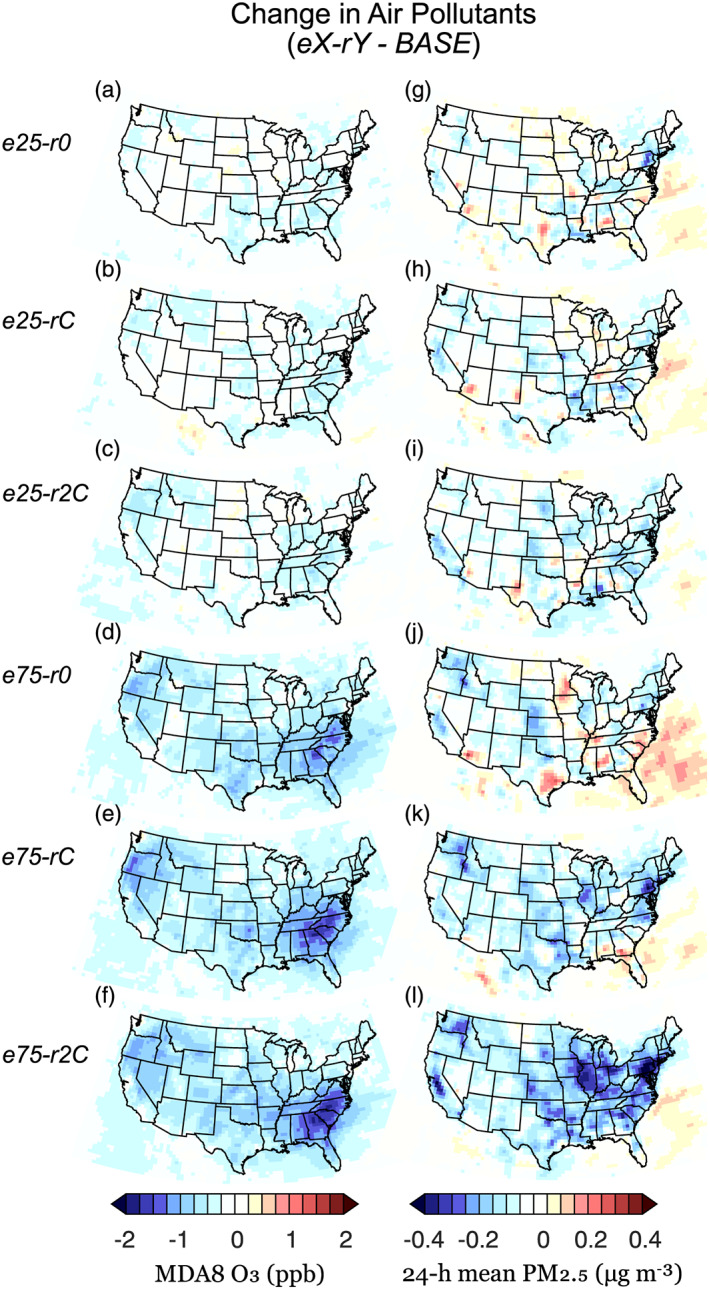
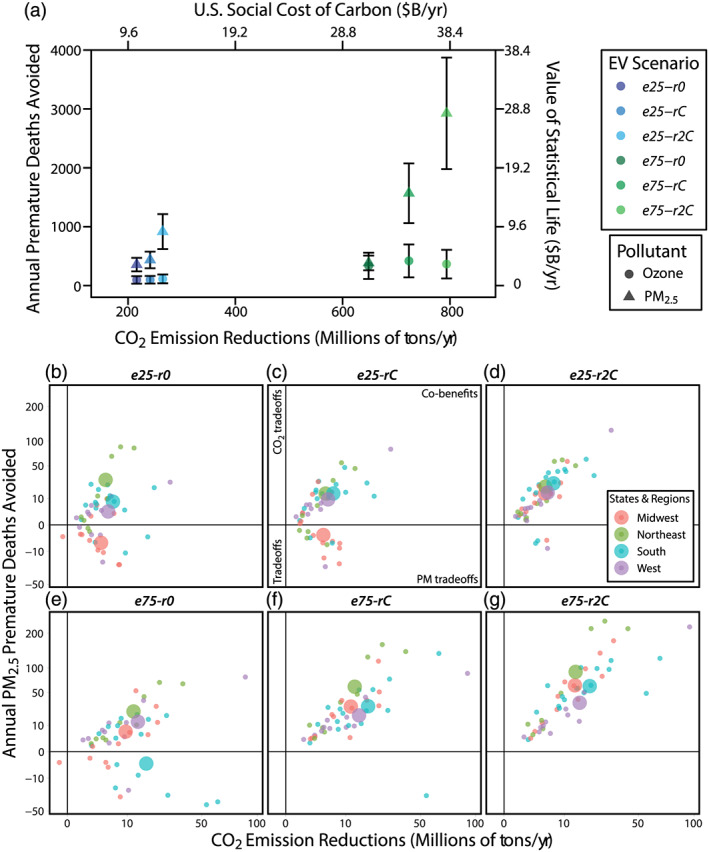
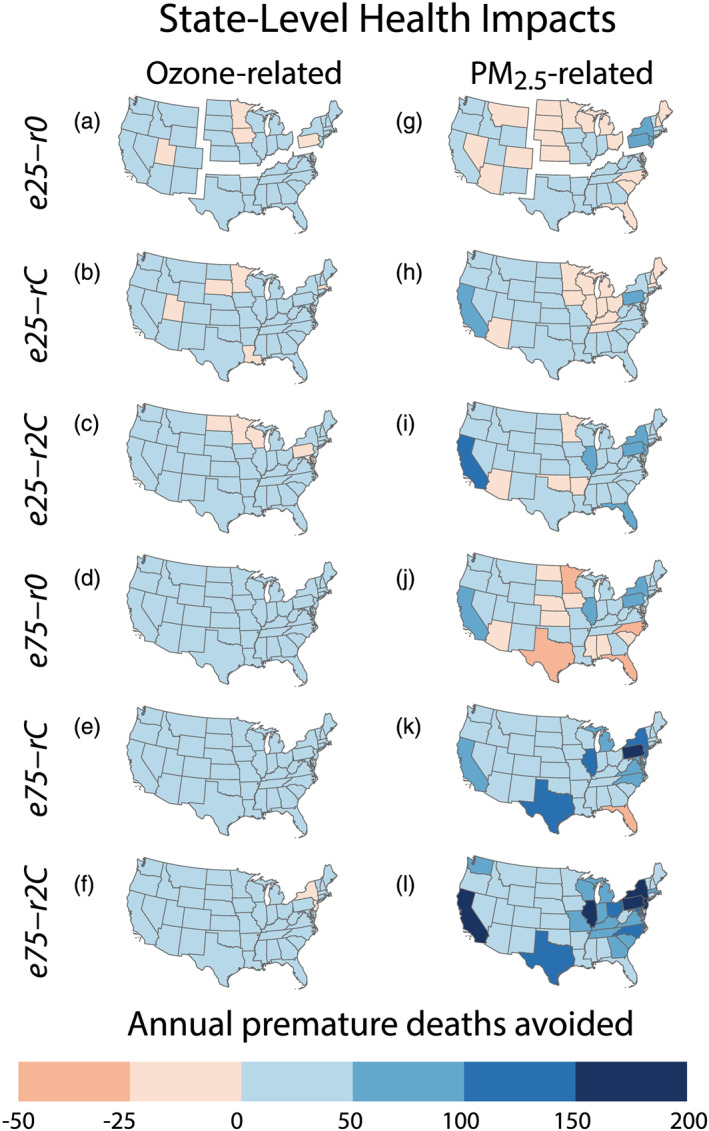
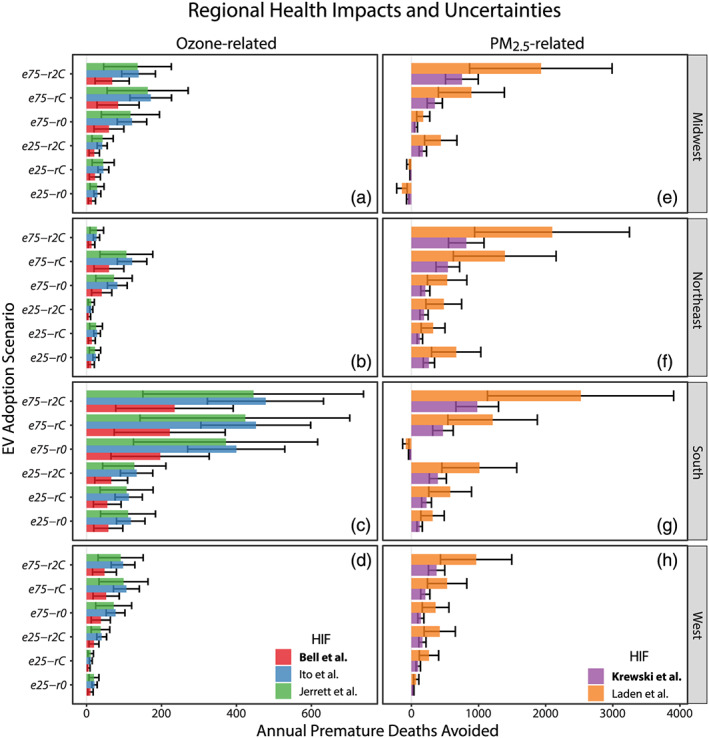
Vehicle electrification is a common climate change mitigation strategy, with policymakers invoking co-beneficial reductions in carbon dioxide (CO2) and air pollutant emissions. However, while previous studies of U.S. electric vehicle (EV) adoption consistently predict CO2 mitigation benefits, air quality outcomes are equivocal and depend on policies assessed and experimental parameters. We analyze climate and health co-benefits and trade-offs of six U.S. EV adoption scenarios: 25% or 75% replacement of conventional internal combustion engine vehicles, each under three different EV-charging energy generation scenarios. We transfer emissions from tailpipe to power generation plant, simulate interactions of atmospheric chemistry and meteorology using the GFDL-AM4 chemistry climate model, and assess health consequences and uncertainties using the U.S. Environmental Protection Agency Benefits Mapping Analysis Program Community Edition (BenMAP-CE). We find that 25% U.S. EV adoption, with added energy demand sourced from the present-day electric grid, annually results in a ~242 M ton reduction in CO2 emissions, 437 deaths avoided due to PM2.5 reductions (95% CI: 295, 578), and 98 deaths avoided due to lesser ozone formation (95% CI: 33, 162). Despite some regions experiencing adverse health outcomes, ~$16.8B in damages avoided are predicted. Peak CO2 reductions and health benefits occur with 75% EV adoption and increased emission-free energy sources (~$70B in damages avoided). When charging-electricity from aggressive EV adoption is combustion-only, adverse health outcomes increase substantially, highlighting the importance of low-to-zero emission power generation for greater realization of health co-benefits. Our results provide a more nuanced understanding of the transportation sector's climate change mitigation-health impact relationship.
Keywords: air quality; climate change; co‐benefits; electric vehicles; health impact analysis.
©2020. The Authors.
Conflict of interest statement
The authors declare no conflicts of interest relevant to this study.
Figures
References
-
- Anenberg, S. C. , Henze, D. K. , Tinney, V. , Kinney, P. L. , Raich, W. , Fann, N. , Malley, C. S. , Roman, H. , Lamsal, L. , Duncan, B. , & Martin, R. V. (2018). Estimates of the global burden of ambient PM2.5, ozone, and NO2 on asthma incidence and emergency room visits. Environmental Health Perspectives, 126(10), 107004 https://10.1289/EHP3766 - DOI - PMC - PubMed
-
- Anenberg, S. , Miller, J. , Henze, D. , & Minjares, R. (2019). A global snapshot of the air pollution‐related health impacts of transportation sector emissions in 2010 and 2015, International Council on Clean Transportation. Available at: https://theicct.org/sites/default/files/publications/Global_health_impac...
-
- Callahan, C. W. , Schnell, J. L. , & Horton, D. E. (2019). Multi‐index attribution of extreme winter air quality in Beijing, China. Journal of Geophysical Research: Atmospheres, 124, 4567–4583. 10.1029/2018JD029738 - DOI
-
- City of Chicago (2008). Chicago Climate Action Plan. Available at: https://www.chicago.gov/content/dam/city/progs/env/CCAP/CCAP.pdf
LinkOut - more resources
Full Text Sources