

Microfluidic devices powered by integrated elasto-magnetic pumps
- PMID: 33094306
- PMCID: PMC7654506
- DOI: 10.1039/d0lc00935k
Microfluidic devices powered by integrated elasto-magnetic pumps
Erratum in
-
Correction: Microfluidic devices powered by integrated elasto-magnetic pumps.Lab Chip. 2021 Aug 7;21(15):3019-3020. doi: 10.1039/d1lc90063c. Epub 2021 Jun 24. Lab Chip. 2021. PMID: 34165486 Free PMC article.
Abstract
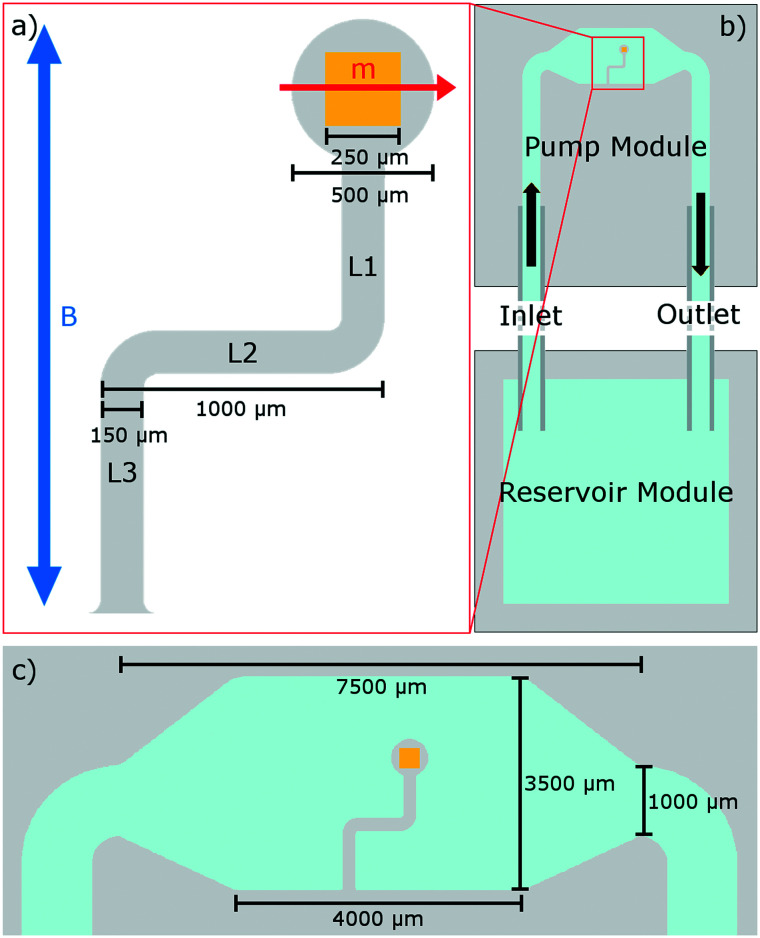
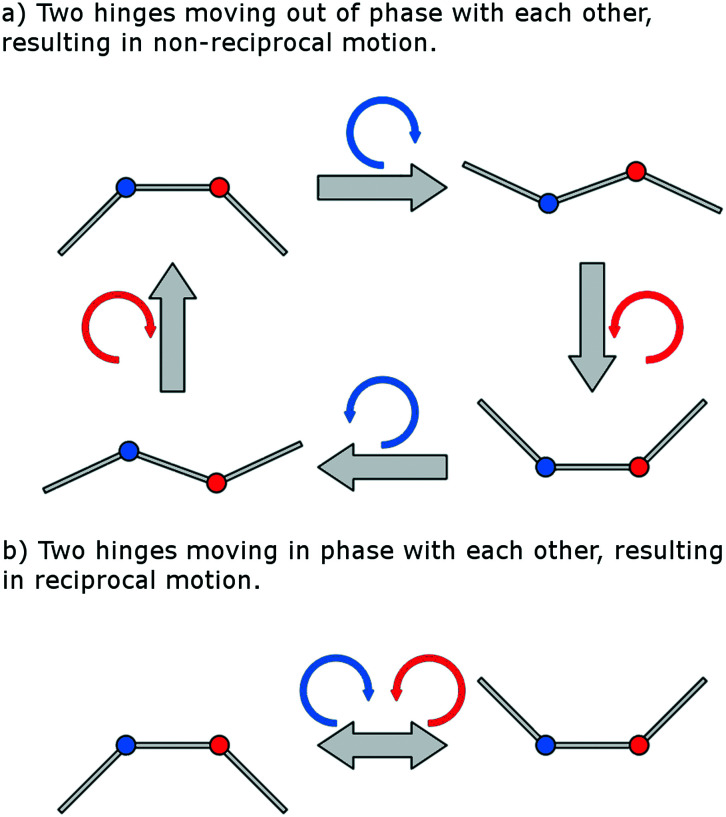
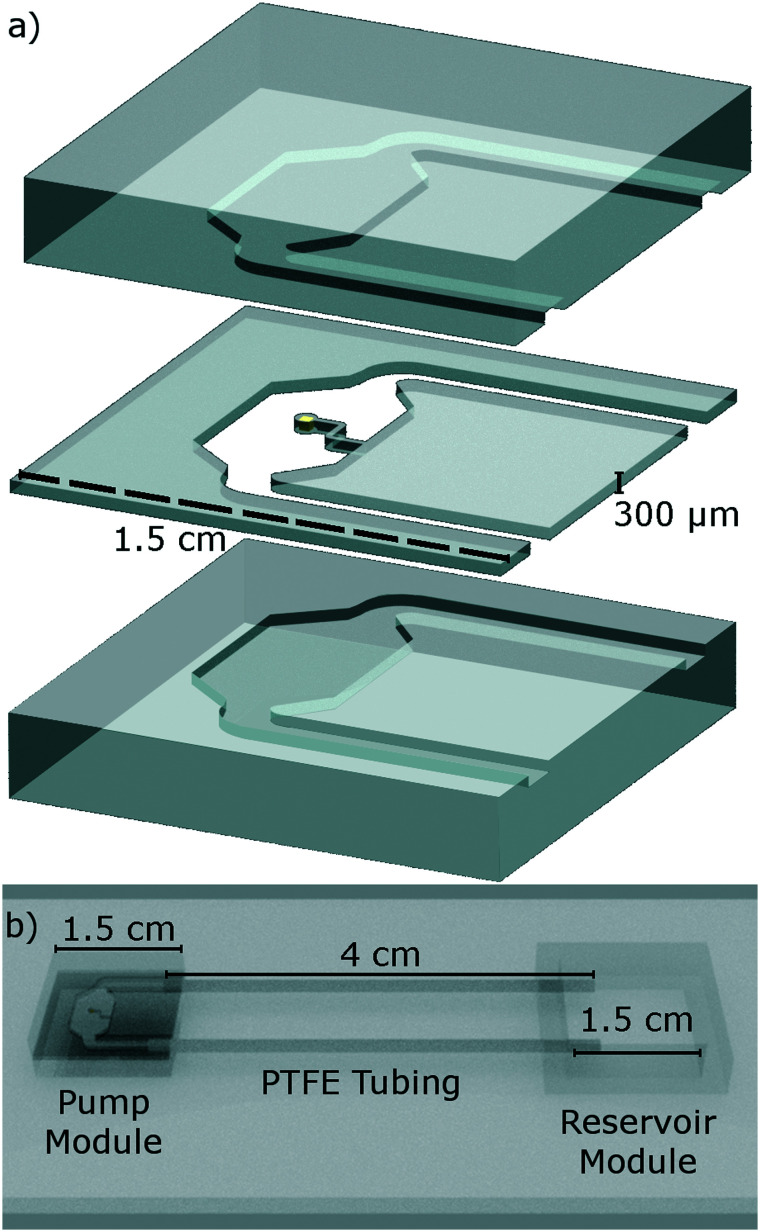
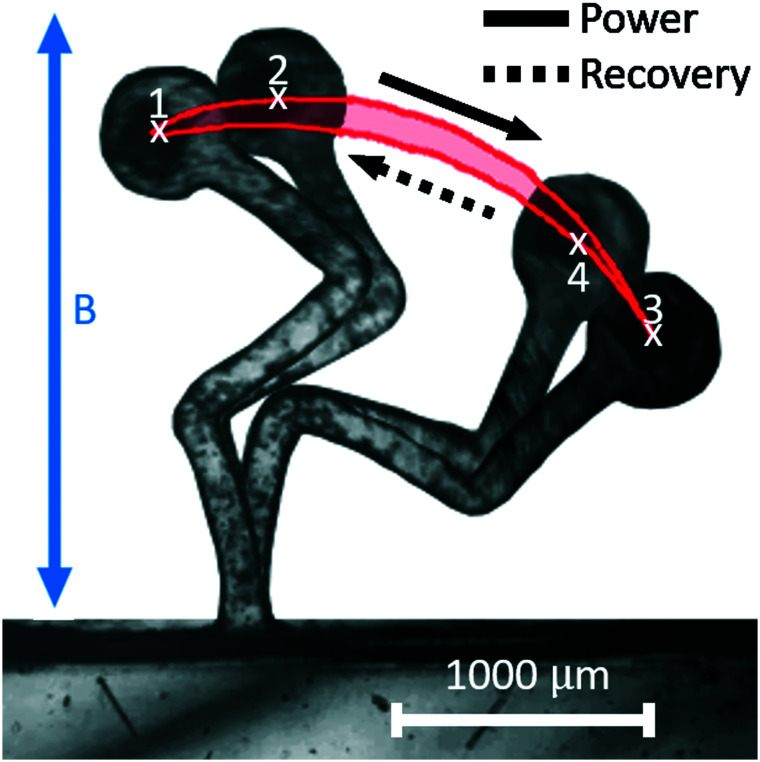
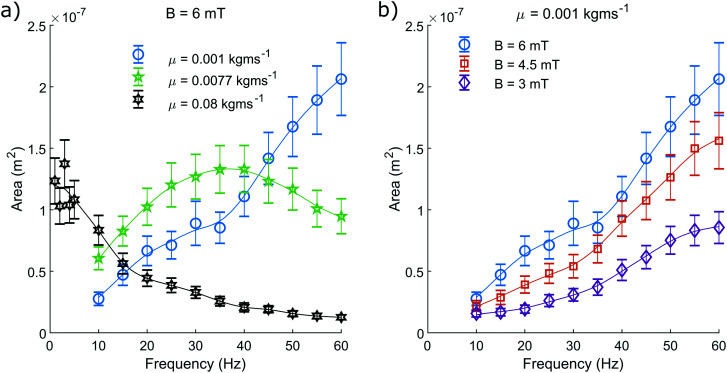
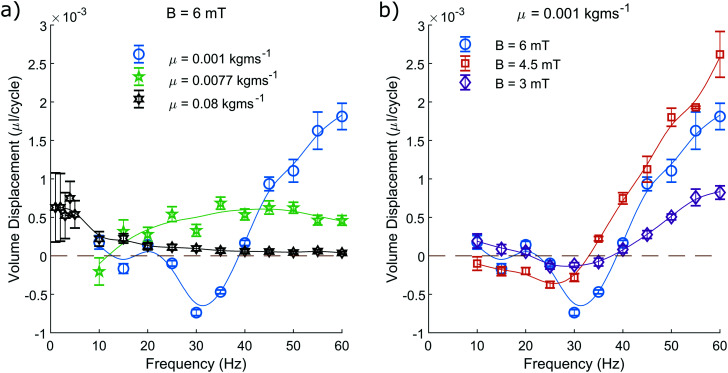
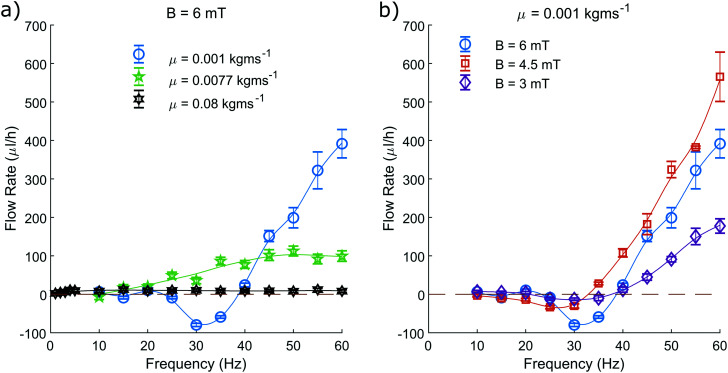
We show how an asymmetric elasto-magnetic system provides a novel integrated pumping solution for lab-on-a-chip and point of care devices. This monolithic pumping solution, inspired by Purcell's 3-link swimmer, is integrated within a simple microfluidic device, bypassing the requirement of external connections. We experimentally prove that this system can provide tuneable fluid flow with a flow rate of up to 600 μL h-1. This fluid flow is achieved by actuating the pump using a weak, uniform, uniaxial, oscillating magnetic field, with field amplitudes in the range of 3-6 mT. Crucially, the fluid flow can be reversed by adjusting the driving frequency. We experimentally prove that this device can successfully operate on fluids with a range of viscosities, where pumping at higher viscosity correlates with a decreasing optimal driving frequency. The fluid flow produced by this device is understood here by examining the non-reciprocal motion of the elasto-magnetic component. This device has the capability to replace external pumping systems with a simple, integrated, lab-on-a-chip component.
Figures
Similar articles
-
A Miniaturized Archimedean Screw Pump for High-Viscosity Fluid Pumping in Microfluidics.Micromachines (Basel). 2023 Jul 12;14(7):1409. doi: 10.3390/mi14071409. Micromachines (Basel). 2023. PMID: 37512720 Free PMC article.
-
Numerical investigation of flexible Purcell-like integrated microfluidic pumps.J Appl Phys. 2022 Oct 28;132(16):164701. doi: 10.1063/5.0109263. Epub 2022 Oct 25. J Appl Phys. 2022. PMID: 36313737 Free PMC article.
-
Self-assembled artificial cilia.Proc Natl Acad Sci U S A. 2010 Feb 2;107(5):1844-7. doi: 10.1073/pnas.0906819106. Epub 2009 Nov 23. Proc Natl Acad Sci U S A. 2010. PMID: 19934055 Free PMC article.
-
Towards practical sample preparation in point-of-care testing: user-friendly microfluidic devices.Lab Chip. 2020 Apr 7;20(7):1191-1203. doi: 10.1039/d0lc00047g. Epub 2020 Mar 2. Lab Chip. 2020. PMID: 32119024 Review.
-
Novel Pumping Methods for Microfluidic Devices: A Comprehensive Review.Biosensors (Basel). 2022 Nov 1;12(11):956. doi: 10.3390/bios12110956. Biosensors (Basel). 2022. PMID: 36354465 Free PMC article. Review.
Cited by
-
A frugal microfluidic pump.Lab Chip. 2021 Dec 7;21(24):4772-4778. doi: 10.1039/d1lc00691f. Lab Chip. 2021. PMID: 34751689 Free PMC article.
-
NFC Smartphone-Based Electrochemical Microfluidic Device Integrated with Nanobody Recognition for C-Reactive Protein.ACS Sens. 2024 Jun 28;9(6):3066-3074. doi: 10.1021/acssensors.4c00249. Epub 2024 Jun 15. ACS Sens. 2024. PMID: 38877998 Free PMC article.
-
Herringbone micromixers for particle filtration.Biomicrofluidics. 2023 Jan 23;17(1):014106. doi: 10.1063/5.0134431. eCollection 2023 Jan. Biomicrofluidics. 2023. PMID: 36704613 Free PMC article.
-
A Miniaturized Archimedean Screw Pump for High-Viscosity Fluid Pumping in Microfluidics.Micromachines (Basel). 2023 Jul 12;14(7):1409. doi: 10.3390/mi14071409. Micromachines (Basel). 2023. PMID: 37512720 Free PMC article.
-
Numerical investigation of flexible Purcell-like integrated microfluidic pumps.J Appl Phys. 2022 Oct 28;132(16):164701. doi: 10.1063/5.0109263. Epub 2022 Oct 25. J Appl Phys. 2022. PMID: 36313737 Free PMC article.
References
-
- Jung W., Han J., Choi J.-W., Ahn C. H. Microelectron. Eng. 2015;132:46–57.
-
- Abgrall P., Gue A. J. Micromech. Microeng. 2007;17:R15.
-
- Jung W., Han J., Kai J., Lim J.-Y., Sul D., Ahn C. H. Lab Chip. 2013;13:4653–4662. - PubMed
Publication types
MeSH terms
Grants and funding
LinkOut - more resources
Full Text Sources
Miscellaneous