. 2021 Feb 1;218(2):e20201234.
doi: 10.1084/jem.20201234.

T reg cell-intrinsic requirements for ST2 signaling in health and neuroinflammation

Affiliations

T reg cell-intrinsic requirements for ST2 signaling in health and neuroinflammation

Saskia Hemmers et al. J Exp Med. .

Abstract

ST2, the receptor for the alarmin IL-33, is expressed by a subset of regulatory T (T reg) cells residing in nonlymphoid tissues, and these cells can potently expand upon provision of exogenous IL-33. Whether the accumulation and residence of T reg cells in tissues requires their cell-intrinsic expression of and signaling by ST2, or whether indirect IL-33 signaling acting on other cells suffices, has been a matter of contention. Here, we report that ST2 expression on T reg cells is largely dispensable for their accumulation and residence in nonlymphoid organs, including the visceral adipose tissue (VAT), even though cell-intrinsic sensing of IL-33 promotes type 2 cytokine production by VAT-residing T reg cells. In addition, we uncovered a novel ST2-dependent role for T reg cells in limiting the size of IL-17A-producing γδT cells in the CNS in a mouse model of neuroinflammation, experimental autoimmune encephalomyelitis (EAE). Finally, ST2 deficiency limited to T reg cells led to disease exacerbation in EAE.


Conflict of interest statement

Disclosures: A.Y. Rudensky reported personal fees from Sonoma Biotherapeutics outside the submitted work. No other disclosures were reported.

Figures
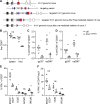
Figure S1.
Figure S1.
ST2 expression on T cells promotes antiviral T cell response against LCMV. (A) Schematic overview of generation of a novel conditional KO allele for ST2. loxP sites (purple triangles) were introduced into the genomic Il1rl1 locus to flank exon 3 (red box) by homologous recombination in embryonic stem cells. The targeting vector contained a neo cassette flanked by frt sites (blue ovals) to allow for selection of successful recombination at the locus. The neomycin selection cassette was removed by breeding mice that carried the recombined allele in their germline with a FLPe-deleter strain. The Il1rl1fl allele was subsequently intercrossed with Foxp3yfpcre or CD4-cre mice to specifically restrict ST2 deletion to T reg cells in the former and all T cells in the latter by cre recombinase-mediated excision of the loxP flanked exon 3. (B–F) Control (ctrl; n = 4; black triangles) and Il1rl1CD4cre mice (n = 3; white triangles) were infected with 2 × 10⁵ PFU LCMV Armstrong. All data shown here are from day 7 after infection, including total immune cell numbers in spleen and liver (B). LCMV-specific CD8 T cells were quantified in spleen (C) and liver (D) using tetramers detecting cells responding to the virus-derived peptides GP33 and NP396. Production of IFNγ by CD8 (E) and CD4 (F) T cells was assessed after ex vivo stimulation with αCD3/αCD28 or LCMV-derived peptides. Data in B–F are plotted as means ± SEM and representative of two independent experiments. **, P ≤ 0.01; *, P ≤ 0.05; ns, P > 0.05 by unpaired t test.
Figure 1.
Figure 1.
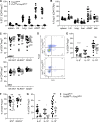
IL-33 signaling is not required to maintain tissue T reg cells but promotes type 2 cytokine production in adipose tissue. (A and B) Frequency of ST2-expressing T reg cells (A) or Foxp3-expressing cells among CD4+TCRβ+ cells (B) in lymphoid and nonlymphoid tissues of Foxp3yfpcre (n = 19; black squares) or Il1rl1fl/flxFoxp3yfpcre mice (n = 9–14; open squares). (C) Frequency of GATA3-, KLRG1-, or CD25-expressing T reg cells in eWAT (upper panel) or skin (lower panel) in Foxp3yfpcre (n = 14–19; black squares) or Il1rl1fl/flxFoxp3yfpcre mice (n = 9–14; open squares). (D) Representative example of intracellular cytokine staining for IL-5 after ex vivo stimulation with PMA and ionomycin (upper panel: Foxp3yfpcre; lower panel: Il1rl1fl/flxFoxp3yfpcre). (E) Quantification of IL-5–, IL-13–, and IL-10–expressing T reg cells in eWAT (as in D) contrasting Foxp3yfpcre (n = 8–13; black squares) with Il1rl1fl/flxFoxp3yfpcre mice (n = 5–10; open squares). IL-13 production was quantified in two independent experiments, whereas IL-5 and IL-10 production was assessed in all four experiments. (F) Frequency of ST2- or GATA3-expressing T reg cells in eWAT of Foxp3yfpcre (n = 12–18; black squares) or Myd88fl/flxFoxp3yfpcre mice (n = 6–8; open circles). (G) Quantification of IL-5–, IL-13–, and IL-10–expressing T reg cells in eWAT (as in D) contrasting Foxp3yfpcre (n = 8–18; black squares) with Myd88fl/flxFoxp3yfpcre mice (n = 4–8; open circles). All data were collected from 11–13-mo-old male mice. Data in A–C and E–G are plotted as means ± SEM and are pooled from two to four independent experiments. ****, P ≤ 0.0001; ***, P ≤ 0.001; **, P ≤ 0.01; *, P ≤ 0.05; ns, P > 0.05 by unpaired t test.
Figure S2.
Figure S2.
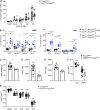
T reg cell–specific loss of the signaling adapter MyD88 affects body weight and adipose tissue immune cell composition. (A) T reg cell frequencies in adipose tissue are plotted for individual mice of the indicated ages. (B) Mice received either DPBS or 500 ng of recombinant mouse IL-33 i.p. as indicated. Frequency of ST2-, KLRG1-, GATA3-, or IL-5–expressing CD4+ T cells in eWAT (left) or lung (right) contrasting Il1rl1fl/+xFoxp3yfpcre (n = 6; DPBS, black filled squares; IL-33, black open squares) and Il1rl1fl/flxFoxp3yfpcre mice (n = 6; DPBS, blue filled squares; IL-33, blue open squares) are plotted. (C–G) All data were collected from 11–13-mo-old male mice. Total body weight (C), eWAT weight (D), and liver weight (E) are plotted for individual mice. (F) Quantification of immune cells in liver and eWAT from Foxp3yfpcre (n = 8–18; black squares) or Myd88fl/flxFoxp3yfpcre mice (n = 4–8; open circles). (G) Absolute numbers of T reg cells in lymphoid and nonlymphoid tissues of Foxp3yfpcre (n = 19; black squares) or Il1rl1fl/flxFoxp3yfpcre mice (n = 9–14; open squares). Data in A–G are plotted as means ± SEM and are pooled from two to four independent experiments. ***, P ≤ 0.001; **, P ≤ 0.01; *, P ≤ 0.05; ns > 0.05 by one-way ANOVA with Sidak’s multiple comparisons correction (B) or unpaired t test (A and C–G). For clarity, only comparisons that were significantly different are indicated in B.
Figure 2.
Figure 2.
Systemic delivery of IL-33 drives T reg cell expansion independent of ST2 expression. (A) Mice received either DPBS or 500 ng of recombinant mouse IL-33 i.p. as indicated. (B and C) Frequency of Foxp3-expressing cells of CD4+ cells (B) or absolute numbers of T reg cells (C) in lymphoid and nonlymphoid tissues of Il1rl1fl/+xFoxp3yfpcre (n = 6; DPBS, black filled squares; IL-33, black open squares) or Il1rl1fl/flxFoxp3yfpcre mice (n = 6; DPBS, blue filled squares; IL-33, blue open squares). (D) Representative example of KLRG1 expression on the cell surface of CD4+TCRβ+ cells (upper panel: Il1rl1fl/+xFoxp3yfpcre; lower panel: Il1rl1fl/flxFoxp3yfpcre). (E) Frequency of ST2-, KLRG1-, GATA3-, or IL-5–expressing T reg cells in eWAT (upper panel) or lung (lower panel) contrasting Il1rl1fl/+xFoxp3yfpcre (n = 6; DPBS, black filled squares; IL-33, black open squares) and Il1rl1fl/flxFoxp3yfpcre mice (n = 6; DPBS, blue filled squares; IL-33, blue open squares). (F) Protein expression levels of FOXP3, KLRG1, and GATA3 on adipose tissue T reg cells from IL-33–treated mice are plotted for individual mice. (G) Total numbers of ILC2s (CD90+CD3εST2+KLRG1+) are plotted for individual mice from lung and eWAT. (H) Protein expression levels of ST2 on lung and adipose tissue CD4+Foxp3 T cells and ILC2s from IL-33–treated mice are presented. Data in B, C, and E–H are plotted as means ± SEM and are pooled from two independent experiments. ****, P ≤ 0.0001; ***, P ≤ 0.001; **, P ≤ 0.01; *, P ≤ 0.05 by one-way ANOVA with Sidak’s multiple comparisons correction (B, C, E, and G) or unpaired t test (F and H). For clarity, only comparisons that were significantly different are indicated. ND, nondetectable; geoMFI, geometric mean fluorescence intensity.
Figure 3.
Figure 3.
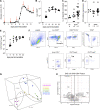
ST2-expressing T reg cells limit accumulation of γδT cells in VAT. (A–G) All data were collected from 11–13-mo-old male mice. (A–C) Total body weight (A), eWAT weight (B), and liver weight (C) are plotted for individual mice. (D) Quantification of immune cells in liver and eWAT. (E) Typical gating strategy to identify γδT cells (as CD3ε+TCRγδ+ cells of live CD45+ cells) in eWAT of indicated mice. (F) Relative abundance of TCRγδ+ cells among all CD45-expressing cells from Foxp3yfpcre (n = 14–19; black squares) or Il1rl1fl/flxFoxp3yfpcre mice (n = 9–14; open squares). (G) Absolute numbers of CD4+ T cells, T reg cells, γδT cells, and ILC2s in eWAT are plotted. (H) Blood glucose levels over 120 min after glucose challenge in 8-mo-old mice comparing Foxp3yfpcre (n = 8; black squares) with Il1rl1fl/flxFoxp3yfpcre mice (n = 6; open squares). (I–K) 6-wk-old male mice were placed on a high-fat diet for 13 wk, contrasting control mice (n = 11; black squares) with Il1rl1fl/flxFoxp3yfpcre mice (n = 10; open squares). Body weight was monitored over time and is presented as percentage of starting weight (I). Weight of liver and eWAT are plotted for individual mice after 13 wk of high-fat diet feeding (J). Relative abundance of T reg cells among CD4+TCRβ+ cells (left) and absolute numbers of T reg cells (right) in eWAT (K). Data in A–D and F–K are plotted as means ± SEM. A–D, F, and G are pooled from three to four independent experiments. Data in H are representative of two independent experiments. Data in I–K are pooled from two independent experiments. ****, P ≤ 0.0001; ***, P ≤ 0.001; **, P ≤ 0.01; *, P ≤ 0.05; ns, P > 0.05 by unpaired t test.
Figure S3.
Figure S3.
IL-33 protein is elevated in the spinal cord of symptomatic mice and correlates with progressive accumulation of ST2-expressing T reg cells in EAE. (A) C57BL/6 mice (n = 35; black squares) were immunized with MOG peptide in CFA to induce EAE. Disease progression was assessed on a daily basis and is plotted as a disease score. Mice were sampled at various stages of disease (red arrows) as follows: day 0 (n = 5), day 5 (n = 8), day 10 (n = 4), day 15 (n = 7), day 19 (n = 5), and day 23 (n = 6). (B) Total immune cell infiltration into the CNS was enumerated over the disease course and is plotted for individual mice. (C and D) IL-33 protein content (C) and Il33 transcript levels (D) were quantified in the spinal cord of naive mice (no treatment [tx]; n = 5), asymptomatic mice (score = 0; n = 7–8), and symptomatic mice (score > 0; n = 20–22). (E) Total numbers of ST2-expressing T reg cells in the CNS are plotted for individual mice over the course of disease. (F) A typical gating strategy is shown exemplifying how microglia (live CD45intCD11b+), T eff cells (dumpCD4+Foxp3CD62LCD44+), and T reg cells (dumpCD4+Foxp3+CD62LCD44+) were sorted from CNS for subsequent RNA-seq analysis at day 10 after EAE induction. FSC, forward scatter; SSC, side scatter. (G) 3D PCA of CD4 T eff cells from spleen (days 0, 5, and 10) and CNS (day 10). (H) Volcano plot of gene expression data contrasting T eff cells isolated from the CNS at day 10 after EAE induction from Foxp3yfpcre (WT) or Il1rl1fl/flxFoxp3yfpcre (KO) mice. Genes with a FC ≥ 2 and an adjusted P value < 0.05 are labeled. Genes increased in KO are on the left and genes decreased in KO are on the right of the plot. Data in C and D are representative of two independent experiments. Data in A–E are plotted as means ± SEM. *, P ≤ 0.05; ns, P > 0.05 by unpaired t test. PC, principal component.
Figure 4.
Figure 4.
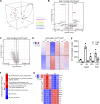
T reg cell–specific ST2 deficiency results in disease exacerbation in EAE. (A–C) 8–10-wk-old male mice were immunized with MOG/CFA to induce EAE. Disease was monitored daily starting at day 7 after immunization and is represented by a disease score plotted in A for Foxp3yfpcre (n = 23; black squares) or Il1rl1fl/flxFoxp3yfpcre mice (n = 24; open squares). Total immune cells (B) and relative abundance (left) and total number of T reg cells (right; C) in spleen and CNS of Foxp3yfpcre (n = 15; black squares) or Il1rl1fl/flxFoxp3yfpcre mice (n = 11; open squares) at day 21 after immunization. (D) Volcano plot of gene expression data contrasting microglia isolated from the CNS at day 10 after EAE induction from Foxp3yfpcre (WT) or Il1rl1fl/flxFoxp3yfpcre (KO) mice. Genes with a FC ≥ 2 and an adjusted P value < 0.05 are labeled. Genes increased in KO are on the left; genes decreased in KO are on the right of the plot. (E) Assessment of IL-17A and IFNγ production after ex vivo stimulation with PMA and ionomycin by CD4+ T cells infiltrating the CNS. (F) Relative abundance (left) and total number (right) of γδT cells in spleen and CNS day 21 after disease induction. (G) Assessment of IL-17A and IFNγ production after ex vivo stimulation with PMA and ionomycin by TCRγδ+ cells in the CNS by flow cytometry. Cells were pregated on live CD90+TCRγδ+ cells. (H) Data from G plotted for individual mice as frequency of cytokine producers (left) and total number of cytokine-producing γδT cells in the CNS. Data in A–C, E, F, and H are plotted as means ± SEM and pooled from four (A) and two (all others) independent experiments. ***, P ≤ 0.001; **, P ≤ 0.01; *, P ≤ 0.05; ns, P > 0.05 by unpaired t test (B, C, E, F, and H). Statistical significance in A was assessed by comparison of the area under the curve for individual mice using the nonparametric unpaired two-tailed Mann–Whitney U test.
Figure 5.
Figure 5.
ST2-dependent transcriptional reprogramming of splenic T reg cells is most prominent early during EAE. (A) 3D PCA of T reg cells from spleen (days 0, 5, and 10) and CNS (day 10). (B and C) Volcano plot of gene expression data contrasting T reg cells isolated from the CNS at day 10 (B) or spleen at day 5 (C) after EAE induction from Foxp3yfpcre (WT) or Il1rl1fl/flxFoxp3yfpcre (KO) mice. Genes with a FC ≥ 2 and an adjusted P value < 0.05 are labeled (B). Genes increased in KO are on the left; genes decreased in KO are on the right of the plot. (D) Relative average gene expression of a defined gene set (genes differentially expressed between T reg cells isolated from spleen at day 5) of splenic T reg cells at days 0, 5, and 10 after EAE induction. (E) Normalized Il1rl1 transcript levels extracted from RNA-seq analysis in T reg cells and CD4 T eff cells in spleen and CNS at various time points after EAE induction. (F) Pathways enriched among differentially expressed genes in T reg cells isolated from spleen at day 5 after EAE induction. Only pathways with an false discovery rate <25% are shown, and the normalized enrichment score (NES) is visually represented. (G) Normalized expression of selected differentially expressed genes comparing WT and KO T reg cells isolated from spleen at day 5 after EAE induction. PC, principal component.

References

    1. Ali, N., Zirak B., Rodriguez R.S., Pauli M.L., Truong H.A., Lai K., Ahn R., Corbin K., Lowe M.M., Scharschmidt T.C., et al. . 2017. Regulatory T Cells in Skin Facilitate Epithelial Stem Cell Differentiation. Cell. 169:1119–1129.e11. 10.1016/j.cell.2017.05.002 - DOI - PMC - PubMed
    1. Allan, D., Fairlie-Clarke K.J., Elliott C., Schuh C., Barnett S.C., Lassmann H., Linnington C., and Jiang H.R.. 2016. Role of IL-33 and ST2 signalling pathway in multiple sclerosis: expression by oligodendrocytes and inhibition of myelination in central nervous system. Acta Neuropathol. Commun. 4:75 10.1186/s40478-016-0344-1 - DOI - PMC - PubMed
    1. Arpaia, N., Green J.A., Moltedo B., Arvey A., Hemmers S., Yuan S., Treuting P.M., and Rudensky A.Y.. 2015. A Distinct Function of Regulatory T Cells in Tissue Protection. Cell. 162:1078–1089. 10.1016/j.cell.2015.08.021 - DOI - PMC - PubMed
    1. Bapat, S.P., Myoung Suh J., Fang S., Liu S., Zhang Y., Cheng A., Zhou C., Liang Y., LeBlanc M., Liddle C., et al. . 2015. Depletion of fat-resident Treg cells prevents age-associated insulin resistance. Nature. 528:137–141. 10.1038/nature16151 - DOI - PMC - PubMed
    1. Bennett, C.L., Christie J., Ramsdell F., Brunkow M.E., Ferguson P.J., Whitesell L., Kelly T.E., Saulsbury F.T., Chance P.F., and Ochs H.D.. 2001. The immune dysregulation, polyendocrinopathy, enteropathy, X-linked syndrome (IPEX) is caused by mutations of FOXP3. Nat. Genet. 27:20–21. 10.1038/83713 - DOI - PubMed

Publication types

MeSH terms