. 2020 Nov-Dec;40(7):1848-1865.
doi: 10.1148/rg.2020200159. Epub 2020 Oct 23.

Chest CT in COVID-19: What the Radiologist Needs to Know

Affiliations

Chest CT in COVID-19: What the Radiologist Needs to Know

Thomas C Kwee et al. Radiographics. 2020 Nov-Dec.

Erratum in

Abstract

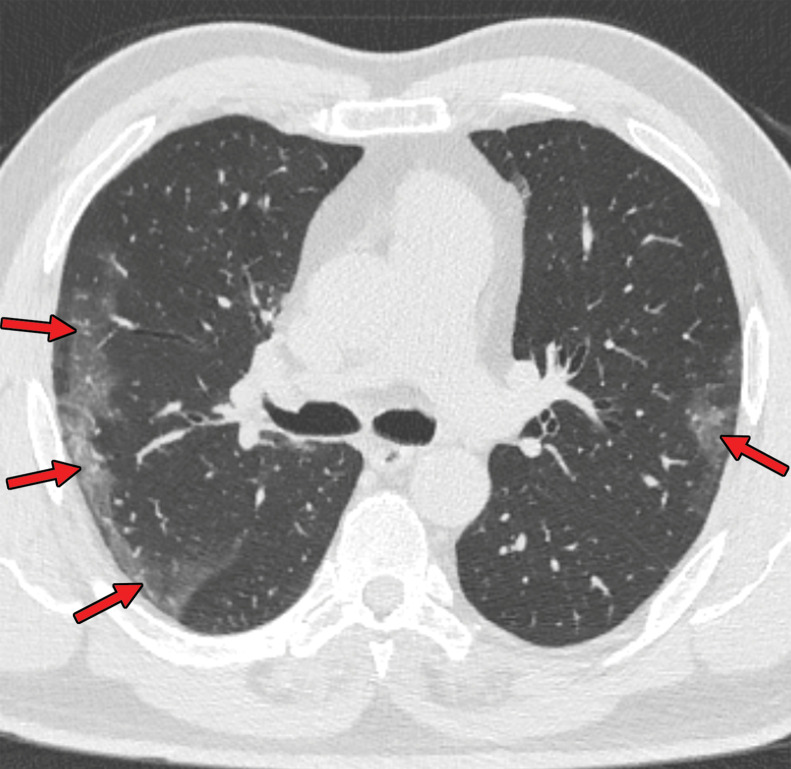
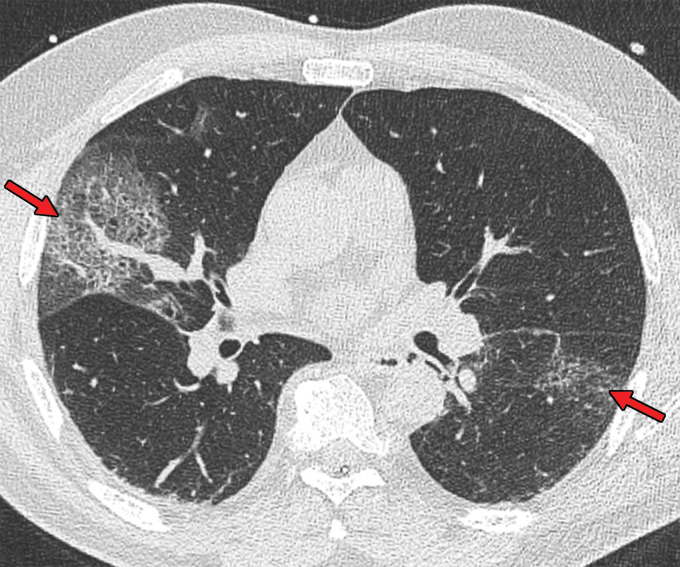
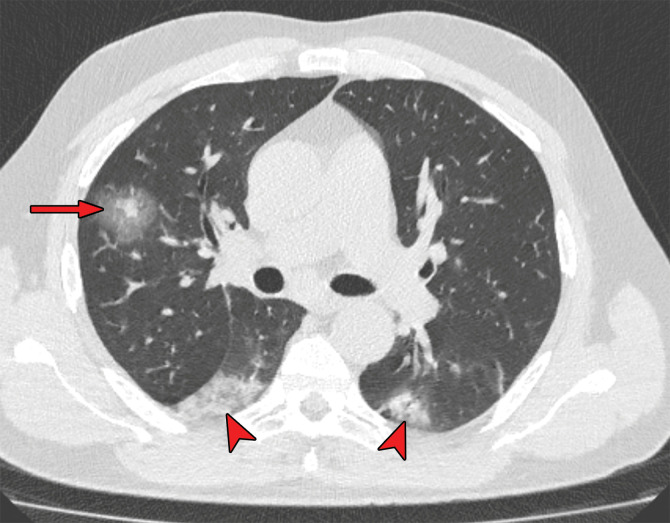
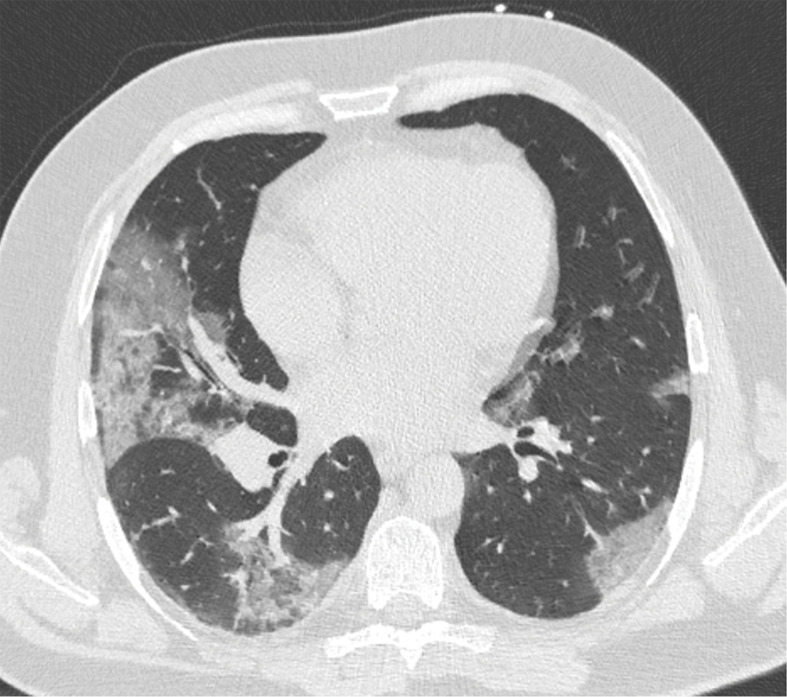
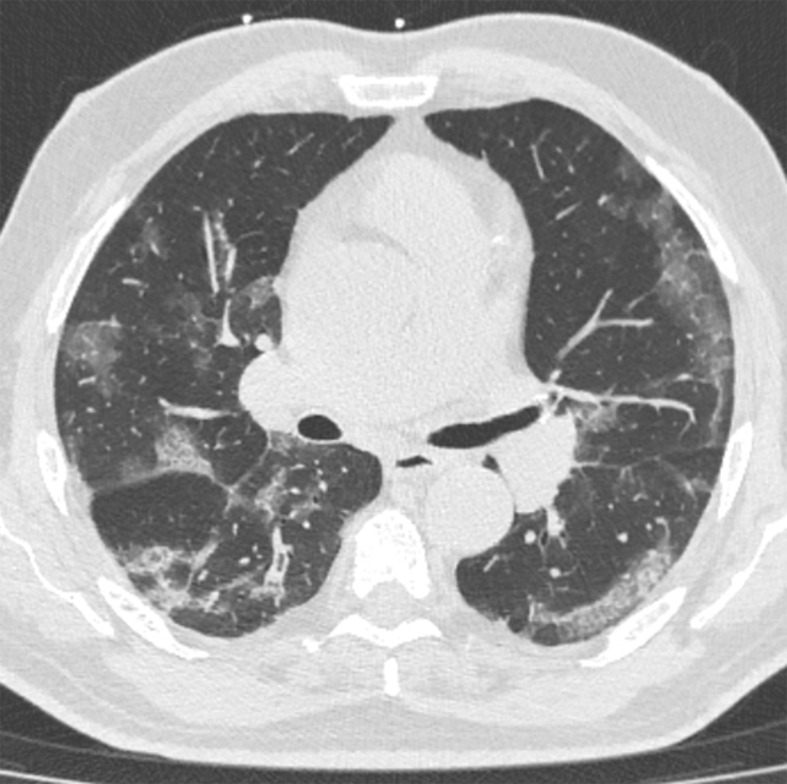
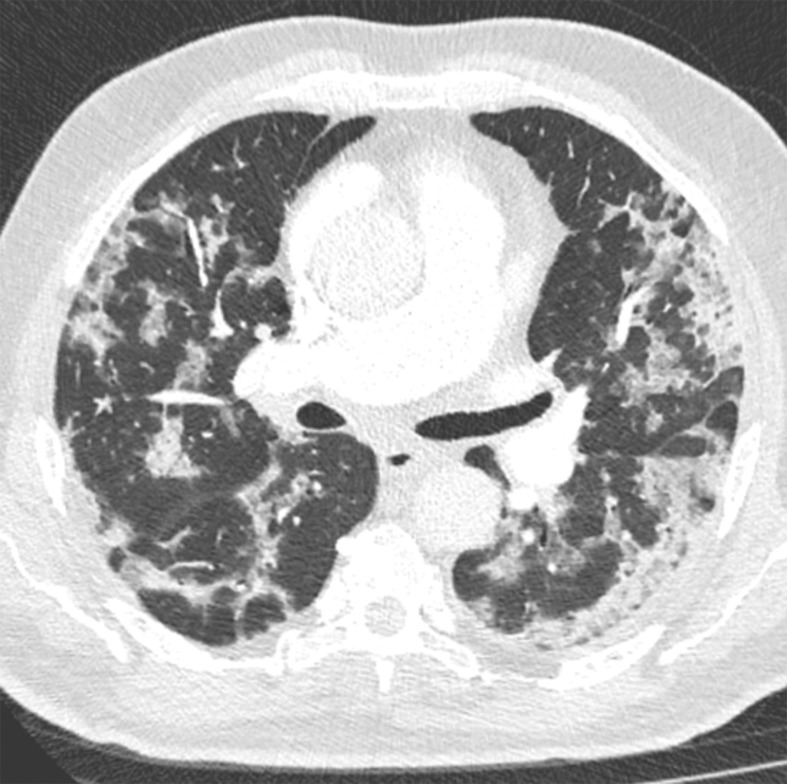
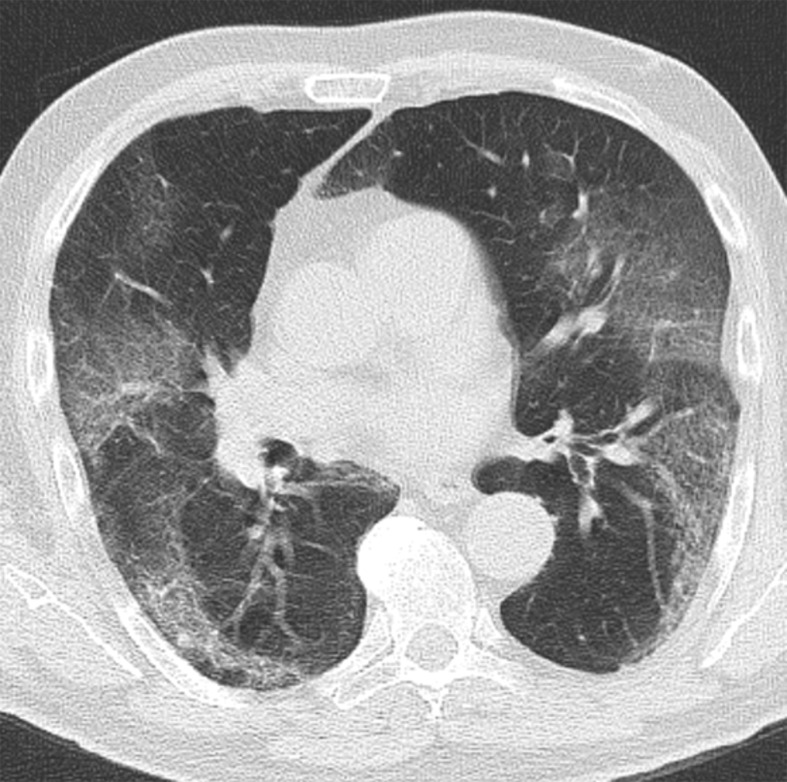
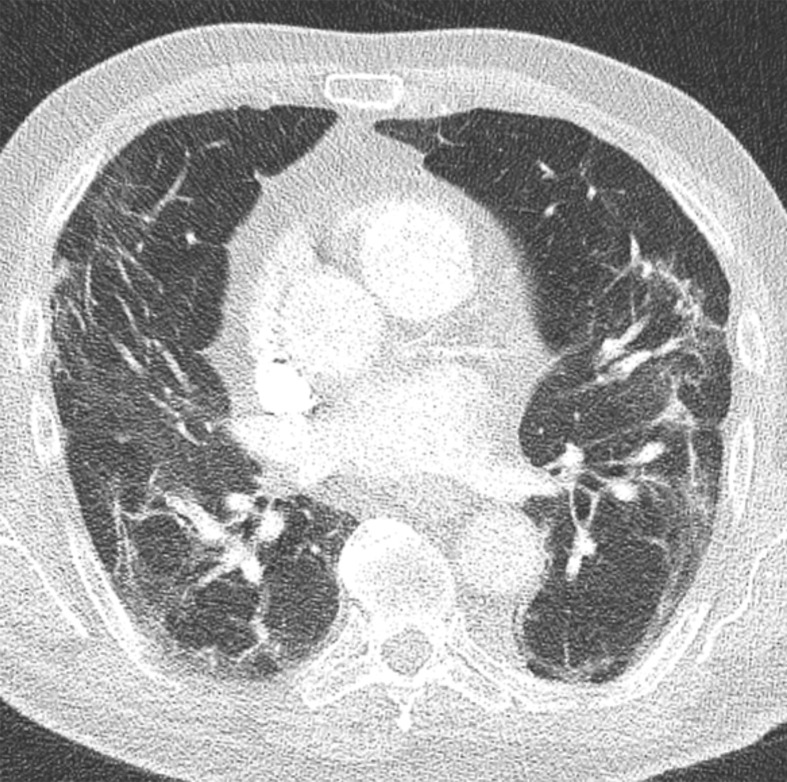
Chest CT has a potential role in the diagnosis, detection of complications, and prognostication of coronavirus disease 2019 (COVID-19). Implementation of appropriate precautionary safety measures, chest CT protocol optimization, and a standardized reporting system based on the pulmonary findings in this disease will enhance the clinical utility of chest CT. However, chest CT examinations may lead to both false-negative and false-positive results. Furthermore, the added value of chest CT in diagnostic decision making is dependent on several dynamic variables, most notably available resources (real-time reverse transcription-polymerase chain reaction [RT-PCR] tests, personal protective equipment, CT scanners, hospital and radiology personnel availability, and isolation room capacity) and the prevalence of both COVID-19 and other diseases with overlapping manifestations at chest CT. Chest CT is valuable to detect both alternative diagnoses and complications of COVID-19 (acute respiratory distress syndrome, pulmonary embolism, and heart failure), while its role for prognostication requires further investigation. The authors describe imaging and managing care of patients with COVID-19, with topics including (a) chest CT protocol, (b) chest CT findings of COVID-19 and its complications, (c) the diagnostic accuracy of chest CT and its role in diagnostic decision making and prognostication, and (d) reporting and communicating chest CT findings. The authors also review other specific topics, including the pathophysiology and clinical manifestations of COVID-19, the World Health Organization case definition, the value of performing RT-PCR tests, and the radiology department and personnel impact related to performing chest CT in COVID-19. ©RSNA, 2020.


Figures

COVID-19 pneumonia with typical imaging features according to the
Radiological Society of North America (RSNA) chest CT classification system
(51). Axial nonenhanced chest CT images (lung window) in a 59-year-old man
(a) and a 47-year-old man (b), each with positive RT-PCR test results for
SARS-CoV-2, show bilateral areas of ground-glass opacities (arrows) in a
peripheral distribution.
Figure 1a.
COVID-19 pneumonia with typical imaging features according to the Radiological Society of North America (RSNA) chest CT classification system (51). Axial nonenhanced chest CT images (lung window) in a 59-year-old man (a) and a 47-year-old man (b), each with positive RT-PCR test results for SARS-CoV-2, show bilateral areas of ground-glass opacities (arrows) in a peripheral distribution.
COVID-19 pneumonia with typical imaging features according to the
Radiological Society of North America (RSNA) chest CT classification system
(51). Axial nonenhanced chest CT images (lung window) in a 59-year-old man
(a) and a 47-year-old man (b), each with positive RT-PCR test results for
SARS-CoV-2, show bilateral areas of ground-glass opacities (arrows) in a
peripheral distribution.
Figure 1b.
COVID-19 pneumonia with typical imaging features according to the Radiological Society of North America (RSNA) chest CT classification system (51). Axial nonenhanced chest CT images (lung window) in a 59-year-old man (a) and a 47-year-old man (b), each with positive RT-PCR test results for SARS-CoV-2, show bilateral areas of ground-glass opacities (arrows) in a peripheral distribution.
Chest CT abnormalities of relatively high prevalence in COVID-19.
Axial nonenhanced chest CT image (lung window) shows bilateral ground-glass
opacities and dilated segmental and subsegmental vessels, mainly on the
right, in a 70-year-old man with positive RT-PCR test results for
SARS-CoV-2.
Figure 2.
Chest CT abnormalities of relatively high prevalence in COVID-19. Axial nonenhanced chest CT image (lung window) shows bilateral ground-glass opacities and dilated segmental and subsegmental vessels, mainly on the right, in a 70-year-old man with positive RT-PCR test results for SARS-CoV-2.
Chest CT abnormalities of relatively intermediate prevalence in
COVID-19, shown in a 63-year-old man with positive RT-PCR test results for
SARS-CoV-2. Axial nonenhanced chest CT image shows a subpleural curvilinear
opacity (arrow) and an area of ground-glass opacity (arrowhead) in the right
upper lobe.
Figure 3.
Chest CT abnormalities of relatively intermediate prevalence in COVID-19, shown in a 63-year-old man with positive RT-PCR test results for SARS-CoV-2. Axial nonenhanced chest CT image shows a subpleural curvilinear opacity (arrow) and an area of ground-glass opacity (arrowhead) in the right upper lobe.
Crazy-paving pattern in a 66-year-old man with COVID-19. Axial
nonenhanced chest CT image shows ground-glass opacities, with superimposed
septal thickening (arrows) in the middle lobe and left lower
lobe.
Figure 4.
Crazy-paving pattern in a 66-year-old man with COVID-19. Axial nonenhanced chest CT image shows ground-glass opacities, with superimposed septal thickening (arrows) in the middle lobe and left lower lobe.
Halo sign in a 55-year-old man with RT-PCR-test–proven
COVID-19. Axial nonenhanced chest CT images show consolidations surrounded
by ground-glass opacities (arrows) in both upper lobes, findings consistent
with the halo sign. There is a ground-glass opacity in the right upper lobe
(arrowhead in a) and consolidation in both lower lobes (arrowheads in
b).
Figure 5a.
Halo sign in a 55-year-old man with RT-PCR-test–proven COVID-19. Axial nonenhanced chest CT images show consolidations surrounded by ground-glass opacities (arrows) in both upper lobes, findings consistent with the halo sign. There is a ground-glass opacity in the right upper lobe (arrowhead in a) and consolidation in both lower lobes (arrowheads in b).
Halo sign in a 55-year-old man with RT-PCR-test–proven
COVID-19. Axial nonenhanced chest CT images show consolidations surrounded
by ground-glass opacities (arrows) in both upper lobes, findings consistent
with the halo sign. There is a ground-glass opacity in the right upper lobe
(arrowhead in a) and consolidation in both lower lobes (arrowheads in
b).
Figure 5b.
Halo sign in a 55-year-old man with RT-PCR-test–proven COVID-19. Axial nonenhanced chest CT images show consolidations surrounded by ground-glass opacities (arrows) in both upper lobes, findings consistent with the halo sign. There is a ground-glass opacity in the right upper lobe (arrowhead in a) and consolidation in both lower lobes (arrowheads in b).
Development of cavitating lung lesions in a 47-year-old man with
COVID-19. (a, b) Axial nonenhanced CT images (lung window) obtained at
hospital admission show ground-glass opacities in both lungs (early
progressive stage). (c, d) Axial nonenhanced CT images (lung window)
obtained after 10 days show progressive organizing consolidation (peak
stage). (e, f) Axial nonenhanced CT images (lung window) obtained 40 days
after the baseline CT images (a, b) show cavitating lesions in both lower
lobes (arrow) (late stage).
Figure 6a.
Development of cavitating lung lesions in a 47-year-old man with COVID-19. (a, b) Axial nonenhanced CT images (lung window) obtained at hospital admission show ground-glass opacities in both lungs (early progressive stage). (c, d) Axial nonenhanced CT images (lung window) obtained after 10 days show progressive organizing consolidation (peak stage). (e, f) Axial nonenhanced CT images (lung window) obtained 40 days after the baseline CT images (a, b) show cavitating lesions in both lower lobes (arrow) (late stage).
Development of cavitating lung lesions in a 47-year-old man with
COVID-19. (a, b) Axial nonenhanced CT images (lung window) obtained at
hospital admission show ground-glass opacities in both lungs (early
progressive stage). (c, d) Axial nonenhanced CT images (lung window)
obtained after 10 days show progressive organizing consolidation (peak
stage). (e, f) Axial nonenhanced CT images (lung window) obtained 40 days
after the baseline CT images (a, b) show cavitating lesions in both lower
lobes (arrow) (late stage).
Figure 6b.
Development of cavitating lung lesions in a 47-year-old man with COVID-19. (a, b) Axial nonenhanced CT images (lung window) obtained at hospital admission show ground-glass opacities in both lungs (early progressive stage). (c, d) Axial nonenhanced CT images (lung window) obtained after 10 days show progressive organizing consolidation (peak stage). (e, f) Axial nonenhanced CT images (lung window) obtained 40 days after the baseline CT images (a, b) show cavitating lesions in both lower lobes (arrow) (late stage).
Development of cavitating lung lesions in a 47-year-old man with
COVID-19. (a, b) Axial nonenhanced CT images (lung window) obtained at
hospital admission show ground-glass opacities in both lungs (early
progressive stage). (c, d) Axial nonenhanced CT images (lung window)
obtained after 10 days show progressive organizing consolidation (peak
stage). (e, f) Axial nonenhanced CT images (lung window) obtained 40 days
after the baseline CT images (a, b) show cavitating lesions in both lower
lobes (arrow) (late stage).
Figure 6c.
Development of cavitating lung lesions in a 47-year-old man with COVID-19. (a, b) Axial nonenhanced CT images (lung window) obtained at hospital admission show ground-glass opacities in both lungs (early progressive stage). (c, d) Axial nonenhanced CT images (lung window) obtained after 10 days show progressive organizing consolidation (peak stage). (e, f) Axial nonenhanced CT images (lung window) obtained 40 days after the baseline CT images (a, b) show cavitating lesions in both lower lobes (arrow) (late stage).
Development of cavitating lung lesions in a 47-year-old man with
COVID-19. (a, b) Axial nonenhanced CT images (lung window) obtained at
hospital admission show ground-glass opacities in both lungs (early
progressive stage). (c, d) Axial nonenhanced CT images (lung window)
obtained after 10 days show progressive organizing consolidation (peak
stage). (e, f) Axial nonenhanced CT images (lung window) obtained 40 days
after the baseline CT images (a, b) show cavitating lesions in both lower
lobes (arrow) (late stage).
Figure 6d.
Development of cavitating lung lesions in a 47-year-old man with COVID-19. (a, b) Axial nonenhanced CT images (lung window) obtained at hospital admission show ground-glass opacities in both lungs (early progressive stage). (c, d) Axial nonenhanced CT images (lung window) obtained after 10 days show progressive organizing consolidation (peak stage). (e, f) Axial nonenhanced CT images (lung window) obtained 40 days after the baseline CT images (a, b) show cavitating lesions in both lower lobes (arrow) (late stage).
Development of cavitating lung lesions in a 47-year-old man with
COVID-19. (a, b) Axial nonenhanced CT images (lung window) obtained at
hospital admission show ground-glass opacities in both lungs (early
progressive stage). (c, d) Axial nonenhanced CT images (lung window)
obtained after 10 days show progressive organizing consolidation (peak
stage). (e, f) Axial nonenhanced CT images (lung window) obtained 40 days
after the baseline CT images (a, b) show cavitating lesions in both lower
lobes (arrow) (late stage).
Figure 6e.
Development of cavitating lung lesions in a 47-year-old man with COVID-19. (a, b) Axial nonenhanced CT images (lung window) obtained at hospital admission show ground-glass opacities in both lungs (early progressive stage). (c, d) Axial nonenhanced CT images (lung window) obtained after 10 days show progressive organizing consolidation (peak stage). (e, f) Axial nonenhanced CT images (lung window) obtained 40 days after the baseline CT images (a, b) show cavitating lesions in both lower lobes (arrow) (late stage).
Development of cavitating lung lesions in a 47-year-old man with
COVID-19. (a, b) Axial nonenhanced CT images (lung window) obtained at
hospital admission show ground-glass opacities in both lungs (early
progressive stage). (c, d) Axial nonenhanced CT images (lung window)
obtained after 10 days show progressive organizing consolidation (peak
stage). (e, f) Axial nonenhanced CT images (lung window) obtained 40 days
after the baseline CT images (a, b) show cavitating lesions in both lower
lobes (arrow) (late stage).
Figure 6f.
Development of cavitating lung lesions in a 47-year-old man with COVID-19. (a, b) Axial nonenhanced CT images (lung window) obtained at hospital admission show ground-glass opacities in both lungs (early progressive stage). (c, d) Axial nonenhanced CT images (lung window) obtained after 10 days show progressive organizing consolidation (peak stage). (e, f) Axial nonenhanced CT images (lung window) obtained 40 days after the baseline CT images (a, b) show cavitating lesions in both lower lobes (arrow) (late stage).
Transition from progressive stage to peak stage in a 69-year-old man
with COVID-19. (a) Axial nonenhanced chest CT image (lung window) obtained
at hospital admission shows bilateral areas of ground-glass opacities and
crazy-paving appearance. (b) Axial contrast-enhanced chest CT image (lung
window) obtained after 7 days shows progression from ground-glass opacities
to multifocal organizing consolidation.
Figure 7a.
Transition from progressive stage to peak stage in a 69-year-old man with COVID-19. (a) Axial nonenhanced chest CT image (lung window) obtained at hospital admission shows bilateral areas of ground-glass opacities and crazy-paving appearance. (b) Axial contrast-enhanced chest CT image (lung window) obtained after 7 days shows progression from ground-glass opacities to multifocal organizing consolidation.
Transition from progressive stage to peak stage in a 69-year-old man
with COVID-19. (a) Axial nonenhanced chest CT image (lung window) obtained
at hospital admission shows bilateral areas of ground-glass opacities and
crazy-paving appearance. (b) Axial contrast-enhanced chest CT image (lung
window) obtained after 7 days shows progression from ground-glass opacities
to multifocal organizing consolidation.
Figure 7b.
Transition from progressive stage to peak stage in a 69-year-old man with COVID-19. (a) Axial nonenhanced chest CT image (lung window) obtained at hospital admission shows bilateral areas of ground-glass opacities and crazy-paving appearance. (b) Axial contrast-enhanced chest CT image (lung window) obtained after 7 days shows progression from ground-glass opacities to multifocal organizing consolidation.
Occurrence of lung fibrosis in a 75-year-old man with COVID-19. (a)
Axial nonenhanced CT image (lung window) obtained at hospital admission
shows bilateral ground-glass opacities, which are mainly peripherally
located. (b) Axial contrast-enhanced CT image (lung window) obtained after 8
weeks shows bilateral curvilinear parenchymal bands with distortion of lung
architecture. Focal traction bronchiectasis (not shown) also
manifested.
Figure 8a.
Occurrence of lung fibrosis in a 75-year-old man with COVID-19. (a) Axial nonenhanced CT image (lung window) obtained at hospital admission shows bilateral ground-glass opacities, which are mainly peripherally located. (b) Axial contrast-enhanced CT image (lung window) obtained after 8 weeks shows bilateral curvilinear parenchymal bands with distortion of lung architecture. Focal traction bronchiectasis (not shown) also manifested.
Occurrence of lung fibrosis in a 75-year-old man with COVID-19. (a)
Axial nonenhanced CT image (lung window) obtained at hospital admission
shows bilateral ground-glass opacities, which are mainly peripherally
located. (b) Axial contrast-enhanced CT image (lung window) obtained after 8
weeks shows bilateral curvilinear parenchymal bands with distortion of lung
architecture. Focal traction bronchiectasis (not shown) also
manifested.
Figure 8b.
Occurrence of lung fibrosis in a 75-year-old man with COVID-19. (a) Axial nonenhanced CT image (lung window) obtained at hospital admission shows bilateral ground-glass opacities, which are mainly peripherally located. (b) Axial contrast-enhanced CT image (lung window) obtained after 8 weeks shows bilateral curvilinear parenchymal bands with distortion of lung architecture. Focal traction bronchiectasis (not shown) also manifested.
Findings classified as indeterminate appearance of COVID-19 pneumonia in a
26-year-old woman. Axial nonenhanced chest CT image (lung window) shows an area
of ground-glass opacity (arrow) in the posterior basal segment of the left lower
lobe. No other lung abnormalities were visualized. The RT-PCR test results were
positive for SARS-CoV-2.
Figures 9.
Findings classified as indeterminate appearance of COVID-19 pneumonia in a 26-year-old woman. Axial nonenhanced chest CT image (lung window) shows an area of ground-glass opacity (arrow) in the posterior basal segment of the left lower lobe. No other lung abnormalities were visualized. The RT-PCR test results were positive for SARS-CoV-2.
Findings classified as indeterminate appearance of COVID-19 pneumonia
according to the RSNA chest CT classification system (51) in a 24-year-old
woman. Axial nonenhanced chest CT image (lung window) shows ground-glass
opacities (arrow) in the right upper lobe. In addition, there are discrete
centrilobular opacities in the upper lobes. The RT-PCR test results were
negative for SARS-CoV-2 but positive for influenza type A.
Figures 10.
Findings classified as indeterminate appearance of COVID-19 pneumonia according to the RSNA chest CT classification system (51) in a 24-year-old woman. Axial nonenhanced chest CT image (lung window) shows ground-glass opacities (arrow) in the right upper lobe. In addition, there are discrete centrilobular opacities in the upper lobes. The RT-PCR test results were negative for SARS-CoV-2 but positive for influenza type A.
Findings classified as atypical appearance of COVID-19 pneumonia in a
94-year-old woman. Axial nonenhanced chest CT image (lung window) shows subtle
centrilobular tree-in-bud opacities (arrows) in the left lower lobe. The RT-PCR
test results were negative for SARS-CoV-2 but positive for influenza type
A.
Figure 11.
Findings classified as atypical appearance of COVID-19 pneumonia in a 94-year-old woman. Axial nonenhanced chest CT image (lung window) shows subtle centrilobular tree-in-bud opacities (arrows) in the left lower lobe. The RT-PCR test results were negative for SARS-CoV-2 but positive for influenza type A.
Mixed chest CT findings in an 86-year-old man. (a) Axial nonenhanced CT
image (lung window) obtained at hospital admission shows sublobar consolidation
(arrow) in the posterior segment of the right upper lobe, a finding more
consistent with lobar pneumonia than COVID-19. (b) Axial CT image obtained at a
more superior level shows the presence of ground-glass opacities (arrows).
Altogether, the findings were classified as indeterminate for COVID-19
pneumonia, according to the RSNA chest CT classification system (51). The RT-PCR
test results were positive for SARS-CoV-2.
Figure 12a.
Mixed chest CT findings in an 86-year-old man. (a) Axial nonenhanced CT image (lung window) obtained at hospital admission shows sublobar consolidation (arrow) in the posterior segment of the right upper lobe, a finding more consistent with lobar pneumonia than COVID-19. (b) Axial CT image obtained at a more superior level shows the presence of ground-glass opacities (arrows). Altogether, the findings were classified as indeterminate for COVID-19 pneumonia, according to the RSNA chest CT classification system (51). The RT-PCR test results were positive for SARS-CoV-2.
Mixed chest CT findings in an 86-year-old man. (a) Axial nonenhanced CT
image (lung window) obtained at hospital admission shows sublobar consolidation
(arrow) in the posterior segment of the right upper lobe, a finding more
consistent with lobar pneumonia than COVID-19. (b) Axial CT image obtained at a
more superior level shows the presence of ground-glass opacities (arrows).
Altogether, the findings were classified as indeterminate for COVID-19
pneumonia, according to the RSNA chest CT classification system (51). The RT-PCR
test results were positive for SARS-CoV-2.
Figure 12b.
Mixed chest CT findings in an 86-year-old man. (a) Axial nonenhanced CT image (lung window) obtained at hospital admission shows sublobar consolidation (arrow) in the posterior segment of the right upper lobe, a finding more consistent with lobar pneumonia than COVID-19. (b) Axial CT image obtained at a more superior level shows the presence of ground-glass opacities (arrows). Altogether, the findings were classified as indeterminate for COVID-19 pneumonia, according to the RSNA chest CT classification system (51). The RT-PCR test results were positive for SARS-CoV-2.
Development of ARDS in a 60-year-old man with COVID-19. (a) Axial
nonenhanced CT image (lung window) obtained at hospital admission shows
peripherally located ground-glass opacities (arrow), mainly in the right
lung. Note the preexisting centrilobular and paraseptal emphysema. (b) Axial
contrast-enhanced CT image (lung window) obtained after 3 days shows a
marked progression of lung abnormalities (arrows).
Figure 13a.
Development of ARDS in a 60-year-old man with COVID-19. (a) Axial nonenhanced CT image (lung window) obtained at hospital admission shows peripherally located ground-glass opacities (arrow), mainly in the right lung. Note the preexisting centrilobular and paraseptal emphysema. (b) Axial contrast-enhanced CT image (lung window) obtained after 3 days shows a marked progression of lung abnormalities (arrows).
Development of ARDS in a 60-year-old man with COVID-19. (a) Axial
nonenhanced CT image (lung window) obtained at hospital admission shows
peripherally located ground-glass opacities (arrow), mainly in the right
lung. Note the preexisting centrilobular and paraseptal emphysema. (b) Axial
contrast-enhanced CT image (lung window) obtained after 3 days shows a
marked progression of lung abnormalities (arrows).
Figure 13b.
Development of ARDS in a 60-year-old man with COVID-19. (a) Axial nonenhanced CT image (lung window) obtained at hospital admission shows peripherally located ground-glass opacities (arrow), mainly in the right lung. Note the preexisting centrilobular and paraseptal emphysema. (b) Axial contrast-enhanced CT image (lung window) obtained after 3 days shows a marked progression of lung abnormalities (arrows).
PE in a 73-year-old man with COVID-19. (a) Axial nonenhanced CT image
(lung window) at baseline shows peripherally diffuse ground-glass opacities
in both lungs. (b) Axial contrast-enhanced CT image (lung window) obtained
after 10 days shows increased consolidation in both lungs. Note the
bronchial dilatation within involved portions of the lungs. (c, d) Axial
contrast-enhanced CT image (mediastinal window) (c) and sagittal
reconstruction (d) obtained 10 days after the baseline images show a filling
defect (arrow) in a segmental pulmonary artery branch in the right lower
lobe, consistent with PE.
Figure 14a.
PE in a 73-year-old man with COVID-19. (a) Axial nonenhanced CT image (lung window) at baseline shows peripherally diffuse ground-glass opacities in both lungs. (b) Axial contrast-enhanced CT image (lung window) obtained after 10 days shows increased consolidation in both lungs. Note the bronchial dilatation within involved portions of the lungs. (c, d) Axial contrast-enhanced CT image (mediastinal window) (c) and sagittal reconstruction (d) obtained 10 days after the baseline images show a filling defect (arrow) in a segmental pulmonary artery branch in the right lower lobe, consistent with PE.
PE in a 73-year-old man with COVID-19. (a) Axial nonenhanced CT image
(lung window) at baseline shows peripherally diffuse ground-glass opacities
in both lungs. (b) Axial contrast-enhanced CT image (lung window) obtained
after 10 days shows increased consolidation in both lungs. Note the
bronchial dilatation within involved portions of the lungs. (c, d) Axial
contrast-enhanced CT image (mediastinal window) (c) and sagittal
reconstruction (d) obtained 10 days after the baseline images show a filling
defect (arrow) in a segmental pulmonary artery branch in the right lower
lobe, consistent with PE.
Figure 14b.
PE in a 73-year-old man with COVID-19. (a) Axial nonenhanced CT image (lung window) at baseline shows peripherally diffuse ground-glass opacities in both lungs. (b) Axial contrast-enhanced CT image (lung window) obtained after 10 days shows increased consolidation in both lungs. Note the bronchial dilatation within involved portions of the lungs. (c, d) Axial contrast-enhanced CT image (mediastinal window) (c) and sagittal reconstruction (d) obtained 10 days after the baseline images show a filling defect (arrow) in a segmental pulmonary artery branch in the right lower lobe, consistent with PE.
PE in a 73-year-old man with COVID-19. (a) Axial nonenhanced CT image
(lung window) at baseline shows peripherally diffuse ground-glass opacities
in both lungs. (b) Axial contrast-enhanced CT image (lung window) obtained
after 10 days shows increased consolidation in both lungs. Note the
bronchial dilatation within involved portions of the lungs. (c, d) Axial
contrast-enhanced CT image (mediastinal window) (c) and sagittal
reconstruction (d) obtained 10 days after the baseline images show a filling
defect (arrow) in a segmental pulmonary artery branch in the right lower
lobe, consistent with PE.
Figure 14c.
PE in a 73-year-old man with COVID-19. (a) Axial nonenhanced CT image (lung window) at baseline shows peripherally diffuse ground-glass opacities in both lungs. (b) Axial contrast-enhanced CT image (lung window) obtained after 10 days shows increased consolidation in both lungs. Note the bronchial dilatation within involved portions of the lungs. (c, d) Axial contrast-enhanced CT image (mediastinal window) (c) and sagittal reconstruction (d) obtained 10 days after the baseline images show a filling defect (arrow) in a segmental pulmonary artery branch in the right lower lobe, consistent with PE.
PE in a 73-year-old man with COVID-19. (a) Axial nonenhanced CT image
(lung window) at baseline shows peripherally diffuse ground-glass opacities
in both lungs. (b) Axial contrast-enhanced CT image (lung window) obtained
after 10 days shows increased consolidation in both lungs. Note the
bronchial dilatation within involved portions of the lungs. (c, d) Axial
contrast-enhanced CT image (mediastinal window) (c) and sagittal
reconstruction (d) obtained 10 days after the baseline images show a filling
defect (arrow) in a segmental pulmonary artery branch in the right lower
lobe, consistent with PE.
Figure 14d.
PE in a 73-year-old man with COVID-19. (a) Axial nonenhanced CT image (lung window) at baseline shows peripherally diffuse ground-glass opacities in both lungs. (b) Axial contrast-enhanced CT image (lung window) obtained after 10 days shows increased consolidation in both lungs. Note the bronchial dilatation within involved portions of the lungs. (c, d) Axial contrast-enhanced CT image (mediastinal window) (c) and sagittal reconstruction (d) obtained 10 days after the baseline images show a filling defect (arrow) in a segmental pulmonary artery branch in the right lower lobe, consistent with PE.
Superimposed pneumonia in a 69-year-old man with COVID-19. (a) Axial
nonenhanced CT image (lung window) at baseline shows ground-glass opacities
(arrows) posteriorly located in the left upper lobe and both lower lobes and
an area of consolidation (arrowhead) in the right lower lobe. (b) Axial
contrast-enhanced CT image (lung window) obtained after 22 days shows
increased consolidation in both lower lobes (red arrows) and consolidation
with central cavitation in the left upper lobe (yellow arrow). The culture
of puslike bronchial fluid was positive for Staphylococcus aureus. Note the
presence of pneumomediastinum (arrowhead), which is probably due to
long-lasting positive-pressure ventilation.
Figure 15a.
Superimposed pneumonia in a 69-year-old man with COVID-19. (a) Axial nonenhanced CT image (lung window) at baseline shows ground-glass opacities (arrows) posteriorly located in the left upper lobe and both lower lobes and an area of consolidation (arrowhead) in the right lower lobe. (b) Axial contrast-enhanced CT image (lung window) obtained after 22 days shows increased consolidation in both lower lobes (red arrows) and consolidation with central cavitation in the left upper lobe (yellow arrow). The culture of puslike bronchial fluid was positive for Staphylococcus aureus. Note the presence of pneumomediastinum (arrowhead), which is probably due to long-lasting positive-pressure ventilation.
Superimposed pneumonia in a 69-year-old man with COVID-19. (a) Axial
nonenhanced CT image (lung window) at baseline shows ground-glass opacities
(arrows) posteriorly located in the left upper lobe and both lower lobes and
an area of consolidation (arrowhead) in the right lower lobe. (b) Axial
contrast-enhanced CT image (lung window) obtained after 22 days shows
increased consolidation in both lower lobes (red arrows) and consolidation
with central cavitation in the left upper lobe (yellow arrow). The culture
of puslike bronchial fluid was positive for Staphylococcus aureus. Note the
presence of pneumomediastinum (arrowhead), which is probably due to
long-lasting positive-pressure ventilation.
Figure 15b.
Superimposed pneumonia in a 69-year-old man with COVID-19. (a) Axial nonenhanced CT image (lung window) at baseline shows ground-glass opacities (arrows) posteriorly located in the left upper lobe and both lower lobes and an area of consolidation (arrowhead) in the right lower lobe. (b) Axial contrast-enhanced CT image (lung window) obtained after 22 days shows increased consolidation in both lower lobes (red arrows) and consolidation with central cavitation in the left upper lobe (yellow arrow). The culture of puslike bronchial fluid was positive for Staphylococcus aureus. Note the presence of pneumomediastinum (arrowhead), which is probably due to long-lasting positive-pressure ventilation.

Comment in

References

    1. World Health Organization . Coronavirus . https://www.who.int/health-topics/coronavirus#tab=tab_1 . Accessed June 6, 2020 .
    1. World Health Organization . Pneumonia of unknown caus: China . https://www.who.int/csr/don/05-january-2020-pneumonia-of-unkown-cause-ch... . Published January 5, 2020. Accessed June 6, 2020 .
    1. World Health Organization . WHO announces COVID-19 outbreak a pandemic . http://www.euro.who.int/en/health-topics/health-emergencies/coronavirus-... . Published March 12, 2020. Accessed June 6, 2020 .
    1. Johns Hopkins University School of Medicine . Coronavirus Resource Center . https://coronavirus.jhu.edu/ . Updated June 13, 2020. Accessed June 13, 2020 .
    1. Thanh Le T , Andreadakis Z , Kumar A , et al. The COVID-19 vaccine development landscape . Nat Rev Drug Discov 2020. ; 19 ( 5 ): 305 – 306 . - PubMed