

Systems genetics analysis of the LXS recombinant inbred mouse strains:Genetic and molecular insights into acute ethanol tolerance
- PMID: 33095786
- PMCID: PMC7584226
- DOI: 10.1371/journal.pone.0240253
Systems genetics analysis of the LXS recombinant inbred mouse strains:Genetic and molecular insights into acute ethanol tolerance
Abstract
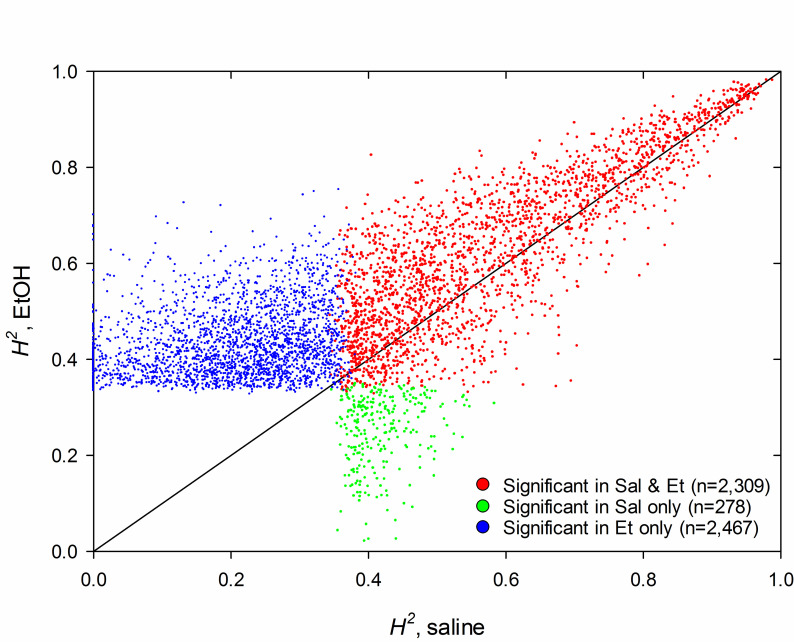
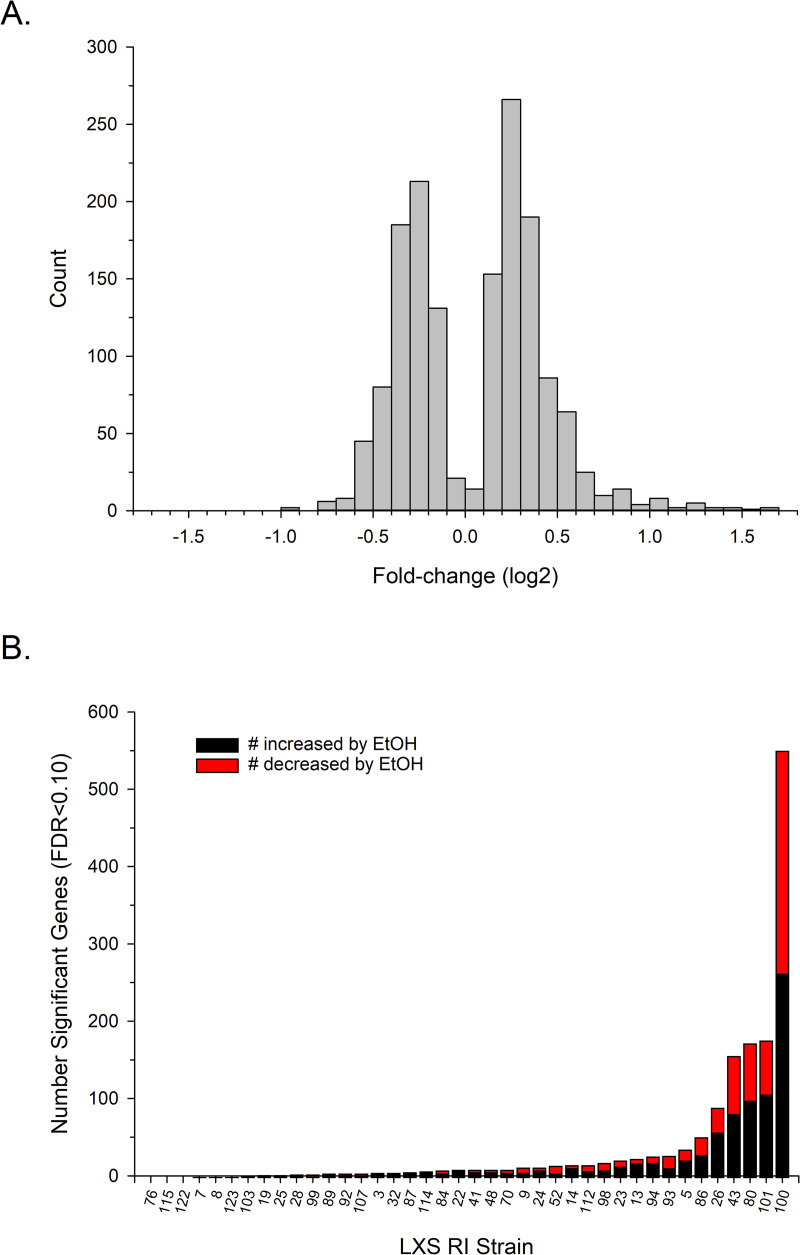
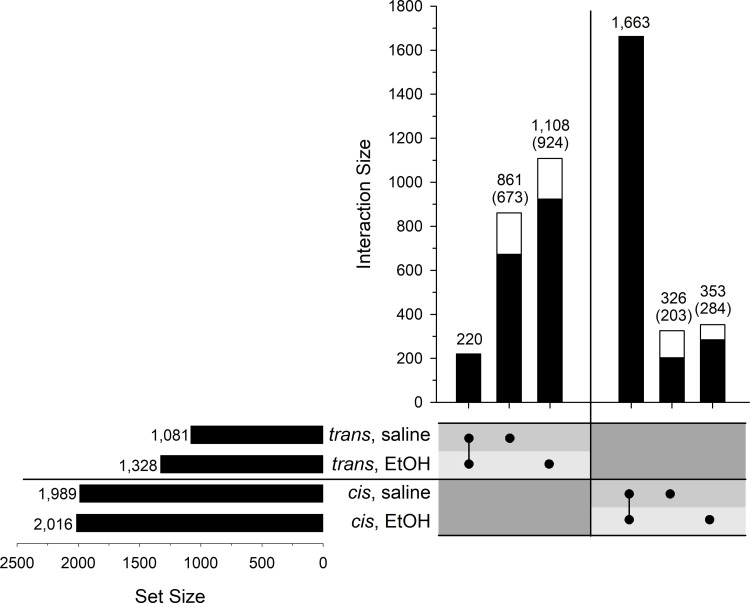
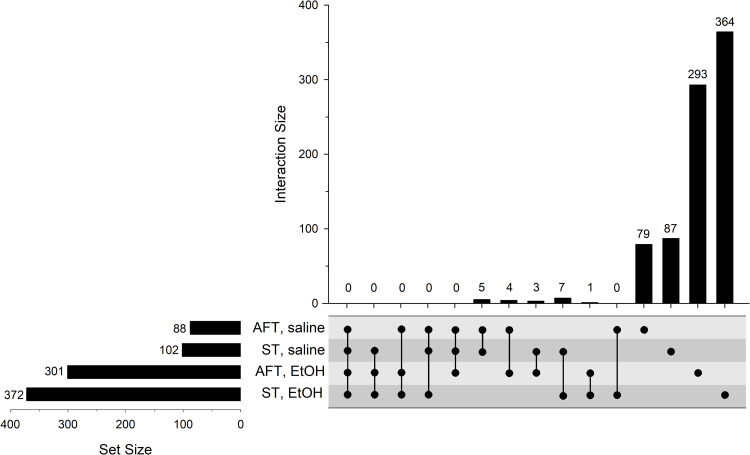
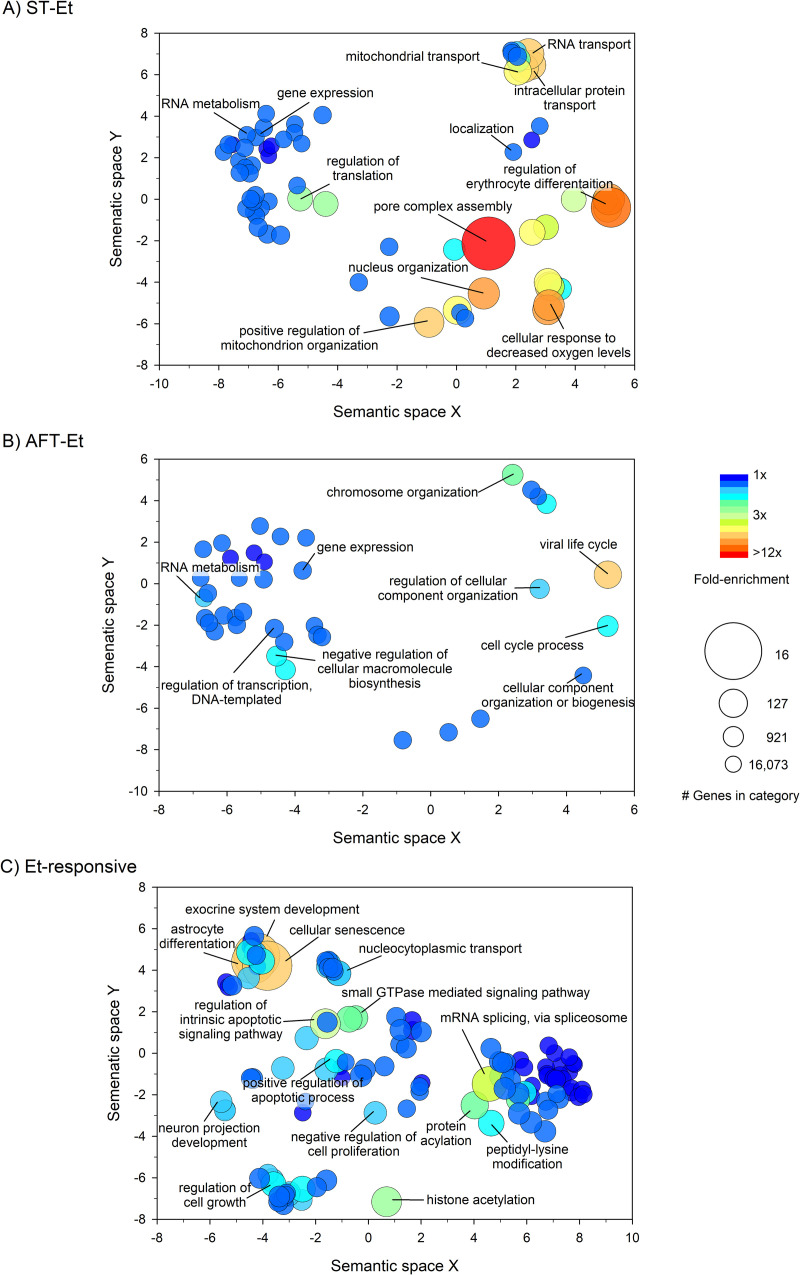
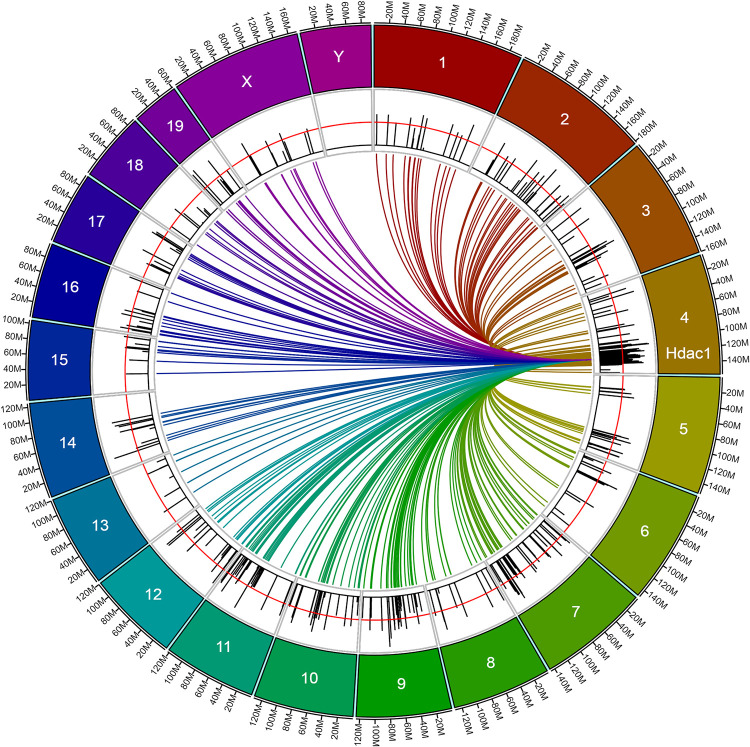
We have been using the Inbred Long- and Short-Sleep mouse strains (ILS, ISS) and a recombinant inbred panel derived from them, the LXS, to investigate the genetic underpinnings of acute ethanol tolerance which is considered to be a risk factor for alcohol use disorders (AUDs). Here, we have used RNA-seq to examine the transcriptome of whole brain in 40 of the LXS strains 8 hours after a saline or ethanol "pretreatment" as in previous behavioral studies. Approximately 1/3 of the 14,184 expressed genes were significantly heritable and many were unique to the pretreatment. Several thousand cis- and trans-eQTLs were mapped; a portion of these also were unique to pretreatment. Ethanol pretreatment caused differential expression (DE) of 1,230 genes. Gene Ontology (GO) enrichment analysis suggested involvement in numerous biological processes including astrocyte differentiation, histone acetylation, mRNA splicing, and neuron projection development. Genetic correlation analysis identified hundreds of genes that were correlated to the behaviors. GO analysis indicated that these genes are involved in gene expression, chromosome organization, and protein transport, among others. The expression profiles of the DE genes and genes correlated to AFT in the ethanol pretreatment group (AFT-Et) were found to be similar to profiles of HDAC inhibitors. Hdac1, a cis-regulated gene that is located at the peak of a previously mapped QTL for AFT-Et, was correlated to 437 genes, most of which were also correlated to AFT-Et. GO analysis of these genes identified several enriched biological process terms including neuron-neuron synaptic transmission and potassium transport. In summary, the results suggest widespread genetic effects on gene expression, including effects that are pretreatment-specific. A number of candidate genes and biological functions were identified that could be mediating the behavioral responses. The most prominent of these was Hdac1 which may be regulating genes associated with glutamatergic signaling and potassium conductance.
Conflict of interest statement
The authors have declared that no competing interests exist.
Figures
Similar articles
-
Quantitative trait locus mapping of acute functional tolerance in the LXS recombinant inbred strains.Alcohol Clin Exp Res. 2015 Apr;39(4):611-20. doi: 10.1111/acer.12678. Alcohol Clin Exp Res. 2015. PMID: 25833023 Free PMC article.
-
Quantitative trait locus mapping for acute functional tolerance to ethanol in the L x S recombinant inbred panel.Alcohol Clin Exp Res. 2007 Feb;31(2):200-8. doi: 10.1111/j.1530-0277.2006.00296.x. Alcohol Clin Exp Res. 2007. PMID: 17250610
-
Genetic studies of acute tolerance, rapid tolerance, and drinking in the dark in the LXS recombinant inbred strains.Alcohol Clin Exp Res. 2013 Dec;37(12):2019-28. doi: 10.1111/acer.12188. Epub 2013 Jul 24. Alcohol Clin Exp Res. 2013. PMID: 23889059 Free PMC article.
-
[Epigenetic mechanisms and alcohol use disorders: a potential therapeutic target].Biol Aujourdhui. 2017;211(1):83-91. doi: 10.1051/jbio/2017014. Epub 2017 Jul 6. Biol Aujourdhui. 2017. PMID: 28682229 Review. French.
-
Gene expression in animals with different acute responses to ethanol.Addict Biol. 2005 Mar;10(1):63-9. doi: 10.1080/13556210412331308985. Addict Biol. 2005. PMID: 15849020 Review.
Cited by
-
Modeling Brain Gene Expression in Alcohol Use Disorder with Genetic Animal Models.Curr Top Behav Neurosci. 2023 Nov 21:10.1007/7854_2023_455. doi: 10.1007/7854_2023_455. Online ahead of print. Curr Top Behav Neurosci. 2023. PMID: 37982929 Free PMC article.
References
Publication types
MeSH terms
Substances
Grants and funding
LinkOut - more resources
Full Text Sources
Molecular Biology Databases
Miscellaneous
