. 2020 Nov 12;183(4):1117-1133.e19.
doi: 10.1016/j.cell.2020.09.048. Epub 2020 Oct 22.

Detecting Tumor Antigen-Specific T Cells via Interaction-Dependent Fucosyl-Biotinylation

Affiliations

Detecting Tumor Antigen-Specific T Cells via Interaction-Dependent Fucosyl-Biotinylation

Zilei Liu et al. Cell. .

Abstract

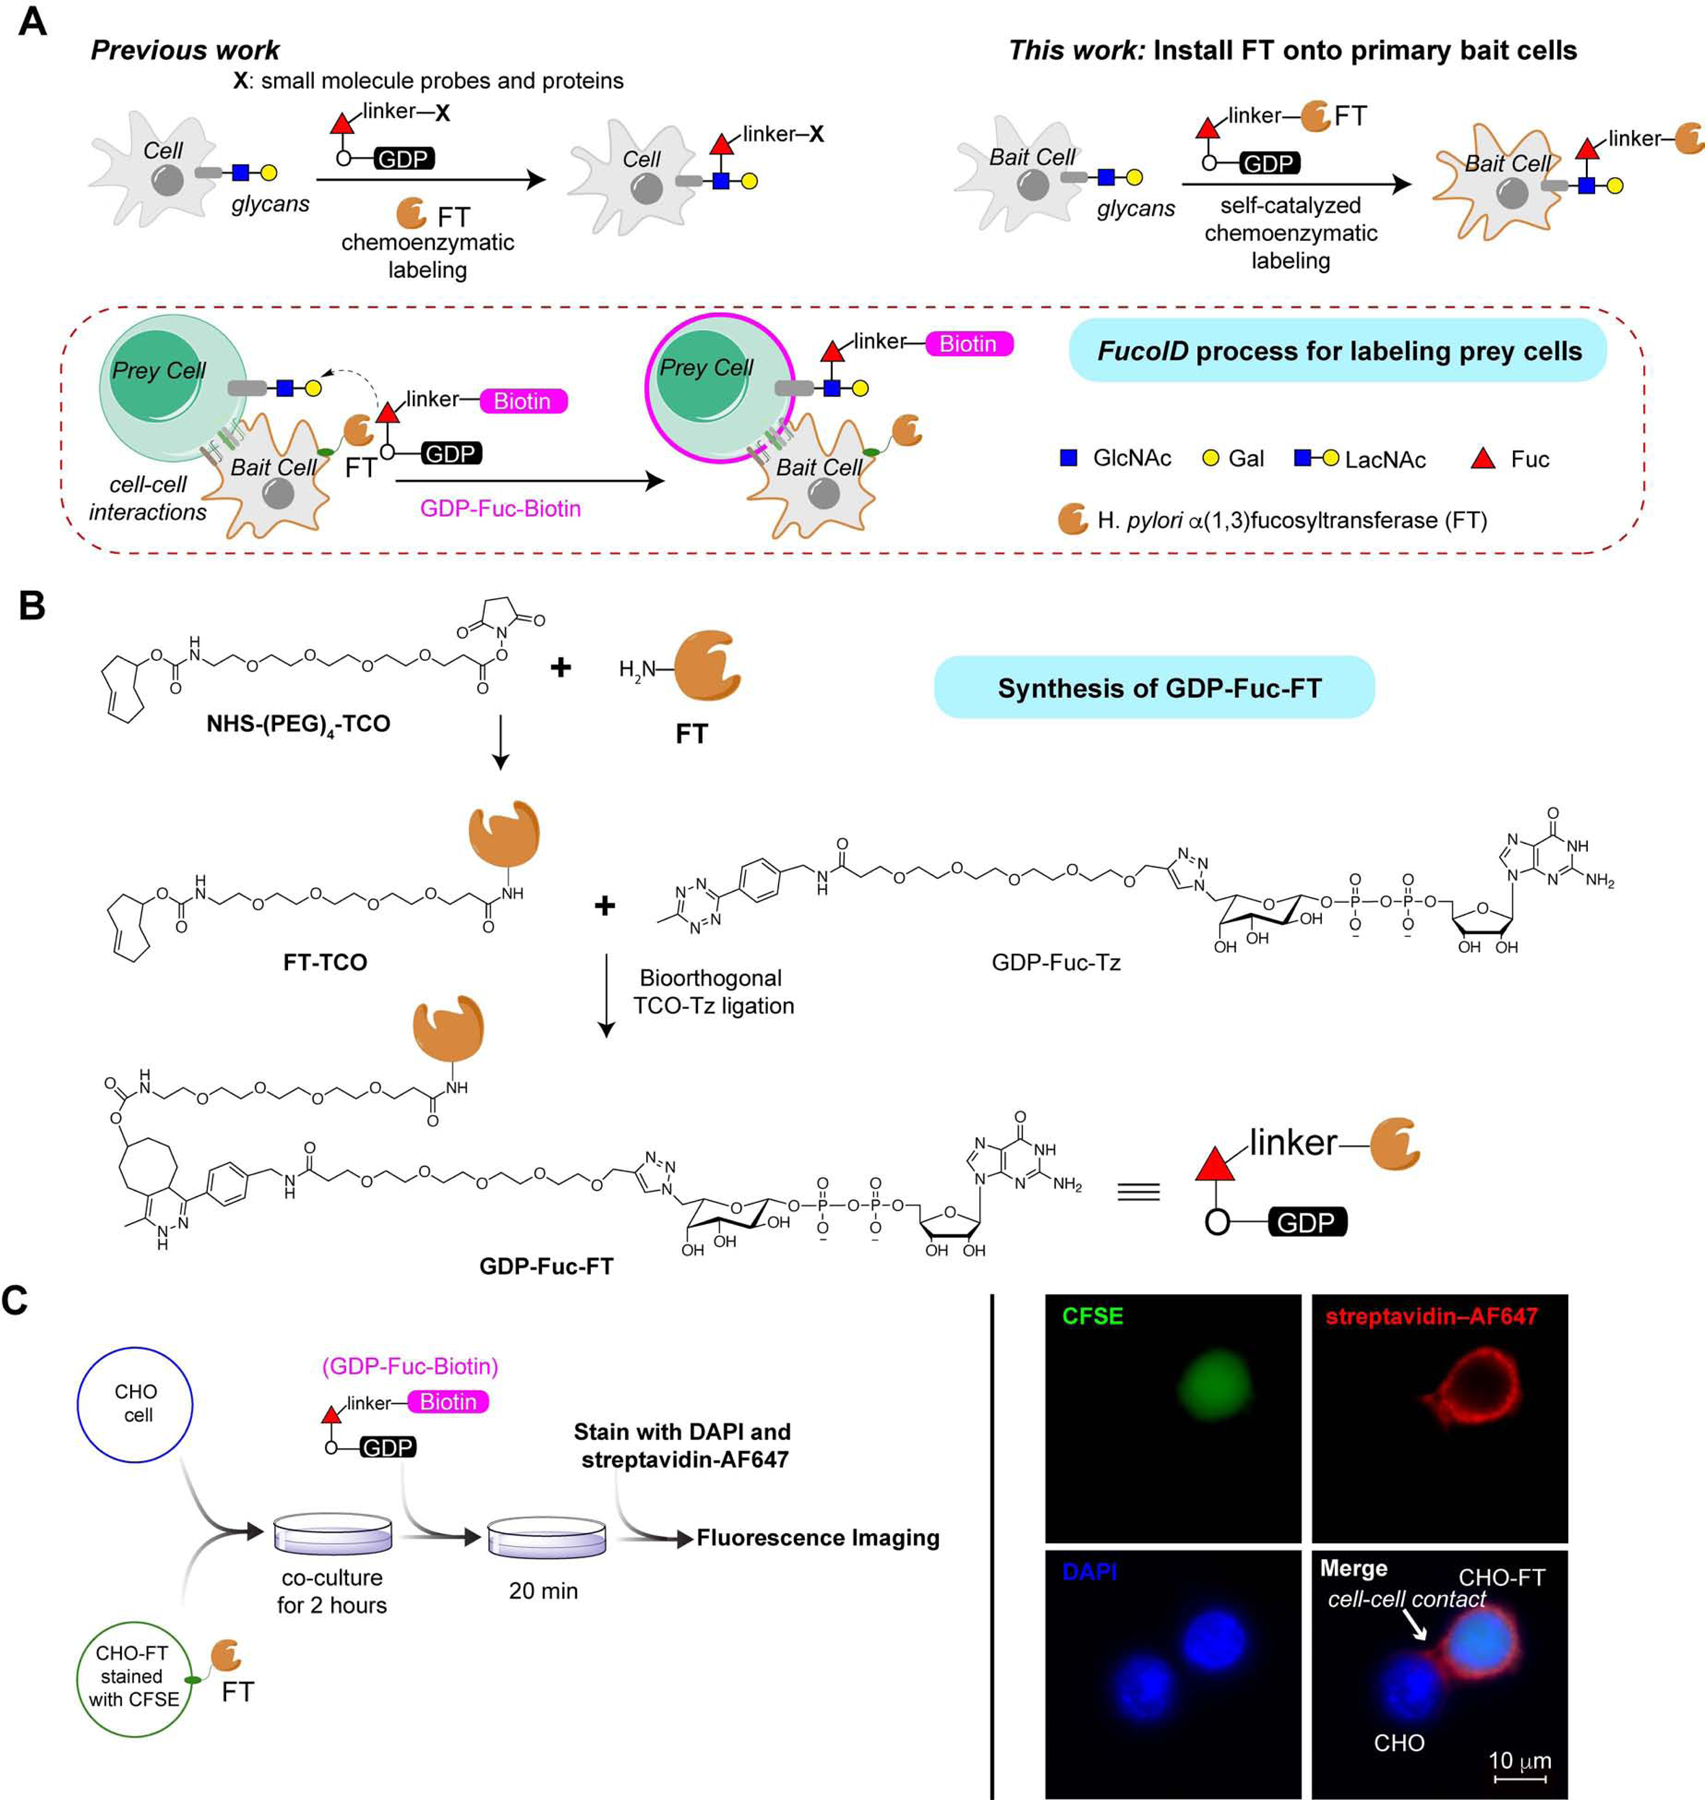
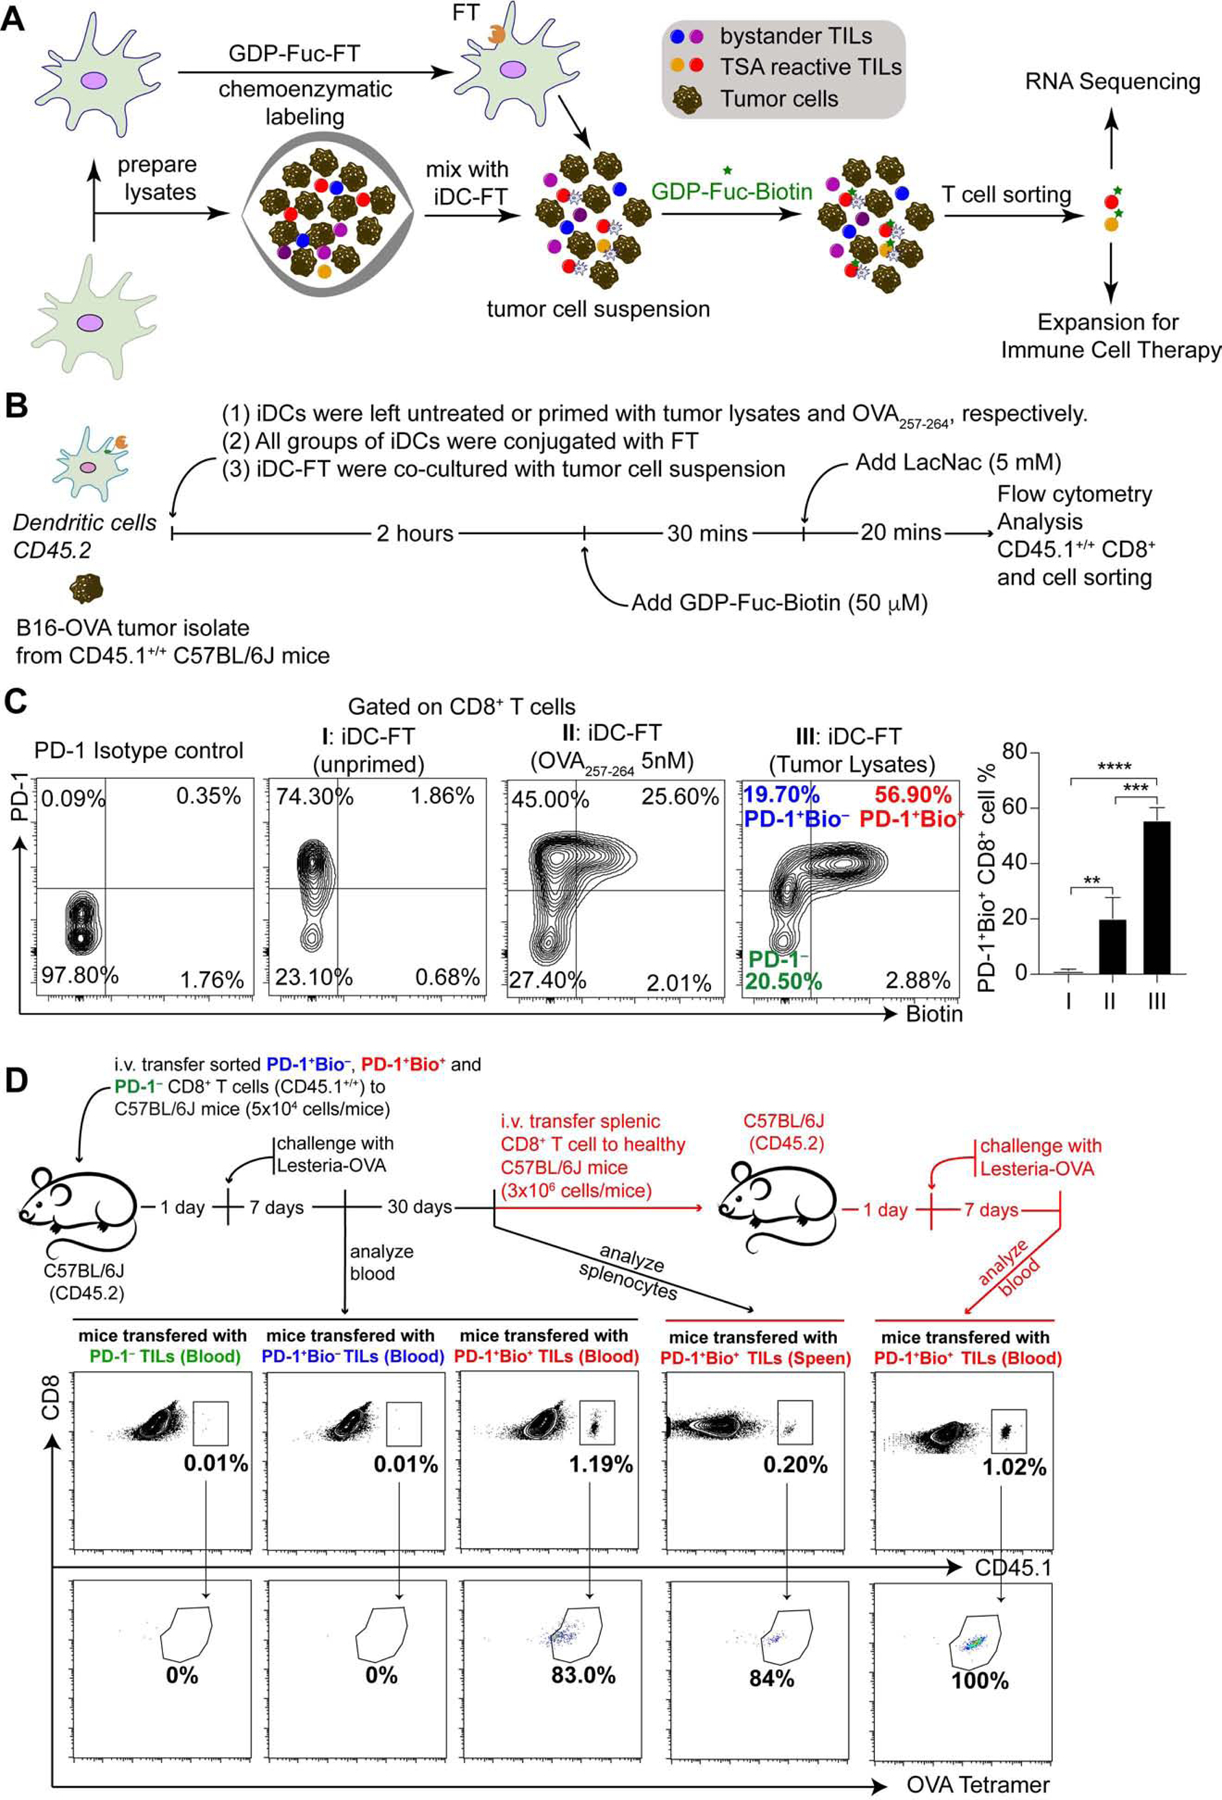
Re-activation and clonal expansion of tumor-specific antigen (TSA)-reactive T cells are critical to the success of checkpoint blockade and adoptive transfer of tumor-infiltrating lymphocyte (TIL)-based therapies. There are no reliable markers to specifically identify the repertoire of TSA-reactive T cells due to their heterogeneous composition. We introduce FucoID as a general platform to detect endogenous antigen-specific T cells for studying their biology. Through this interaction-dependent labeling approach, intratumoral TSA-reactive CD4+, CD8+ T cells, and TSA-suppressive CD4+ T cells can be detected and separated from bystander T cells based on their cell-surface enzymatic fucosyl-biotinylation. Compared to bystander TILs, TSA-reactive TILs possess a distinct T cell receptor (TCR) repertoire and unique gene features. Although exhibiting a dysfunctional phenotype, TSA-reactive CD8+ TILs possess substantial capabilities of proliferation and tumor-specific killing. Featuring genetic manipulation-free procedures and a quick turnover cycle, FucoID should have the potential of accelerating the pace of personalized cancer treatment.

Keywords: TCR sequencing; antigen-specific T cell; bystander T cell; cancer; cell-cell interaction; glycosylation; immunotherapy.


Conflict of interest statement

Declaration of Interests Z.L., J.P.L., J.R.T., and P.W. are listed as inventors on a patent application filed on June 3, 2019 (U.S. Patent Application 62/856,551). All experiments were performed at Scripps Research, La Jolla, CA.

Figures

Figure 1.
Figure 1.. Illustration of probing cell-cell interactions via interaction dependent fucosyl-biotinylation (FucoID).
(A) Schematic representation of FucoID for the labeling of cell-cell interactions. Conjugation of H. pylori α(1,3)fucosyltransferase (FT) onto the bait cell surface was achieved via the FT-mediated chemoenzymatic glycan labeling using GDP-Fuc-FT as a self-catalyst. (B) Synthesis of GDP-Fuc-FT. (C) Experimental design and representative fluorescence microscopy images of the interaction dependent labeling mediated by FT-functionalized CHO cells (CHO-FT). CHO-FT cells stained with CFSE were mixed (cell ratio 1:5) with unfunctionalized CHO cells, followed by the addition of GDP-Fuc-Biotin (50 μM). Cells were stained with DAPI and streptavidin-APC for fluorescent microscopy imaging. Scale bar: 10 μm.
Figure 2.
Figure 2.. Demonstration of the specificity of FucoID in probing DC-T cell interactions.
(A) Workflow for analyzing the FucoID enabled labeling of naïve OT-I CD8+ T cells using LCMV GP33–41 and OVA257–264 primed iDCs. (B) Flow cytometric analysis showing antigen-specific fucosyl-biotinylation of CD8+ T cells under iDC:T ratio of 1:1. (C) Flow cytometric analysis of antigen-specific fucosyl-biotinylation in the mixture of OT-I and P14 CD8+ T cells when incubated with iDC-FT primed with LCMV GP33–41 or OVA257–264, n=3.
Figure 3.
Figure 3.. Probing antigen-specific DC-T cell interactions via FucoID in splenocytes.
(A) Workflow for analyzing the interactions of antigen-primed iDCs with naïve OT-I T cells in OT-I splenocytes. (B) Flow cytometric analysis of antigen-specific fucosyl-biotinylation of CD8+ T cells in OT-I splenocytes by iDC-FT loaded with OVA257–264 at the iDC:T cell ratio = 1:1. (C) Flow cytometric analysis of OT-I T cells selective labeling in C57BL/6J splenocytes (doped with OT-I splenocytes, OT-I T cells at a final ratio of 2% in total cells) by iDC-FT. (D) Flow cytometric analysis of OT-I CD8+ T cells Fuc-biotinylation by iDC-FT loaded with altered peptide ligands (APLs) derived from the original OT-I peptide SIINFEKL N4 (OVA257–264). (E) Flow cytometric analysis of CD4+ T cells specific fucosyl-biotinylation by iDC-FT primed with OVA323–339 in OT-II splenocytes (iDC:T ratio = 1:1), n=3.
Figure 4.
Figure 4.. Identification and characterization of endogenous TSA-reactive CD8+ T cells from a B16-OVA melanoma model.
(A) Schematic illustration of the detection and enrichment of TSA-reactive TILs via FucoID. (B) Workflow of using FucoID to identify TSA-reactive and bystander CD8+ TILs from a B16-OVA tumor. (C) Representative flow cytometric analysis of TSA-dependent fucosyl-biotinylation of CD8+ TILs in B16-OVA tumors, n=3. (D) Experimental scheme for validating the isolated PD-1+Bio+ TILs as bona fide TSA-reactive T cells. Three isolated TIL subsets (CD45.1+/+) were transferred to normal C57BL/6 mice (CD45.2), immunized with LM-OVA on the next day. Blood and splenocytes were analyzed after another 7 and 37 days, respectively. The isolated splenic CD8+ T cells were re-transferred to C57BL/6 mice (CD45.2), immunized with LM-OVA on the next day, and blood was analyzed after another 7 days. Representative flow cytometry plots are from three biological replicates. See also Figure S4B and C.
Figure 5.
Figure 5.. Identification and characterization of TSA-reactive and bystander CD8+ T cells in distinct murine tumor models.
(A) Workflow for the detection of TSA-reactive CD8+ T cells from syngeneic murine tumor models via FucoID. (B) Representative flow cytometric analysis of tumor antigen dependent fucosyl-biotinylation of CD8+ TILs in B16 melanoma, E0771 TNBC and MC38 colon cancer models, n=3. (C) IFN-γ ELISpot showing distinct reactivity of expanded PD-1, PD-1+Bio and PD-1+Bio+ CD8+ TILs upon tumor antigen re-stimulation, n=3; (D) Comparisons of the expanded total PD-1+ CD8+ TILs and PD-1+Bio+ CD8+ TILs for inducing specific lysis of the relevant cancer cells; n=3. (E) In vivo antitumor immunity evaluation of PD-1+Bio+ and PD-1+ CD8+ TILs in a murine B16 metastasis tumor model. C57BL/6J mice were intravenously injected with 0.5×10⁶ B16-luc cells. TIL transfer was performed as described in Method on day 3 of tumor inoculation. On day 8 of TIL transfer, luciferin was administrated, and light emission was recorded. Representative bioluminescence images are shown; HBSS: 7 mice; total PD-1+: 8 mice; PD-1+Bio+: 6 mice. (F) In vivo antitumor immunity evaluation of PD-1+Bio+ and PD-1+ CD8+ TILs in a murine MC38 s.c. tumor model. MC38 cells were s.c. injected into the right flanks of male C57BL/6J mice (0.5×10⁶ cells per mice). Mice were irradiated (5 Gy) on day 2 of tumor inoculation. Then TIL transfer was performed on day 3 of tumor inoculation. Tumor volumes were measured every 2 days. HBSS: 7 mice; anti-PD-1: 7 mice; total PD-1+: 7 mice; PD-1+Bio+: 8 mice.
Figure 6.
Figure 6.. Gene-expression and functional marker characterizations of CD8+ TIL subsets isolated via FucoID from MC38 tumors.
(A) PCA of the transcriptome of PD-1+Bio+ (red), PD-1+Bio (blue) and PD-1 (green) CD8+ TILs isolated from murine MC38 tumors. Dots represent samples of the three different populations (grouped by colors) from a total of three biological replicates (grouped by shapes). PCA 1 and 2 represents the largest source of variation. (B) Volcano plot of up- (red) and down-(blue) regulated genes between PD-1+Bio+ and PD-1+Bio TILs. Significance was determined as Benjamini–Hochberg FDR (p.adjust) < 0.05 and |log2(fold change)| ≥ 0.6. (C) Biological processes (GO terms) enriched in the up– and down–regulated genes identified in Figure 6B. (D) Gene set enrichment analysis (GSEA) of activation/dysfunction CD8 gene module (Singer et al., 2016) in the transcriptome of PD-1+Bio+ vs. that of PD-1+Bio CD8+ TILs. See also Figure S5 and Table S1. (E) GSEA of up- and down-regulated tumor specific CD8 gene signature (Schietinger et al., 2016) in the transcriptome of PD-1+Bio+ vs. that of PD-1+Bio CD8+ TILs. See also Figure S5 and Table S1. (F) The comparison of representative gene expression of PD-1+Bio+, PD-1+Bio and PD-1 CD8+ TILs. n=3. (G) The expression of PD-1, CD137, TIM-3, CD39 and CD103 in PD-1+Bio+, PD-1+Bio and PD-1 CD8+ TILs from murine MC38 tumor according to flow cytometric analysis. Data obtained from at least two independent replicates.
Figure 7.
Figure 7.. TSA-suppressive and -reactive CD4+ TILs play opposite roles in regulating the antitumor immunity of TSA-reactive CD8+ TILs in a Pan02 pancreatic cancer model.
(A) and (B) Flow cytometric analysis of tumor antigen-specific fucosyl-biotinylation of CD8+ TILs (A) and CD4+ TILs (B) in the Pan02 model. (C) Flow cytometric analysis of functional markers on Bio CD4+ TILs and Bio+ CD4+ TILs in Pan02 tumors. (D) IFN-γ ELISpot analysis of tumor-suppressive and -reactive functions of the isolated TIL subsets. Five subsets of TILs (Bio+ CD8+, Bio CD8+, CD25Bio+ CD4+, CD25+Bio+ CD4+ and Bio CD4+) isolated from Pan02 tumor digests were re-stimulated by DCs primed with tumor lysates. Re-stimulations were conducted using the individual TIL subsets and a combination of two subsets as specified, n=3.

Comment in

References

    1. Abelin JG, Keskin DB, Sarkizova S, Hartigan CR, Zhang W, Sidney J, Stevens J, Lane W, Zhang GL, Eisenhaure TM, et al. (2017). Mass Spectrometry Profiling of HLA-Associated Peptidomes in Mono-allelic Cells Enables More Accurate Epitope Prediction. Immunity 46, 315–326. - PMC - PubMed
    1. Ahmadzadeh M, Pasetto A, Jia L, Deniger DC, Stevanović S, Robbins PF, and Rosenberg SA (2019). Tumor-infiltrating human CD4+ regulatory T cells display a distinct TCR repertoire and exhibit tumor and neoantigen reactivity. Sci. Immunol 4, eaao4310. - PMC - PubMed
    1. Alspach E, Lussier DM, Miceli AP, Kizhvatov I, DuPage M, Luoma AM, Meng W, Lichti CF, Esaulova E, Vomund AN, et al. (2019). MHC-II neoantigens shape tumour immunity and response to immunotherapy. Nature 574, 696–701. - PMC - PubMed
    1. Arnaud M, Duchamp M, Bobisse S, Renaud P, Coukos G, and Harari A (2020). Biotechnologies to tackle the challenge of neoantigen identification. Curr. Opin. Biotechnol 65, 52–59. - PubMed
    1. Bensinger SJ, Bradley MN, Joseph SB, Zelcer N, Janssen EM, Hausner MA, Shih R, Parks JS, Edwards PA, Jamieson BD, et al. (2008). LXR signaling couples sterol metabolism to proliferation in the acquired immune response. Cell 134, 97–111. - PMC - PubMed

Publication types

MeSH terms

LinkOut - more resources