. 2020 Nov 9;38(5):672-684.e6.
doi: 10.1016/j.ccell.2020.09.014. Epub 2020 Oct 22.

Predicting Drug Response and Synergy Using a Deep Learning Model of Human Cancer Cells

Affiliations

Predicting Drug Response and Synergy Using a Deep Learning Model of Human Cancer Cells

Brent M Kuenzi et al. Cancer Cell. .

Abstract

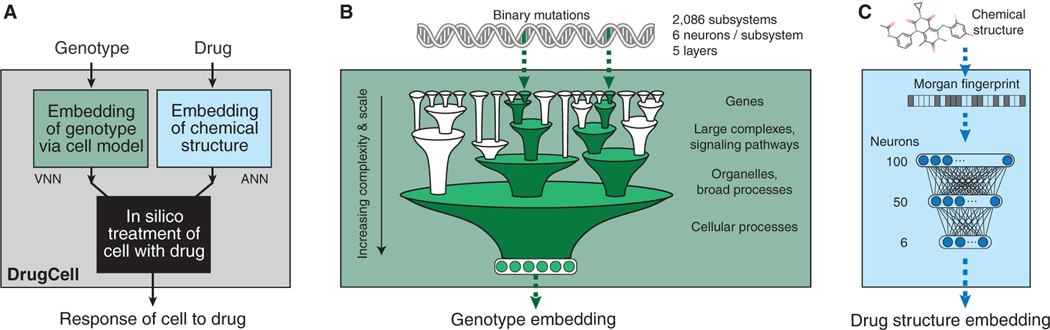
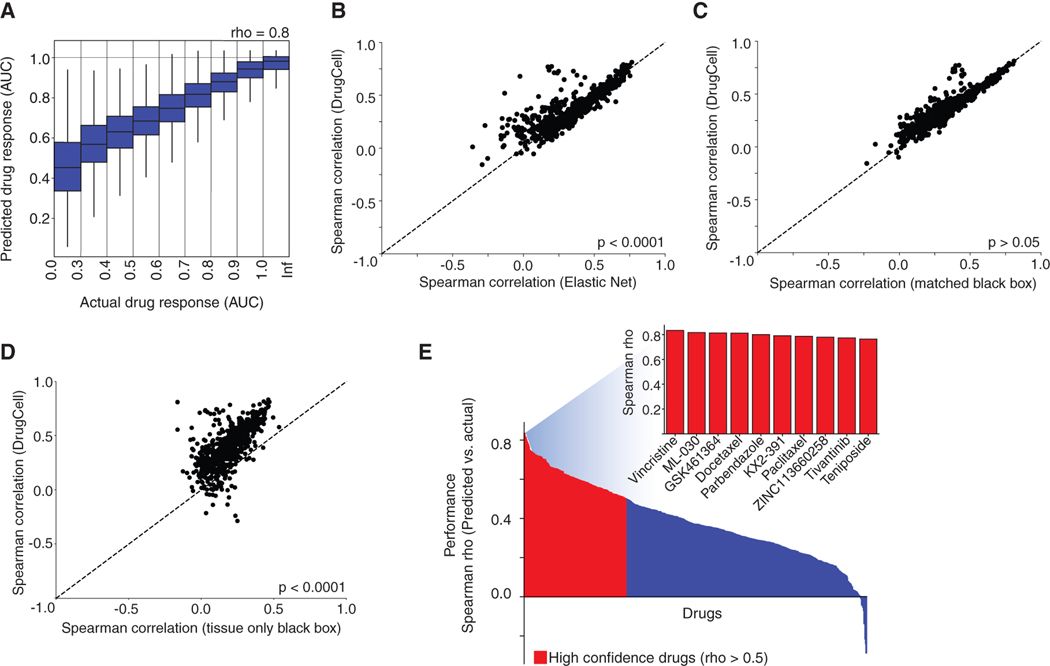
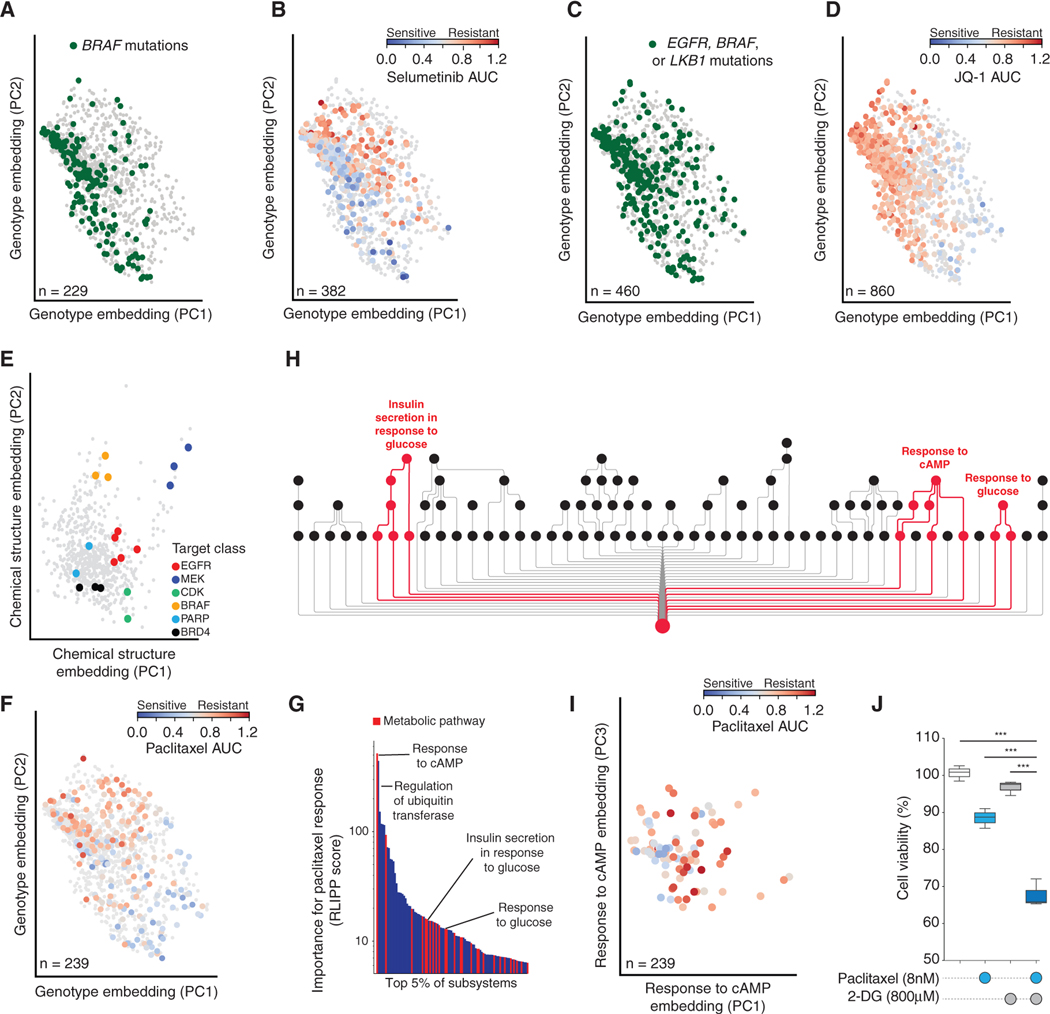
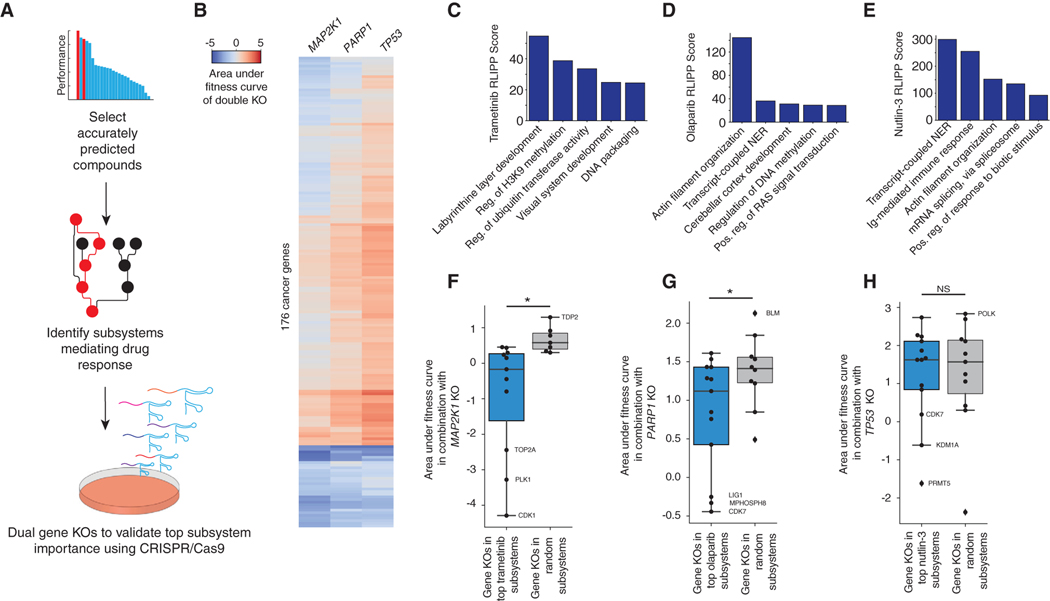
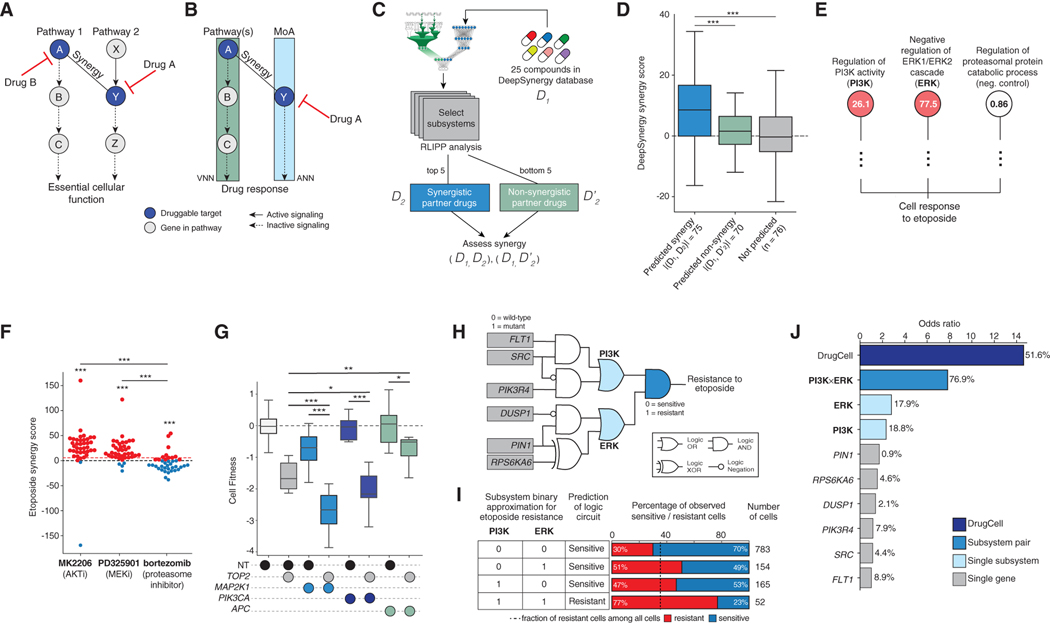
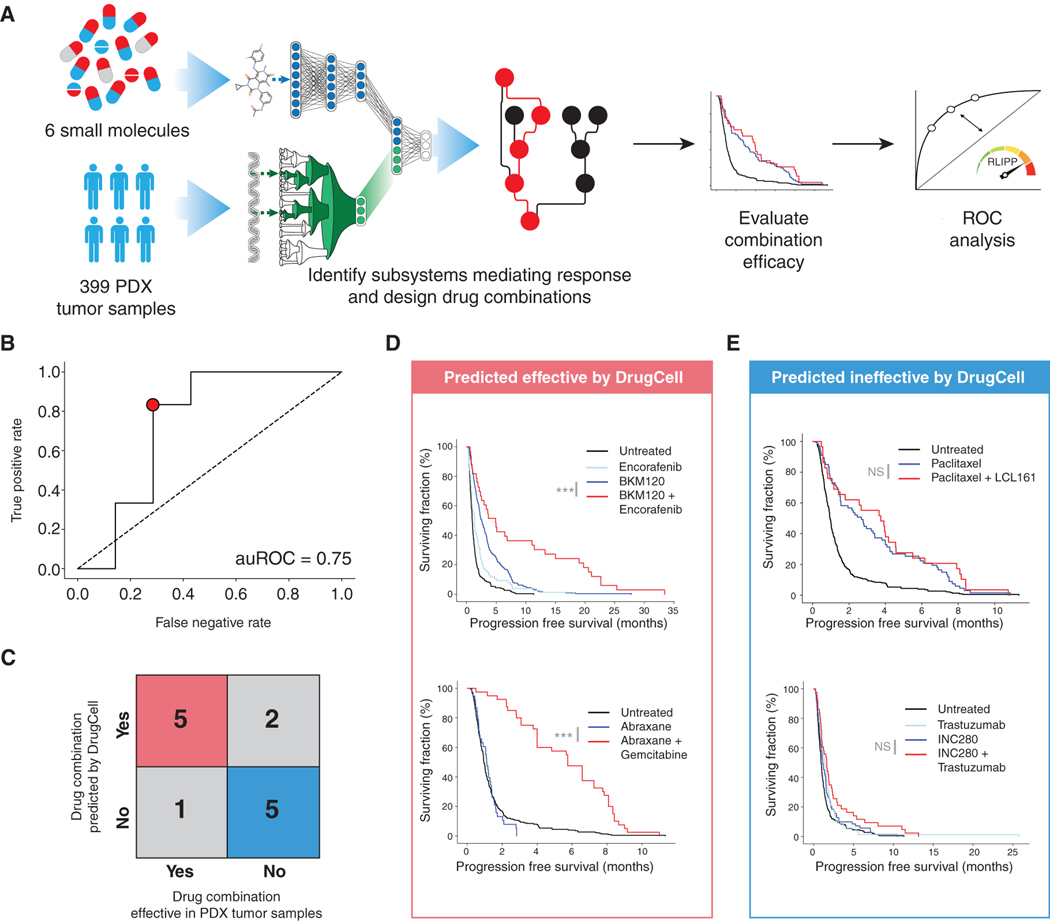
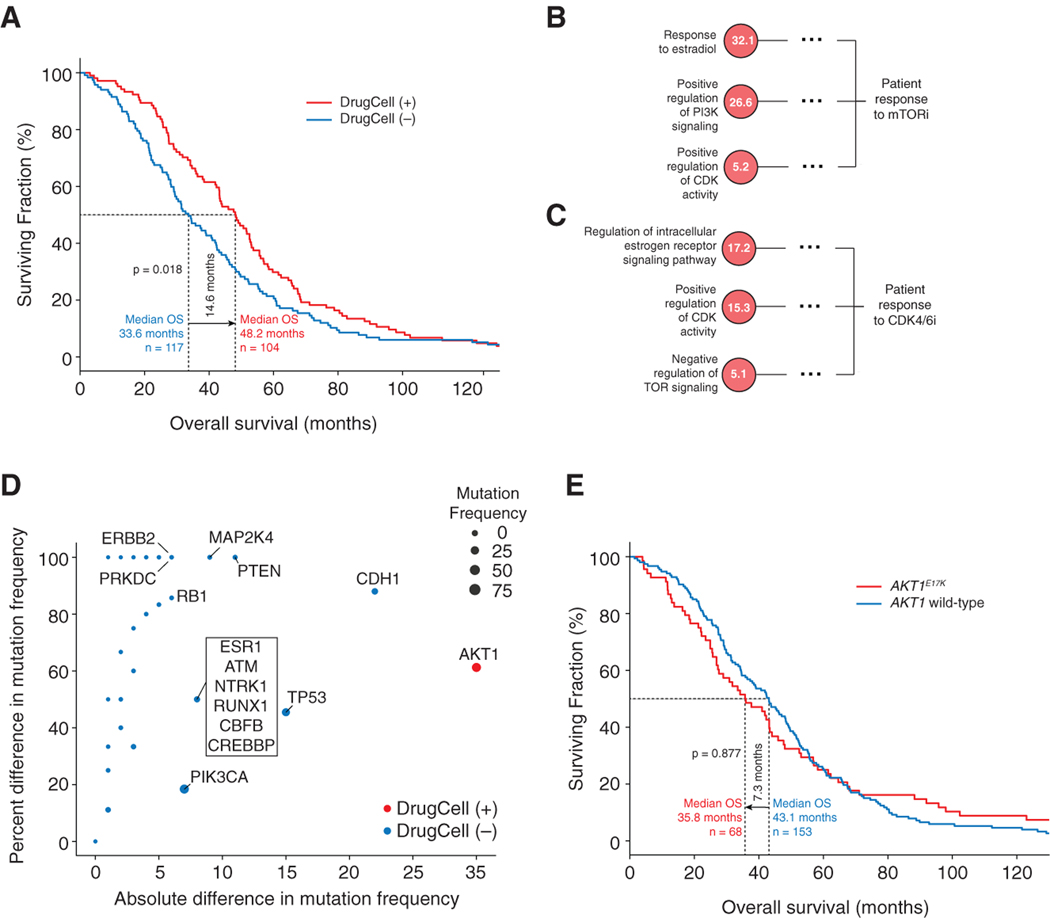
Most drugs entering clinical trials fail, often related to an incomplete understanding of the mechanisms governing drug response. Machine learning techniques hold immense promise for better drug response predictions, but most have not reached clinical practice due to their lack of interpretability and their focus on monotherapies. We address these challenges by developing DrugCell, an interpretable deep learning model of human cancer cells trained on the responses of 1,235 tumor cell lines to 684 drugs. Tumor genotypes induce states in cellular subsystems that are integrated with drug structure to predict response to therapy and, simultaneously, learn biological mechanisms underlying the drug response. DrugCell predictions are accurate in cell lines and also stratify clinical outcomes. Analysis of DrugCell mechanisms leads directly to the design of synergistic drug combinations, which we validate systematically by combinatorial CRISPR, drug-drug screening in vitro, and patient-derived xenografts. DrugCell provides a blueprint for constructing interpretable models for predictive medicine.

Keywords: cancer; drug synergy; interpretable deep learning; machine learning; network modeling; precision medicine.


Conflict of interest statement

Declaration of Interests T.I. is a co-founder of Data4Cure, Inc., and has an equity interest. T.I. has an equity interest in Ideaya BioSciences, Inc. The terms of this arrangement have been reviewed and approved by the University of California San Diego in accordance with its conflict of interest policies.

Figures

Figure 1.
Figure 1.. DrugCell Design
(A) DrugCell uses a modular neural network design that combines conventional artificial neural networks (ANN) with a visible neural network (VNN) to make drug response predictions. (B) Binary encodings of individual genotypes are processed through a VNN with architecture guided by a hierarchy of cell subsystems, with multiple neurons assigned per subsystem. (C) Compound chemical structures are processed through an ANN using the Morgan fingerprint as input features.
Figure 2.
Figure 2.. Predictive Performance
(A) Predicted versus actual drug responses across all (cell line, drug) pairs studied. Box plots show the 25th, 50th, and 75th percentiles of values in each bin; whiskers show maximum and minimum values. (B–D) Scatterplots of the predictive performance (Spearman rho between actual and predicted drug response across 684 drugs) of DrugCell versus three alternative models: (B) elastic net, (C) matched black-box neural network, and (D) tissue-only black-box neural network. Points represent individual drugs; points above the diagonal represent drugs better predicted by DrugCell. (E) Waterfall plot of predictive performance for each drug in the dataset (y axis), ranked from highest to lowest (x axis). “High confidence” drugs are highlighted in red (rho > 0.5). The inset shows the performance for the top 10 best predicted drugs.
Figure 3.
Figure 3.. Characterization of Cancer Cell States Learned by DrugCell
(A–D) Genotype embeddings of each cell line, showing the first two principal components (PC). Points are cell lines, with colors indicating specific drug responses or genetic markers according to the panel. (A and C) Green denotes cell lines harboring mutations in BRAF or in EGFR, BRAF, or LKB1, respectively. Gray denotes cell lines without mutations in these genes. (B and D) Blue-to-red gradient represents the response to selumetinib or JQ-1, respectively. Gray denotes cell lines not tested against that drug. (E) Drug structure embedding. Points are drugs, with colors indicating drug target classes. (F) Genotype embeddings of each cell line as in (A–D), but with blue-to-red gradient representing response to paclitaxel. (G) Waterfall plot of top 5% of subsystems (x axis) important for paclitaxel response by RLIPP score (y axis). Subsystems capturing metabolic pathways are highlighted in red. (H) Visualization of select subsystems highlighted in (G), comprising a sub-hierarchy of the full DrugCell model. Red is used to trace the branches of the hierarchy related specifically to regulation of glycolysis. (I) Response to cAMP subsystem embedding. Points are cell lines, blue-to-red gradient represents response to paclitaxel. (J) Boxplot of the relative cell viability of treatment with DMSO, paclitaxel, 2-deoxyglucose (2-DG), or the combination at the indicated concentrations in A427 cells. Data are representative of drug treatments performed in biological and technical triplicates. The boxes represent the interquartile range (IQR) bisected by the median, whiskers represent the maximum and minimum range of the data that do not exceed 1.5 times the IQR. ***p < 0.0001 from a t test.
Figure 4.
Figure 4.. Systematic Validation of Identified Mechanisms of Sensitivity Using CRISPR/Cas9
(A) Workflow of systematic analysis using CRISPR/Cas9. (B) Heatmap of the area under the fitness curves for 176 cancer genes in combination with MAP2K1, PARP1, and TP53. (C–E) Bar plots of the RLIPP scores of the top five subsystems for (C) trametinib, (D) olaparib, and (E) nutlin-3. (F–H) Boxplots of the area under the fitness curve following CRISPR/Cas9-mediated knockout of (F) MAP2K1, (G) PARP1, and (H) TP53 in combination with highly weighted genes within the top five subsystems identified by DrugCell for each parent drug compared with random. Select genes are labeled. The boxes represent the IQR bisected by the median, and whiskers represent the maximum and minimum range of the data that do not exceed 1.5 times the IQR. *p < 0.05 from a t test, NS denotes not significant.
Figure 5.
Figure 5.. Discovery and Validation of Synergistic Mechanisms
(A) Parallel pathway theory of drug synergy, in which a pathway 2 is targeted by the mechanism of action (MoA) of drug A, and synergy is achieved by simultaneously targeting parallel pathway 1 with drug B. (B) Logic learned by DrugCell for drug A, in which pathway 1 arises as a predicted mechanism of the VNN. (C) Workflow demonstrating systematic design and assessment of pairwise combinations of drugs. (D) Boxplots of DeepSynergy synergy scores for predicted drug combinations, predicted non-synergistic combinations, and random combinations. The boxes represent the IQR bisected by the median, and whiskers represent the maximum and minimum range of the data that do not exceed 1.5 times the IQR. ***p < 0.0001. (E) Representative subsystems used by DrugCell to simulate etoposide sensitivity (red nodes), along with a negative control branch (white node). RLIPP scores are displayed inside each node. Subsystem names are abbreviated. (F) Bee swarm plot of the Loewe synergy scores observed upon combination of etoposide with MK2206, PD325901, or bortezomib. Drug combinations were chosen based on subsystems identified in (E). Red dotted line indicates the mean of all Loewe synergy scores in the dataset (Figure S6). ***p <0.0001. *** without bars represent t test against the synergy score distribution of the full dataset (Figure S6), or bortezomib negative control, as indicated. Red points are cell lines for which synergy is observed. Blue points are cell lines for which antagonism is observed. (G) Boxplots of the relative cell growth of A549 cells following CRISPR/Cas9-mediated knockout of MAP2K1, PIK3CA, or APC (negative control) in combination with TOP2 or a non-targeting control (NT). Data are reflective of two independent transductions. ***p <0.0001, *p <0.1, **p <0.01. (H) Boolean logic circuit approximating how the mutational status of genes in the PI3K and ERK subsystems is translated to an etoposide response by DrugCell. (I) Truth table showing translation of PI3K and ERK states to a binary drug response output. The percentage of observed sensitive versus resistant cells for each state is shown. Dotted line indicates baseline percentage of etoposide-resistant samples among all cell lines. (J) Odds ratios of etoposide response prediction for DrugCell, the ERK and PI3K logic functions from (H), and individual genes from (H). Percentages of cell lines with an alteration to that biomarker are also shown. Odds ratios are against a background of cell lines that are wild type with respect to this circuit.
Figure 6.
Figure 6.. Guiding Combination Therapy in Patient-Derived Xenograft Tumors
(A) Flowchart of analysis procedure. (B) ROC curve of DrugCell performance in distinguishing effective from ineffective drug combinations. (C) Error matrix for point indicated in (B) demonstrating best performance of DrugCell against the PDX dataset. (D) Survival curves for drug combinations predicted to be effective by DrugCell (true positives) showing a significant improvement in progression-free survival. (E) Survival curves for drug combinations predicted to be ineffective by DrugCell (true negatives) showing a lack of improvement in progression-free survival. p values indicate significance by log rank test. ***p <0.0001, NS indicates not significant.
Figure 7.
Figure 7.. Guiding CDK4/6 and mTOR Inhibitor Therapy in ER-Positive Breast Cancer Patients
(A–C) (A) Survival curves for DrugCell (+) and DrugCell (−) patients treated with CDK4/6 or mTOR inhibitors in any line of therapy. The p value indicates significance by log rank test. (B, C) Important subsystems used by DrugCell to simulate (B) mTOR or (C) CDK4/6 inhibitor sensitivity. Dotted line abbreviates parent subsystems at subsequent layers of the hierarchy. RLIPP scores are displayed inside each node. (D) Scatterplot of the absolute (x axis) and percentage (y axis) difference in mutation frequencies of genes between DrugCell (+) and DrugCell (−) patients. Red points represent genes mutated more frequently in DrugCell (+) patients. Blue points represent genes mutated more frequently in Drug-Cell (−) patients. Point size is proportional to overall mutation frequency in the patient population. (E) Survival curves for AKT1-mutant and wild-type patients treated with CDK4/6 or mTOR inhibitors in any line of therapy. The p value indicates significance by log rank test.

Comment in

References

    1. Ammad-ud-din M, Khan SA, Wennerberg K, and Aittokallio T (2017). Systematic identification of feature combinations for predicting drug response with Bayesian multi-view multi-task linear regression. Bioinformatics 33, i359–i368. - PMC - PubMed
    1. Ashburner M, Ball CA, Blake JA, Botstein D, Butler H, Cherry JM, Davis AP, Dolinski K, Dwight SS, Eppig JT, et al. (2000). Gene ontology: tool for the unification of biology. The Gene Ontology Consortium. Nat. Genet 25, 25–29. - PMC - PubMed
    1. Bani MR, Nicoletti MI, Alkharouf NW, Ghilardi C, Petersen D, Erba E, Sausville EA, Liu ET, and Giavazzi R (2004). Gene expression correlating with response to paclitaxel in ovarian carcinoma xenografts. Mol. Cancer Ther 3, 111–121. - PubMed
    1. Baptista D, Ferreira PG, and Rocha M (2020). Deep learning for drug response prediction in cancer. Brief. Bioinform bbz 171, 10.1093/bib/bbz171. - DOI - PubMed
    1. Barretina J, Caponigro G, Stransky N, Venkatesan K, Margolin AA, Kim S, Wilson CJ, Lehár J, Kryukov GV, Sonkin D, et al. (2012). The Cancer Cell Line Encyclopedia enables predictive modelling of anticancer drug sensitivity. Nature 483, 603–607. - PMC - PubMed

Publication types

Substances