. 2021 Jan 20;12(1):23-40.e7.
doi: 10.1016/j.cels.2020.10.003. Epub 2020 Oct 8.

Large-Scale Multi-omic Analysis of COVID-19 Severity

Affiliations

Large-Scale Multi-omic Analysis of COVID-19 Severity

Katherine A Overmyer et al. Cell Syst. .

Abstract

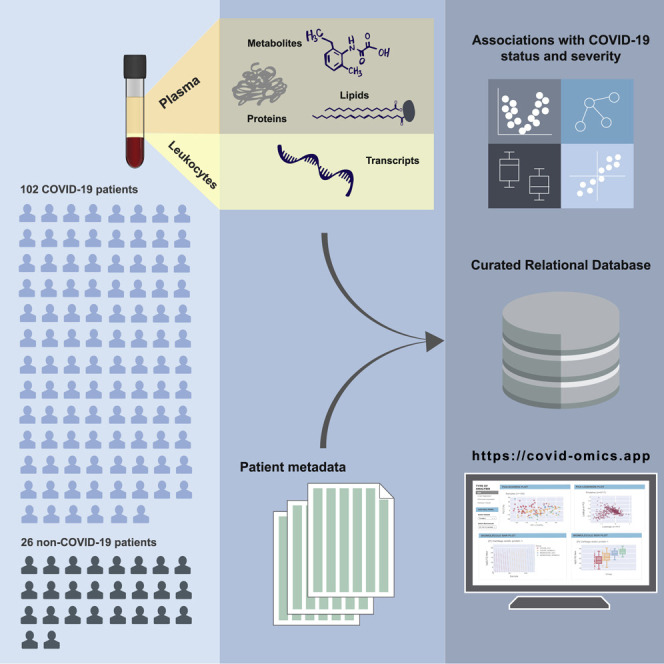
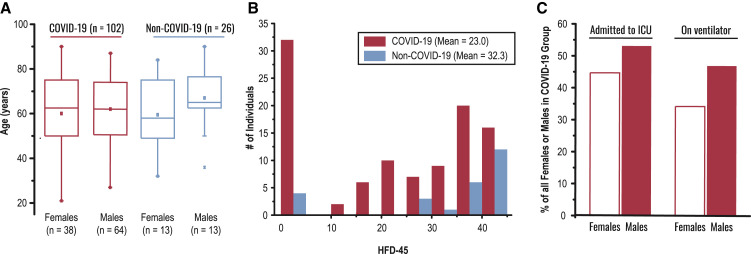
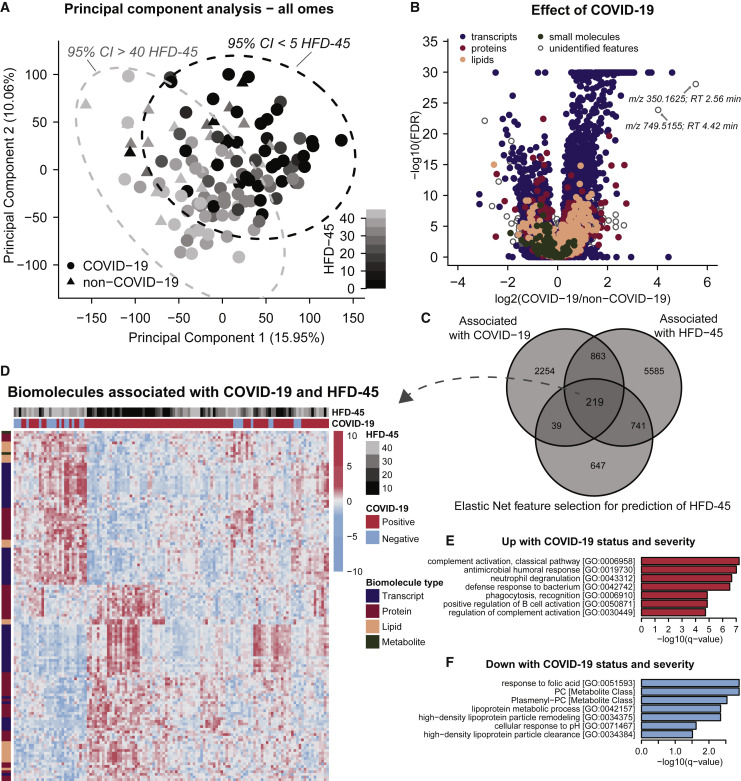
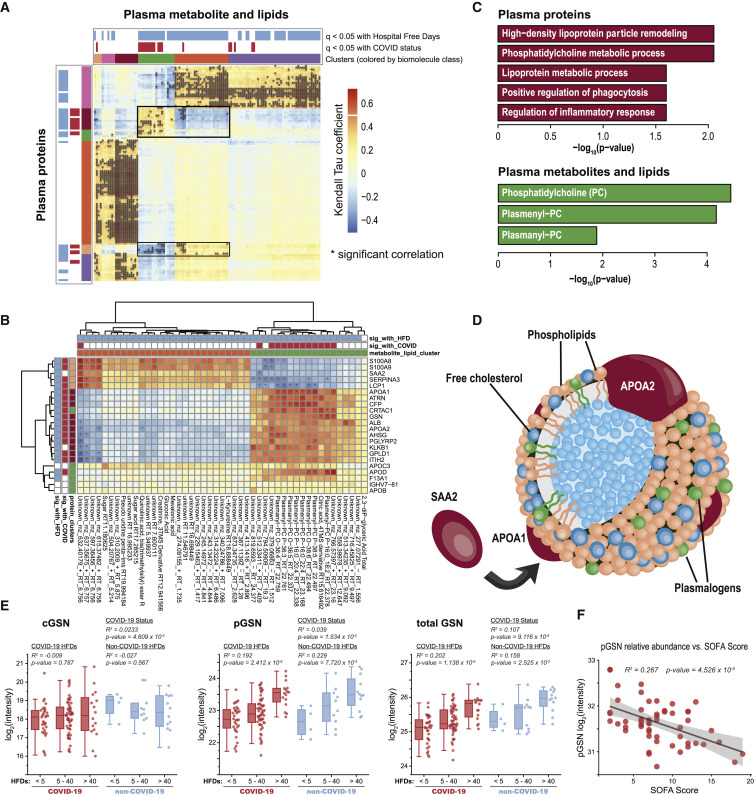
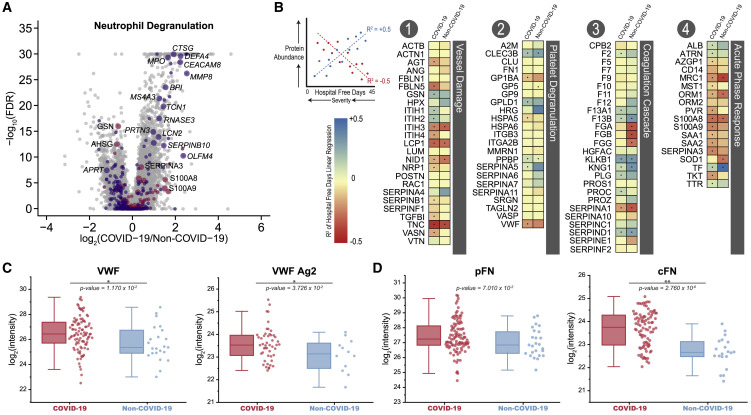
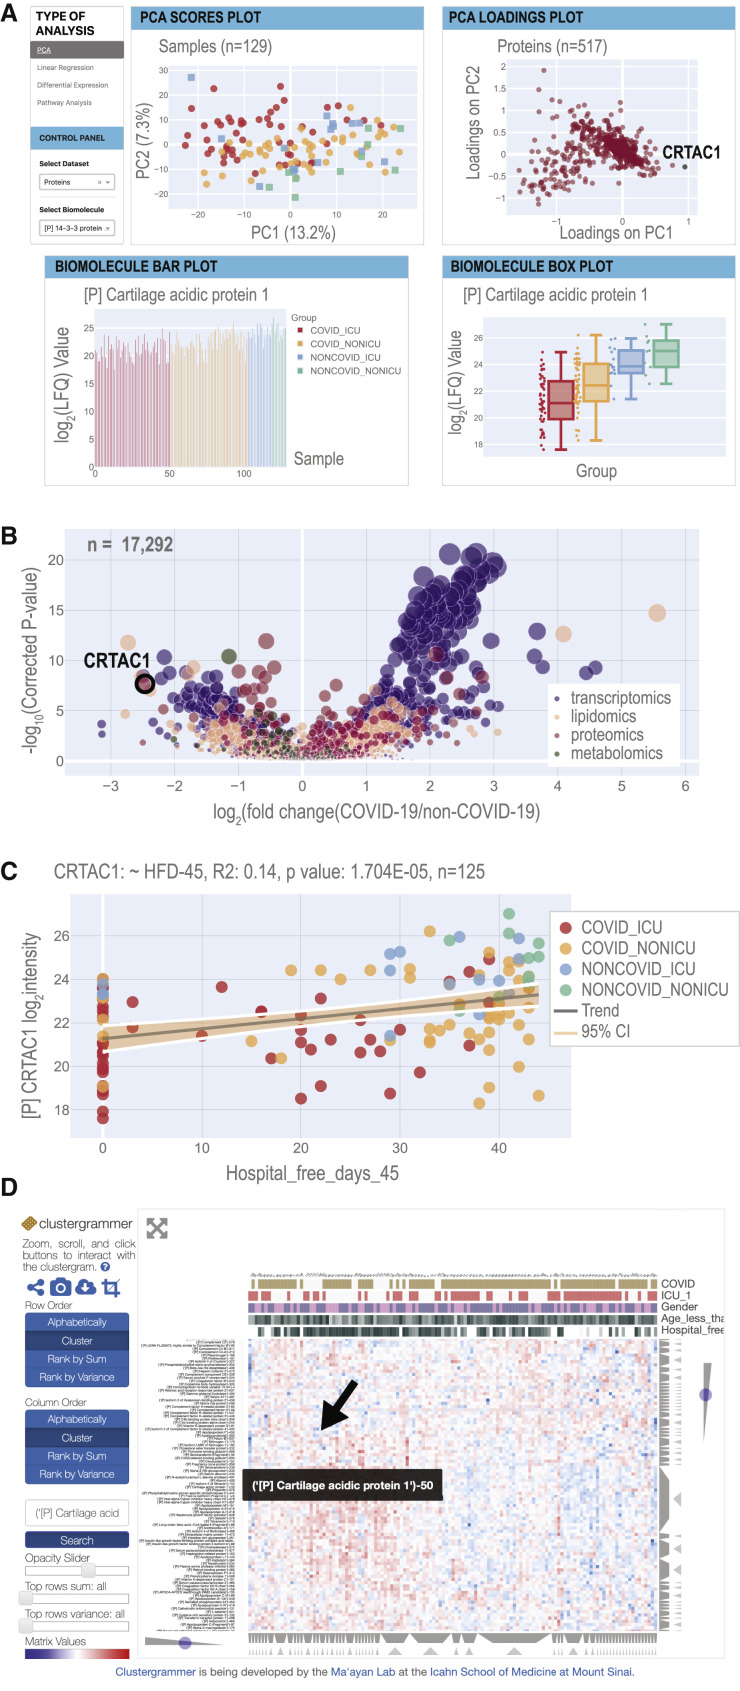
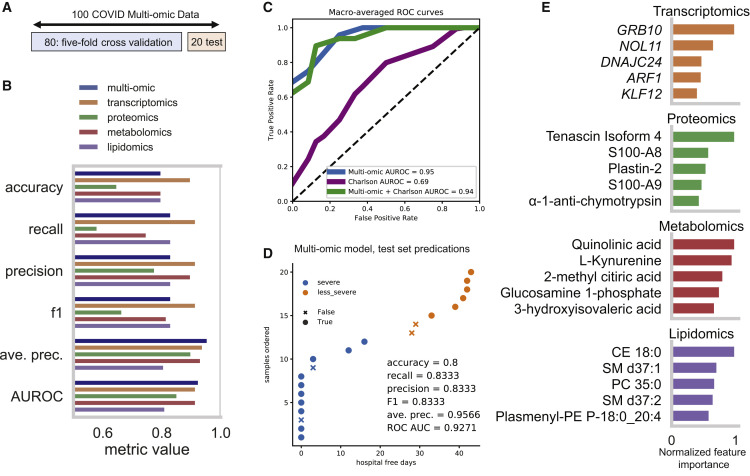
We performed RNA-seq and high-resolution mass spectrometry on 128 blood samples from COVID-19-positive and COVID-19-negative patients with diverse disease severities and outcomes. Quantified transcripts, proteins, metabolites, and lipids were associated with clinical outcomes in a curated relational database, uniquely enabling systems analysis and cross-ome correlations to molecules and patient prognoses. We mapped 219 molecular features with high significance to COVID-19 status and severity, many of which were involved in complement activation, dysregulated lipid transport, and neutrophil activation. We identified sets of covarying molecules, e.g., protein gelsolin and metabolite citrate or plasmalogens and apolipoproteins, offering pathophysiological insights and therapeutic suggestions. The observed dysregulation of platelet function, blood coagulation, acute phase response, and endotheliopathy further illuminated the unique COVID-19 phenotype. We present a web-based tool (covid-omics.app) enabling interactive exploration of our compendium and illustrate its utility through a machine learning approach for prediction of COVID-19 severity.

Keywords: ARDS; COVID-19; ICU; RNA sequencing; machine learning; mass spectrometry; multi-omics; outcomes; severity.


Conflict of interest statement

Declaration of Interests The authors declare no competing interests.

Figures

None
Graphical abstract
Figure 1
Figure 1
Overview of Sample Cohort and Experimental Design (A) Age and sex distributions of COVID-19 (n = 102) and non-COVID-19 (n = 26) groups; for each box, the middle horizontal line is at the median, and box margins are first and third quartiles, with vertical lines extending ± 1.5-times the interquartile range. (B) Distributions of hospital-free days over a continuous 45-day period aggregated with survival (HFD-45, see “Outcomes Selection” section in the STAR Methods) among COVID-19 and non-COVID-19 groups. (C) The proportion (%) of female and male patients that were admitted to the intensive care unit (ICU) and that required the support of a mechanical ventilator.
Figure 2
Figure 2
Multi-omics Analysis Reveals Strong Molecular Signatures Associated with COVID-19 Status and Severity (A) PCA using quantitative values from all omics data (leukocyte transcripts, and plasma proteins, lipids, and small molecules, log2 transformed and centered around 0, for n = 125 patient samples, also see STAR Methods) shows that principal components 1 and 2 capture 16% and 10%, respectively, of the variance between patient samples. Plotting samples by these two components show a linear trend with hospital-free days at 45 days (HFD-45). (B) Associations of biomolecules with COVID-19 status were determined using differential expression analysis (EB-seq) for transcripts and linear regression log-likelihood tests for plasma biomolecules (see Table S1). The adjusted p values (1 - posterior probability or Benjamini Hochberg-adjusted p values, respectively) are plotted relative to the log2 fold-change of mean values between COVID and non-COVID samples. In total, 2,537 leukocyte transcripts, 146 plasma proteins, 168 plasma lipids, and 13 plasma metabolites had adjusted p values < 0.05. (C) Associations between biomolecules and HFD-45 was estimated using a univariate linear regression (HFD-45 ~ biomolecule abundance + age + sex) resulting in 7,408 biomolecules significantly associated with HFD-45, see Table S1. A multivariate linear regression with elastic net penalty was applied to each omics dataset separately to further refine features of interest, and resulted in 946 features that were retained as coefficients predictive for HFD-45, also see Table S1. In total, 219 features were determined as most important for distinguishing COVID status and severity. (D) Abundance of the 219 features were visualized via a heatmap (Z scored by row) and clustered with hierarchical clustering. (E and F) Features that were elevated (E) or reduced (F) with COVID-19 status and severity were used for GO term and molecular class enrichment analysis (see Table S2).
Figure 3
Figure 3
Leveraging the Value of Multi-omic Data through Cross-ome Correlation Analysis (A) Hierarchical clustering of Kendall’s Tau coefficients calculated for correlations between abundances of proteins (rows) and small molecules (lipids and metabolites; columns) in the pairwise fashion, using data from n = 127 samples (also see Table S4). Significance of their association with HFD-45 and COVID-19 status is indicated above the biomolecule clusters, and significance of the correlation is denoted by , corresponding to adjusted p values < 0.05. (B) Re-clustering of biomolecules found in the clusters highlighted in panel-a with molecule annotations. (C) Enrichment analyses of protein GO terms (purple) and small molecule classes (green) present in the cluster in (B). (D) A schematic of a high-density lipoprotein (HDL) particle containing APOA1 and APOA2 proteins surrounded by various lipids, specifically plasmalogens. SAA2, also detected in the cluster in (B), can replace APOA1 within the particle. (E) Relative abundance measurements of plasma gelsolin (pGSN), cellular gelsolin (cGSN), and total gelsolin obtained using parallel reaction monitoring (PRM) on representative peptide sequences (see Table S5); p values based on linear regression are presented. For each box, the middle horizontal line is at the median, and box margins are first and third quartiles, with vertical lines extending ± 1.5-times the interquartile range. (F) Regression analysis of plasma gelsolin levels and SOFA scores (R2 = 0.267, p = 4.53 × 10−5).
Figure 4
Figure 4
Biological Processes Dysregulated in COVID-19 (A) Volcano plots highlighting proteins (pink) and transcripts (purple) assigned with the GO term 0043312 “Neutrophil Degranulation,” where an increased point size signifies the inclusion of the biomolecule in the list of 219 features most significantly associated with COVID-19 status and severity (see Figure 2E; Tables S1 and S2). (B) Linear regressions of protein abundance versus HFD-45 for the indicated proteins as measured in COVID-19 (left) and non-COVID-19 patients (right). Resulting R2 values and their associated ± slope indicate the goodness of fit and change in abundance of a given protein with severity (HFD-45). Proteins that are more decreased in severe cases appear blue, while proteins that are increased in severe cases appear red. Significance of the protein versus HFD-45 correlation is denoted by a dot (p value < 0.01). (C) Relative abundance measurements of peptides attributed to plasma fibronectin (pFN) and cellular fibronectin (cFN). (D) Relative abundance measurements of VWF multimers and VWF antigen-2 (VWF Ag2), as estimated based on relative abundances of their unique peptides. Peptide- and protein-level data are log2-transformed and grouped into two categories, according to patient status: COVID-19 (red), non-COVID-19 (blue), where × and ∗∗ indicate p values < 0.05 and 0.001, respectively, calculated with ANOVA; for each box, the middle horizontal line is at the median, and box margins are first and third quartiles, with vertical lines extending ± 1.5-times the interquartile range.
Figure 5
Figure 5
Overview of the COVID-19 Multi-omics Webtool (A) The homepage provides PCA scores and loadings plots (also see STAR Methods). Selected biomolecules are presented in a barplot and a boxplot. Boxplots have a horizontal line at the median and the box extends to the first and third quartile with whiskers extending to 1.5-times the interquartile range. Each page provides buttons to navigate to the other web tools. (B) The differential expression page displays a multi-omics volcano plot with the y axis representing −log10 (p values) where the p values are derived from the analysis in Figure 2 and the x axis is the log2 fold-change between the means of COVID-19 samples versus non-COVID-19 samples. (C) The linear regression page allows users to select any combination of biomolecule and clinical measurement to analyze via univariate linear regression. R2 and p values for the F-statistic are displayed on the plot. (D) The Clustergrammer page offers an interactive clustered heatmap (see STAR Methods).
Figure 6
Figure 6
Results from Analyses Demonstrating a Use-Case of this Multi-omic Resource (A) Data splitting scheme for training and test sets from the 100 COVID-19 patients with all four omics datasets. A random 20% was held out to be used for model evaluation, and the remaining 80% was used to determine the best hyperparameters with 5-fold cross validation. (B) ExtraTrees classifier performance metrics on the test set after hyperparameter optimization using each of the four omic datasets separately for training or all omics data combined. (C) Macro-averaged receiver-operator characteristic curves for the models trained with multi-omic data, Charlson score, or both multi-omic data and Charlson score. (D) Test set predictions of the extra trees model trained on the combined multi-omic dataset showing correct predictions as a function of the disease severity defined by hospital-free days. (E) Top 5 most important predictive features for each of the models trained on the four omic subsets (see Table S6). Feature importance for each set was normalized to the most important feature.

Update of

  • Large-scale Multi-omic Analysis of COVID-19 Severity.
    Overmyer KA, Shishkova E, Miller IJ, Balnis J, Bernstein MN, Peters-Clarke TM, Meyer JG, Quan Q, Muehlbauer LK, Trujillo EA, He Y, Chopra A, Chieng HC, Tiwari A, Judson MA, Paulson B, Brademan DR, Zhu Y, Serrano LR, Linke V, Drake LA, Adam AP, Schwartz BS, Singer HA, Swanson S, Mosher DF, Stewart R, Coon JJ, Jaitovich A. Overmyer KA, et al. medRxiv [Preprint]. 2020 Jul 19:2020.07.17.20156513. doi: 10.1101/2020.07.17.20156513. medRxiv. 2020. Update in: Cell Syst. 2021 Jan 20;12(1):23-40.e7. doi: 10.1016/j.cels.2020.10.003. PMID: 32743614 Free PMC article. Updated. Preprint.

References

    1. Ackermann M., Verleden S.E., Kuehnel M., Haverich A., Welte T., Laenger F., Vanstapel A., Werlein C., Stark H., Tzankov A. Pulmonary vascular endothelialitis, thrombosis, and angiogenesis in Covid-19. N. Engl. J. Med. 2020;383:120–128. - PMC - PubMed
    1. Ali R.A., Gandhi A.A., Meng H., Yalavarthi S., Vreede A.P., Estes S.K., Palmer O.R., Bockenstedt P.L., Pinsky D.J., Greve J.M. Adenosine receptor agonism protects against NETosis and thrombosis in antiphospholipid syndrome. Nat. Commun. 2019;10:1916. - PMC - PubMed
    1. Antcliffe D.B., Burnham K.L., Al-Beidh F., Santhakumaran S., Brett S.J., Hinds C.J., Ashby D., Knight J.C., Gordon A.C. Transcriptomic signatures in sepsis and a differential response to steroids. From the VANISH randomized trial. Am. J. Respir. Crit. Care Med. 2019;199:980–986. - PMC - PubMed
    1. Arndt S., Turvey C., Andreasen N.C. Correlating and predicting psychiatric symptom ratings: Spearman’s R versus Kendall's Tau correlation. J. Psychiatr. Res. 1999;33:97–104. - PubMed
    1. Barnes B.J., Adrover J.M., Baxter-Stoltzfus A., Borczuk A., Cools-Lartigue J., Crawford J.M., Daßler-Plenker J., Guerci P., Huynh C., Knight J.S. Targeting potential drivers of COVID-19: neutrophil extracellular traps. J. Exp. Med. 2020;217:e20200652. - PMC - PubMed

Publication types