. 2021 Jan 11;31(1):77-89.e5.
doi: 10.1016/j.cub.2020.09.082. Epub 2020 Oct 22.

An Acquired and Endogenous Glycocalyx Forms a Bidirectional "Don't Eat" and "Don't Eat Me" Barrier to Phagocytosis

Affiliations

An Acquired and Endogenous Glycocalyx Forms a Bidirectional "Don't Eat" and "Don't Eat Me" Barrier to Phagocytosis

Paul R C Imbert et al. Curr Biol. .

Abstract

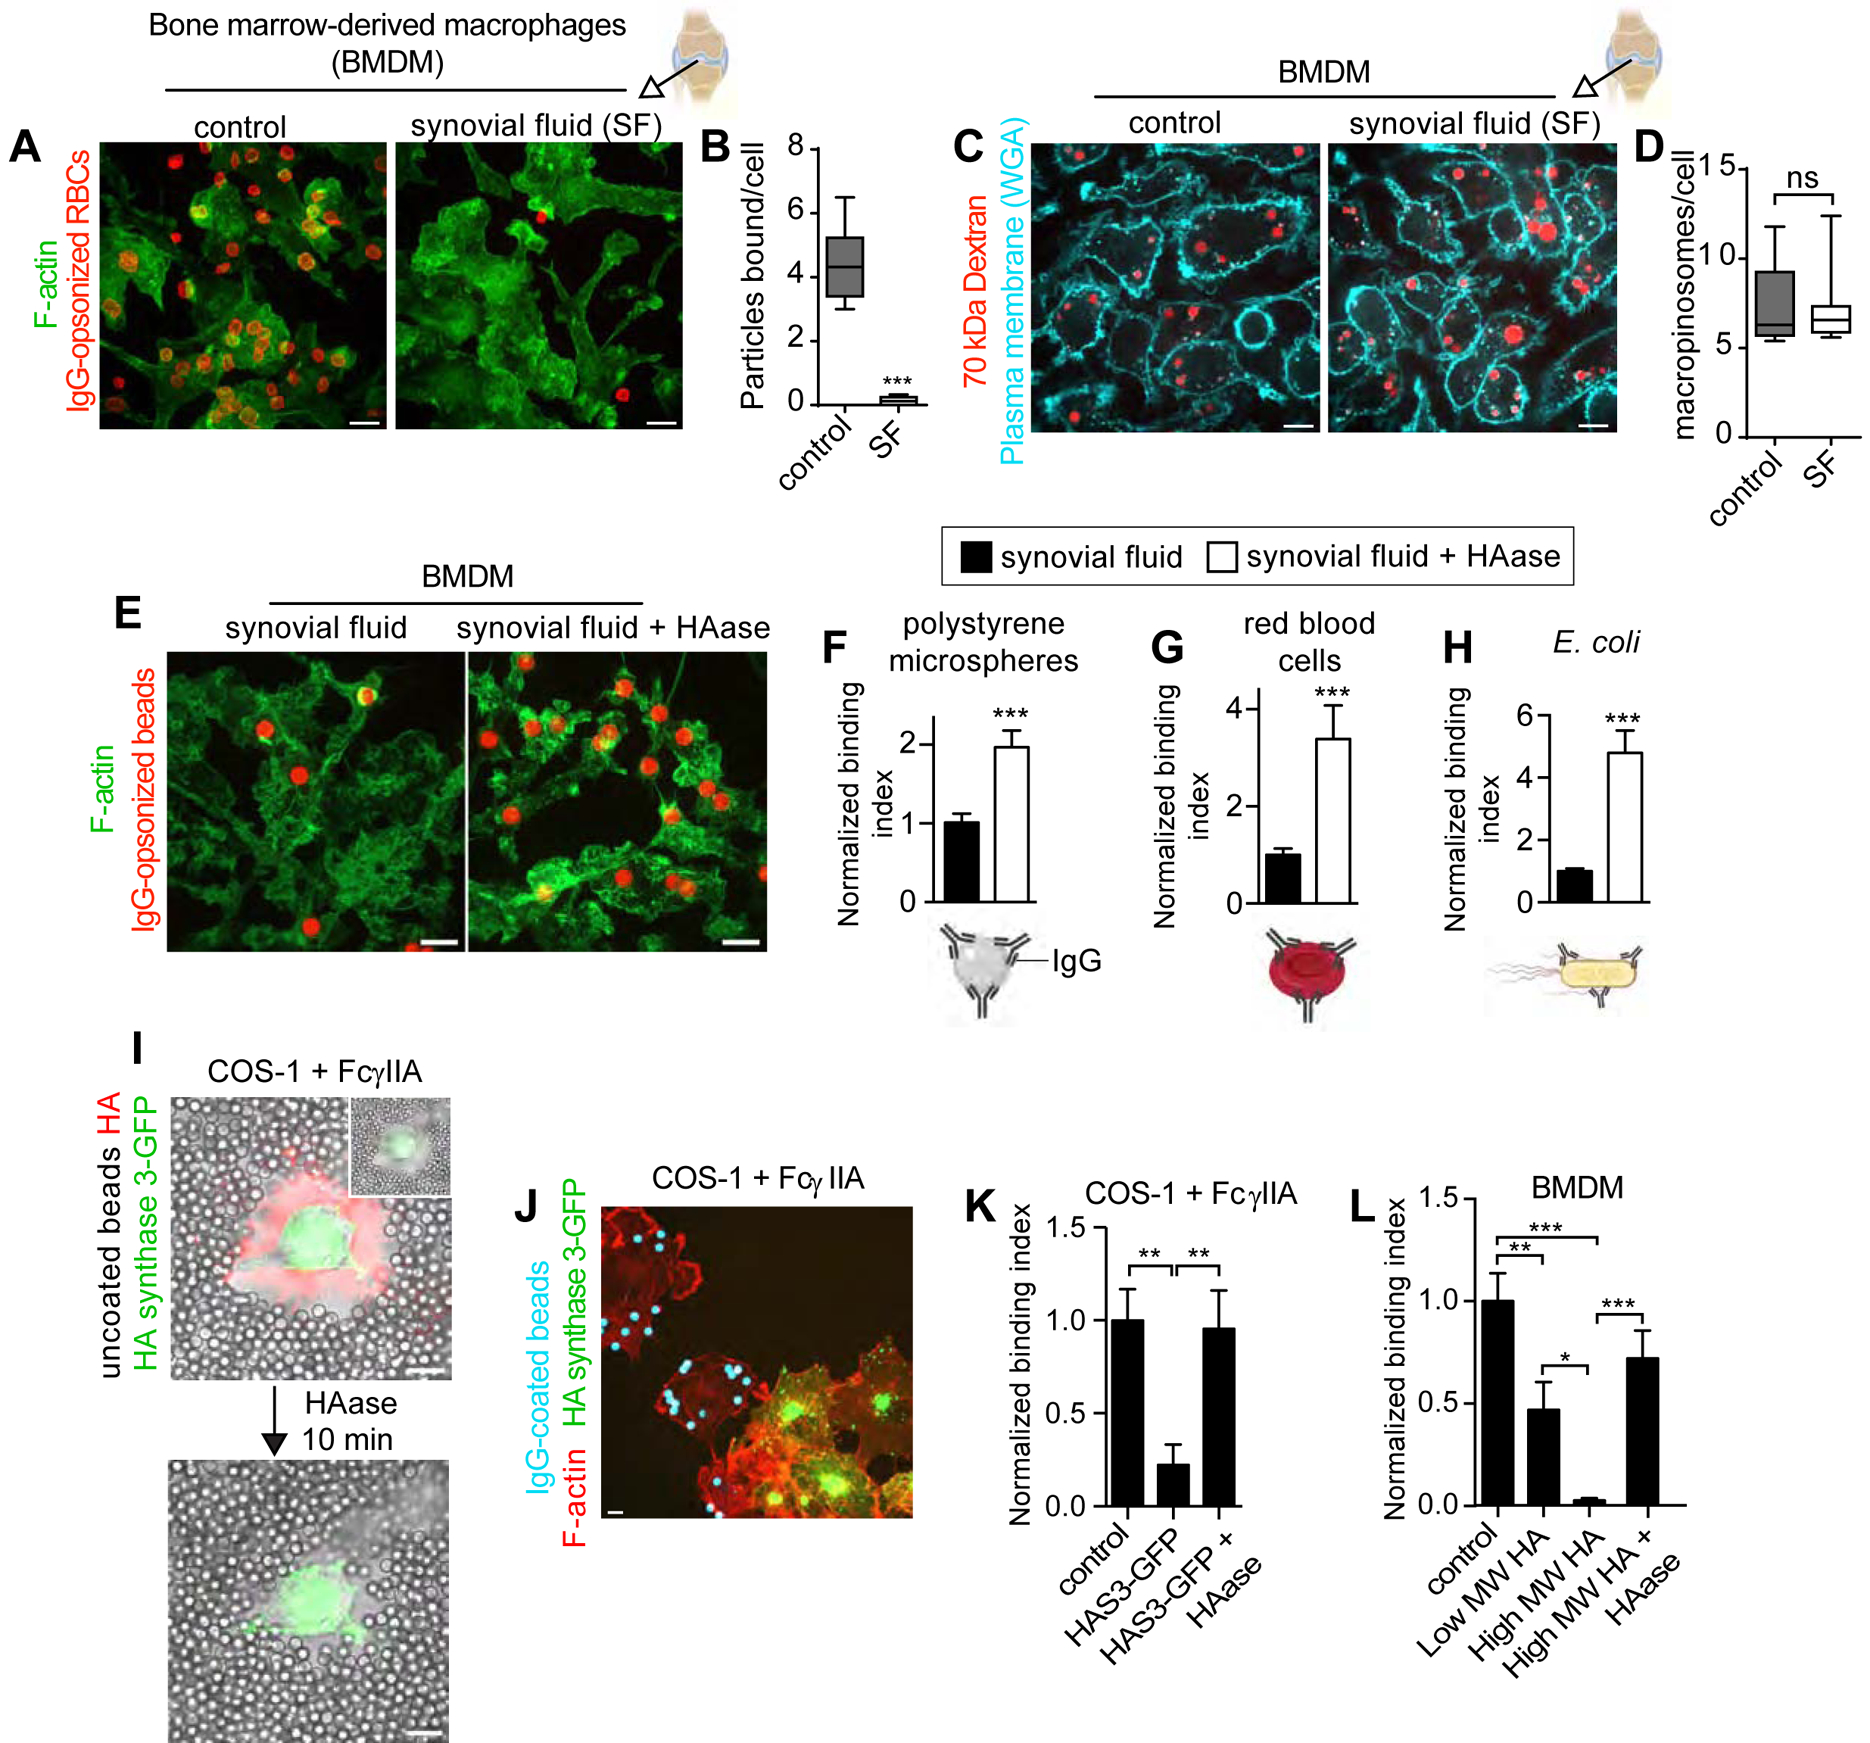
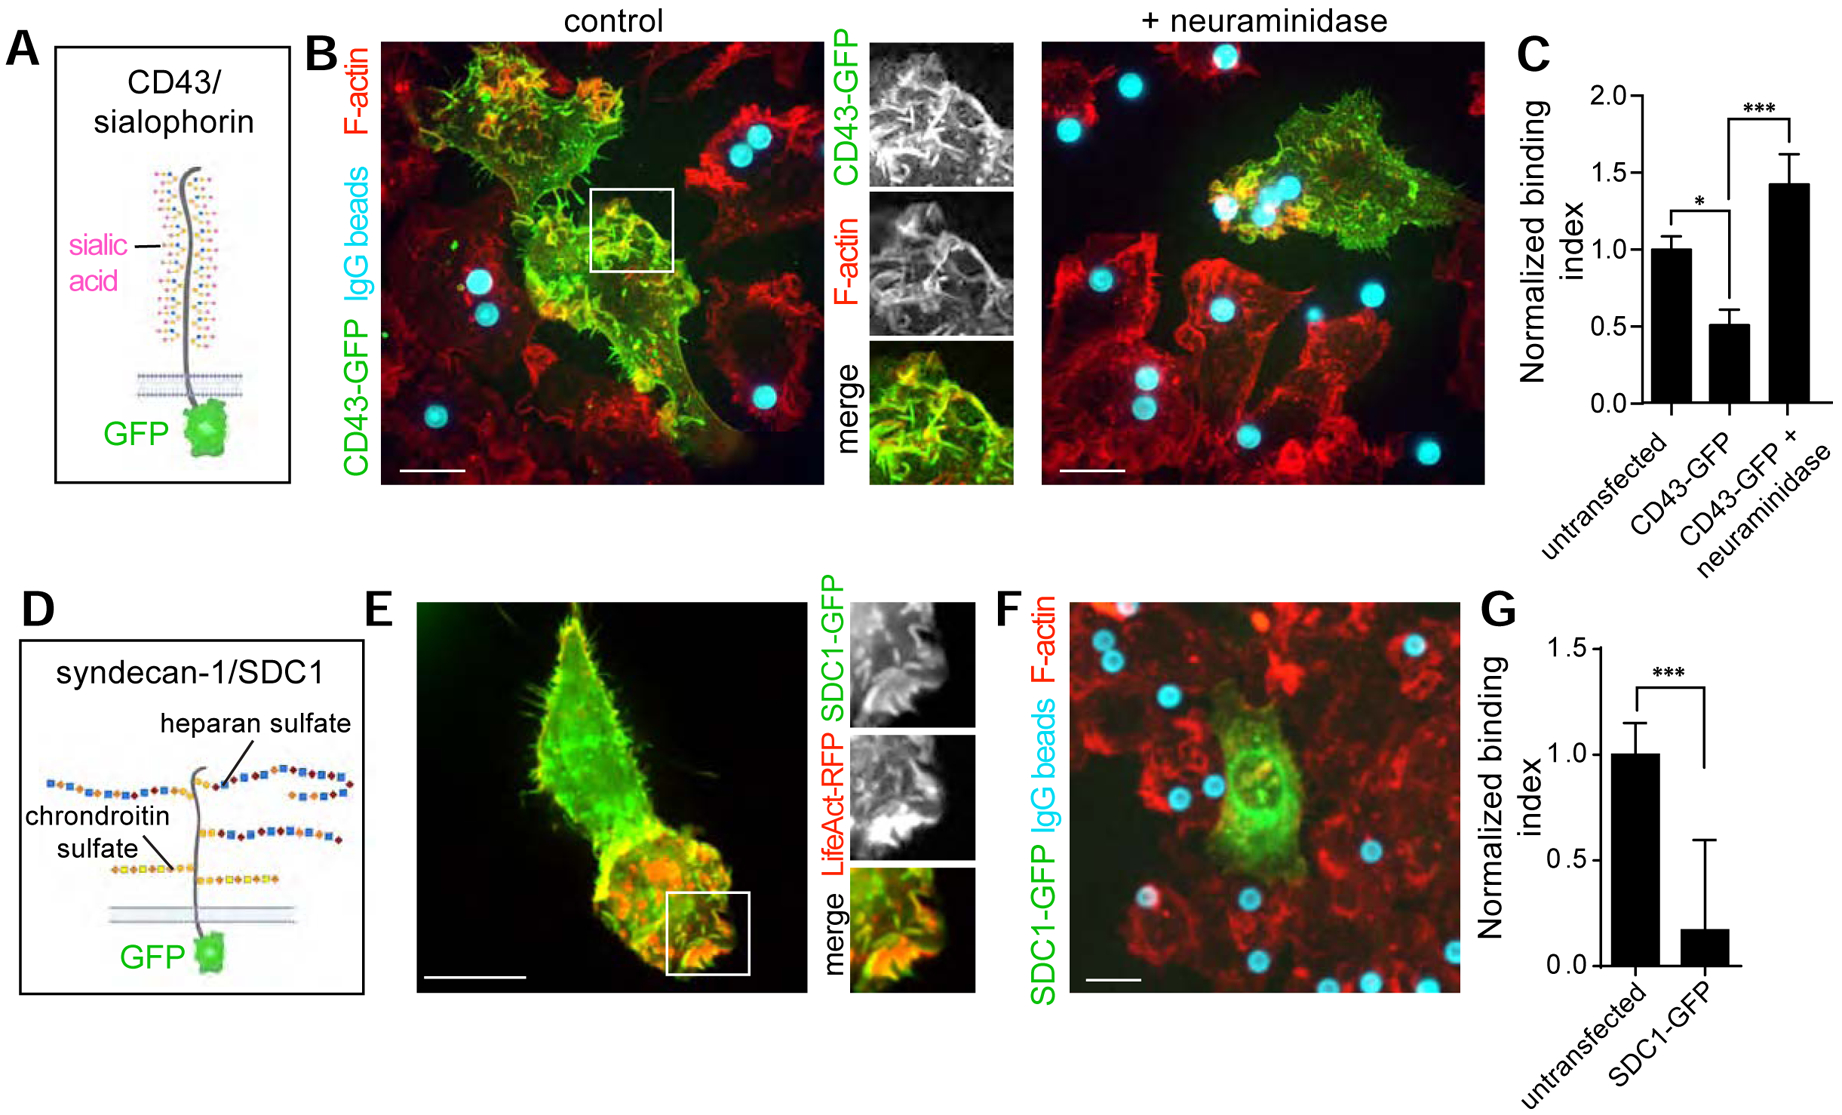
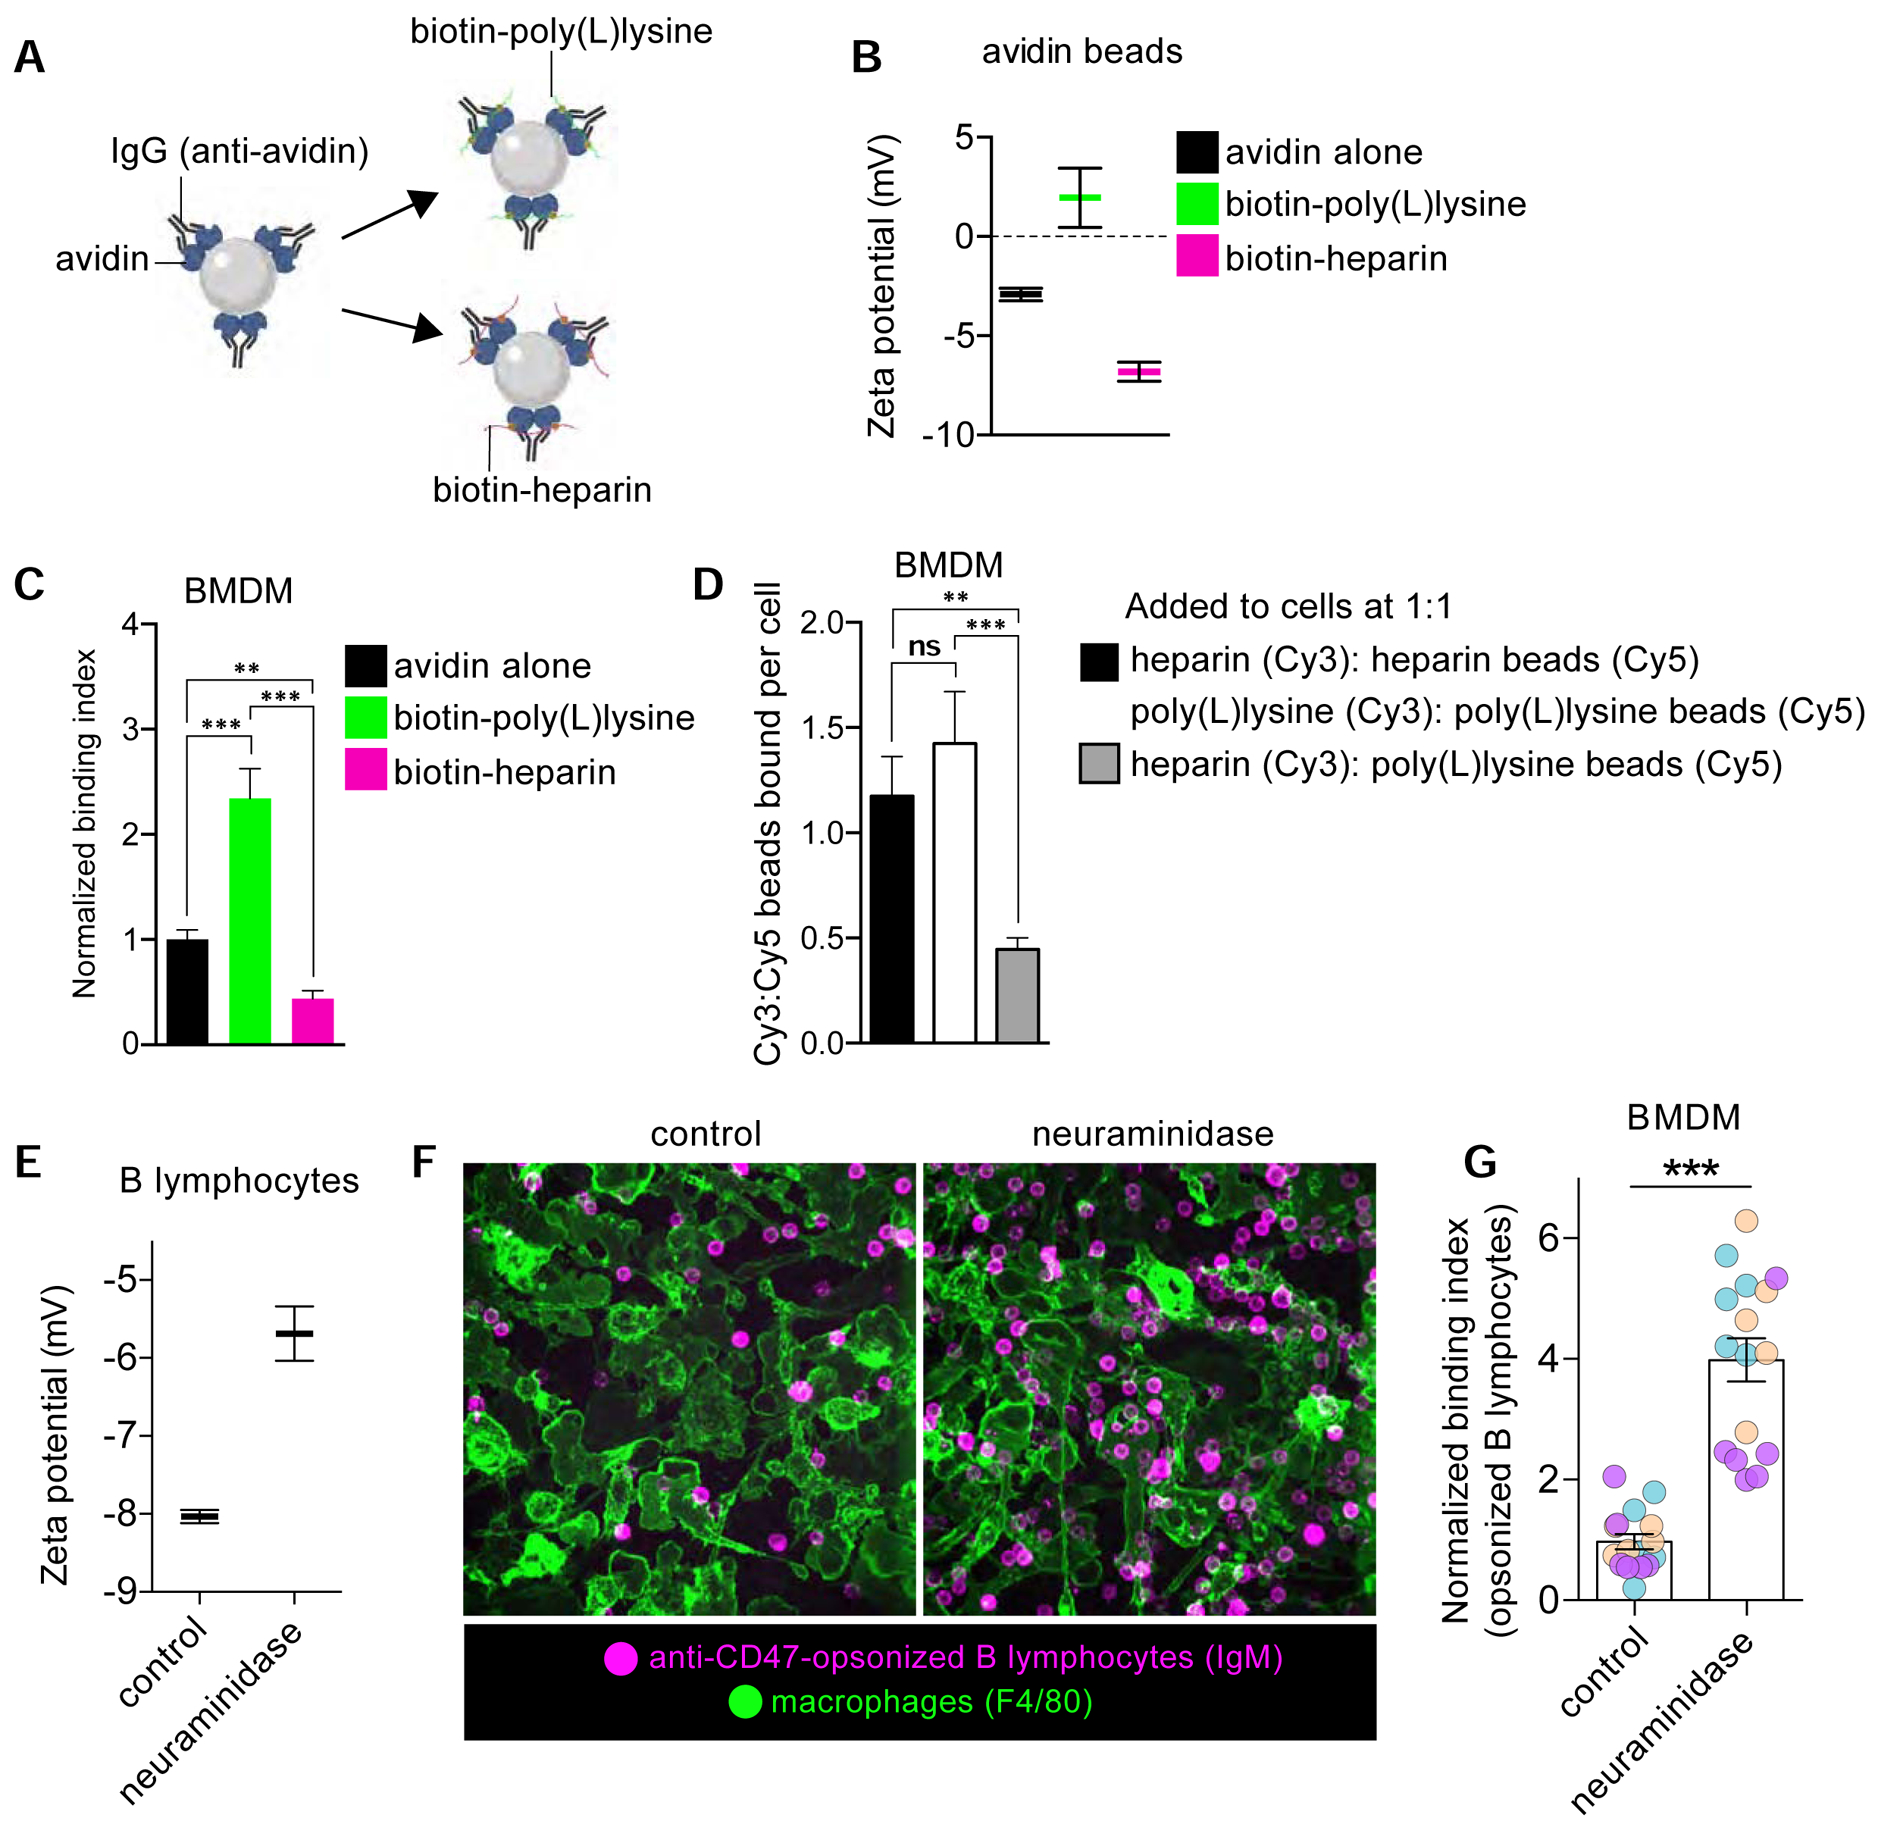
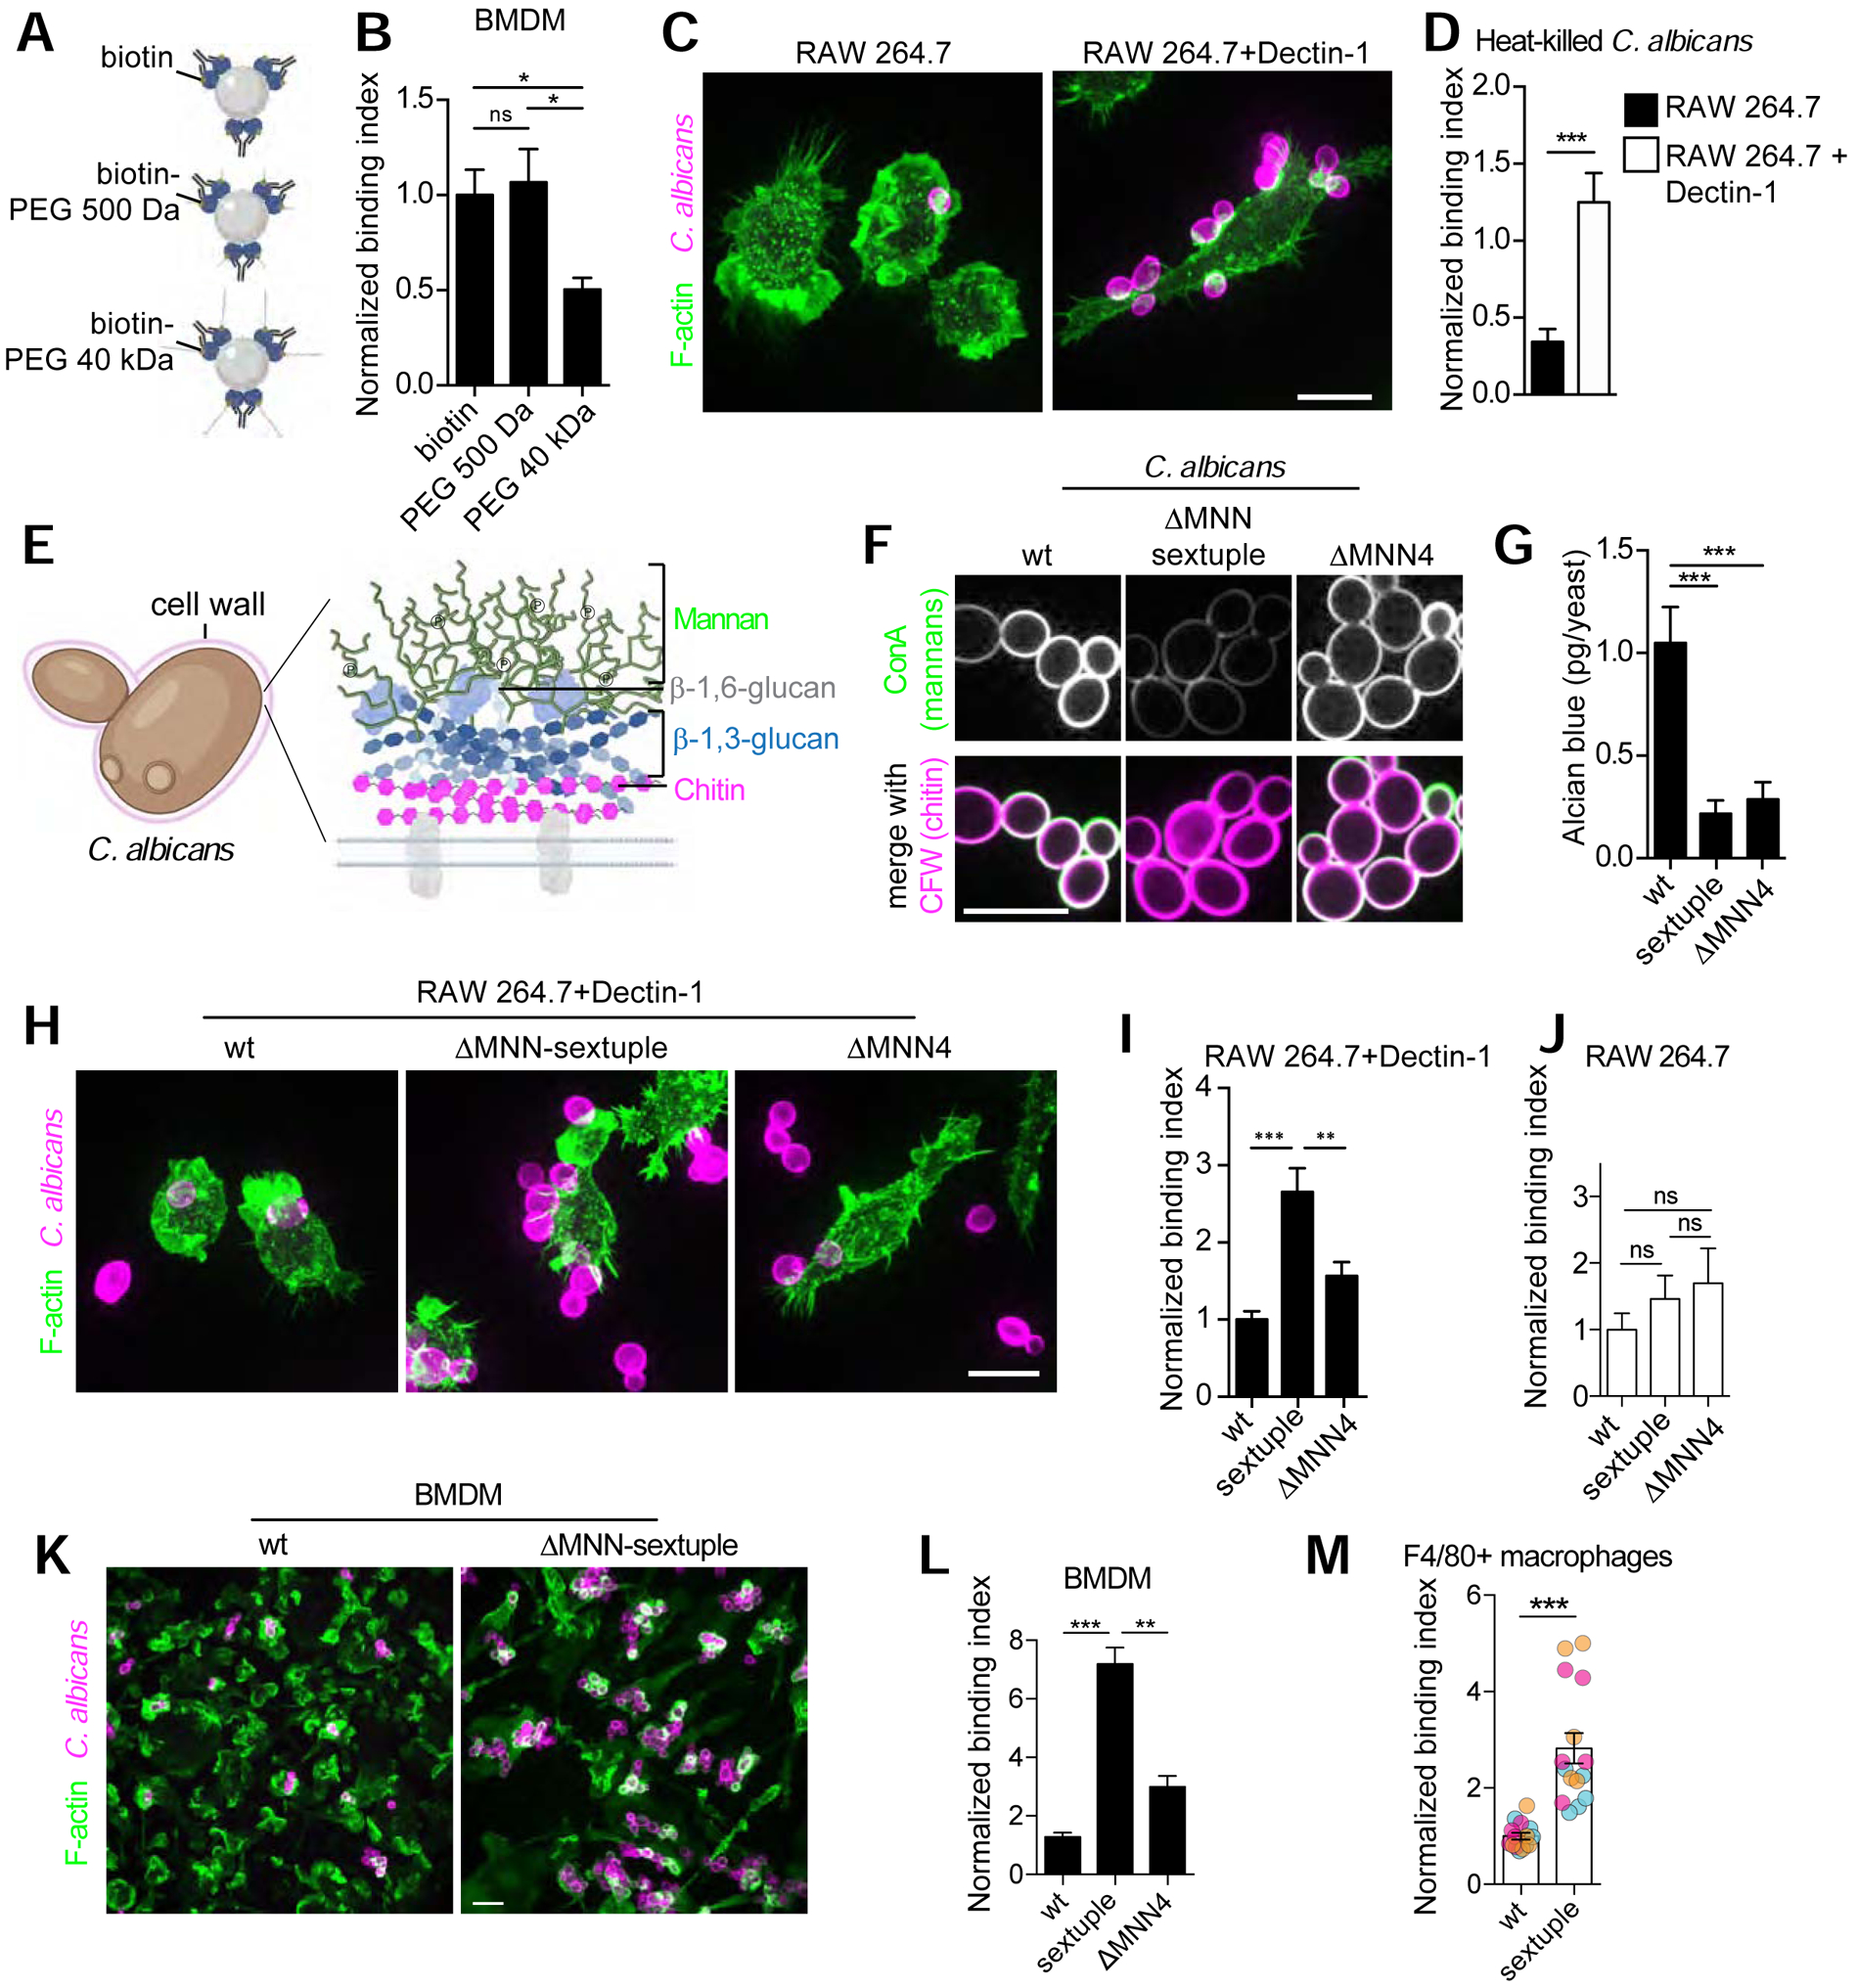
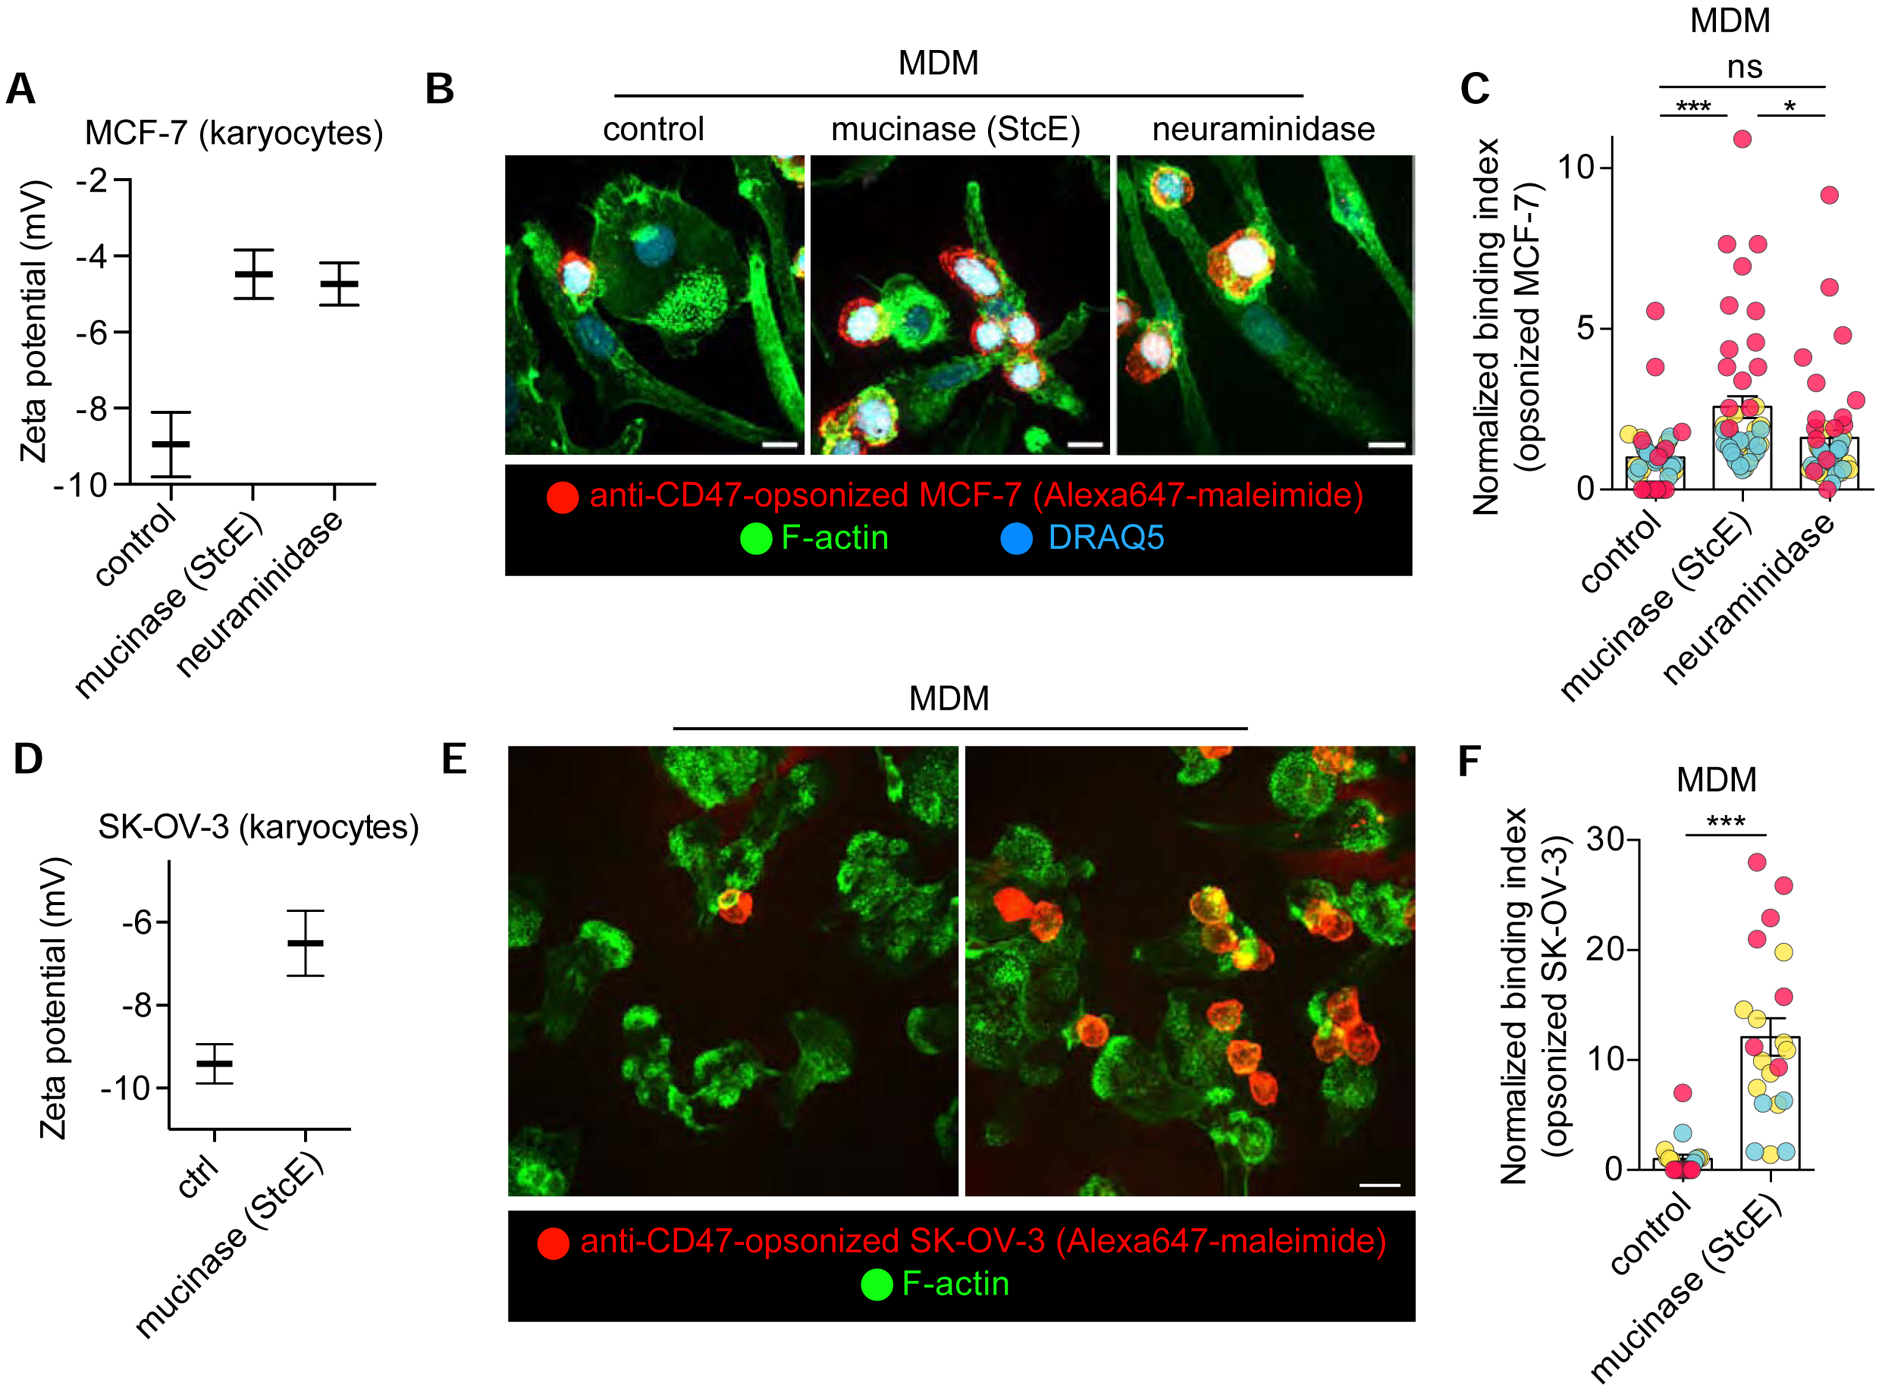
Macrophages continuously survey their environment in search of pathogens or apoptotic corpses or debris. Targets intended for clearance expose ligands that initiate their phagocytosis ("eat me" signals), while others avoid phagocytosis by displaying inhibitory ligands ("don't eat me" signals). We report that such ligands can be obscured by the glycosaminoglycans and glycoproteins that coat pathogenic as well as malignant phagocytic targets. In addition, a reciprocal barrier of self-synthesized or acquired glycocalyx components on the macrophage surface shrouds phagocytic receptors, curtailing their ability to engage particles. The coating layers of macrophages and their targets hinder phagocytosis by both steric and electrostatic means. Their removal by enzymatic means is shown to markedly enhance phagocytic efficiency. In particular, we show that the removal of mucins, which are overexpressed in cancer cells, facilitates their clearance. These results shed light on the physical barriers that modulate phagocytosis, which have been heretofore underappreciated. VIDEO ABSTRACT.

Keywords: CD47; Candida albicans; hyaluronan; mucinase; sialic acid; surface charge; syndecan; synovial-resident macrophages; tumor-associated macrophages.


Conflict of interest statement

Declaration of Interests C.R.B is a co-founder and scientific advisory board member of Lycia Therapeutics, Palleon Pharmaceuticals, Enable Bioscience, Redwood Biosciences (a subsidiary of Catalent), and InterVenn Biosciences, and a member of the board of directors of Eli Lilly & Company.

Figures

Figure 1.
Figure 1.. High molecular weight forms of hyaluronan (HA) in synovial fluid curtail particle binding without impairing membrane ruffling.
A-B) Primary, bone marrow-derived macrophages (BMDM) bathed in medium or synovial fluid were incubated with IgG-opsonized red blood cells (RBCs) for 20 min before fixation. B) Mean number of RBCs bound per cell determined for 5 fields of 3–10 cells, n=3. C-D) Cells were incubated with medium or synovial fluid containing tetramethylrhodamine-labelled 70 kDa dextran for 15 min, subsequently labeled with Alexa 647-wheat germ agglutinin for 2 min and imaged live. See also Figure S1 for phagocytic efficiency determinations and additional controls. D) Mean number of macropinosomes per cell determined for 5 fields of 5–10 cells, n=3. E-H) BMDM were incubated with synovial fluid or synovial fluid, then treated with hyaluronidase (HAase) where indicated, and finally challenged with the indicated IgG-opsonized phagocytic targets, fixed and stained for F-actin and target IgG. A representative image is shown in E. Normalized binding indices in F-H are from >5 fields of 15–30 cells, n=3. Bars represent means ± SEM. I-K) COS1 cells stably expressing FcγRIIA transiently expressing GFP-tagged HA synthase 3 (HAS3-GFP). I) Uncoated polystyrene microspheres added to cells (DIC). HA was imaged using an HA-binding complex covalently labelled with biotin followed by Alexa 555-streptavidin, before (left panel) and after (right panel) HAase treatment. J-K) IgG-opsonized beads added to cells for 15 min before fixation and staining with rhodamine phalloidin. Normalized binding index in K is from >5 fields of 5–10 cells, n=3. Bars represent means ± SEM. L) BMDM, preincubated with indicated forms of HA, then treated with or without HAase and challenged with IgG-opsonized beads. Normalized binding index is from >5 fields of >10 cells each, n=3. Bars represent means ± SEM. All scale bars, 10 μm. Here and elsewhere, Mann-Whitney tests were used; *p<0.05, **p<0.01, ***p<0.001.
Figure 2.
Figure 2.. Acquired and endogenous glycocalyx components contribute to the negative zeta potential of macrophages.
A) Zeta potential of suspended BMDMs coated or not with high molecular weight HA, followed by HAase treatment where noted. Bars represent means ± SEM. n=3. B) BMDM left untreated or treated with intact or denatured α2–3,6,8 neuraminidase for 30 min. Cells stained with Cy5-conjugated Sambucus nigra agglutinin (SNA) or Alexa 488-conjugated peanut agglutinin (PNA), lectins that recognize terminal sialic acid or galactose, respectively. Scale bar, 10 μm. C) Cells treated as in B, but lifted into suspension and measured for zeta potential as in A. D) Zeta potential determinations for indicated IgG-opsonized particles. Bars represent means ± SEM. n=3. E) BMDM, treated as in B and challenged with phagocytic targets. Normalized binding index of IgG-opsonized beads is from >5 fields of >10 cells each, n=3. Bars represent means ± SEM. See also Figure S2 for additional zeta potential measurements, Siglec expression, and the functional effect of SHP1/2.
Figure 3.
Figure 3.. Ectopic surface expression of CD43 or syndecan-1 reduces particle binding.
A) Diagrammatic representation of CD43, a large transmembrane mucin-type glycoprotein bearing ≈80 sialylated O-glycan sites. The predicted molecular weight of the polypeptide backbone is 44 kDa, while the observed molecular weight determined by SDS-PAGE is 115–130 kDa, suggesting a large contribution to the mass by glycans. B) RAW cells expressing CD43-GFP, treated or not with α2–3,6,8 neuraminidase, challenged with IgG-opsonized particles for 15 min then fixed and stained for F-actin and target IgG. C) Quantification from B. >20 cells, n=3. Bars represent means ± SEM. D) Diagrammatic representation of syndecan-1, a proteoglycan containing two extracellular attachment sites for chondroitin sulfate and three for heparan sulfate. E) RAW 264.7 cells expressing syndecan-1(SDC1)-GFP and LifeAct-RFP. F) RAW 264.7 cells expressing syndecan-1(SDC1)-GFP challenged with IgG-coated particles for 15 min and stained for F-actin and target IgG. G) Quantification from experiments like that in F; >15 cells, n=4. All bars represent means ± SEM. All scale bars, 10 μm. See also Figure S3 demonstrating that surface receptor expression is not impacted by CD43 or SDC1 overexpression.
Figure 4.
Figure 4.. Charge selectivity in phagocytic target binding by macrophages.
A-B) Diagrammatic representation of experimental setup (A), where polystyrene microspheres were coated with avidin followed by anti-avidin antibodies and biotinylated polymers. B) Zeta potential measurements of avidin beads and those containing biotinylated poly(L)lysine or heparin. Bars represent means ± SEM. C) Normalized binding index of indicated particles by BMDM. D) Ratio of beads bound per cell given to BMDM at an equal (1:1) ratio. >5 fields of 15–30 cells, n=3. Bars represent means ± SEM. E) Zeta potential determination of B lymphocytes either untreated or treated with α2–3,6,8-neuraminidase. Bars represent means ± SEM. F-G) Anti-CD47 opsonized B cells with or without sialic acid were added to BMDM and subsequently fixed and stained for F-actin and IgM-BCR (B cells). Representative image shown in F. Normalized binding indices in G are from >5 fields of 15–30 cells, n=3. Bars represent means ± SEM. See also Figure S4 demonstrating that force overcomes electrical barriers to particle engagement.
Figure 5.
Figure 5.. The glycocalyx of phagocytic targets constitutes a mechanical barrier to ligand recognition and engagement by phagocytic receptors.
A) Diagrammatic representation of experimental model. B) Avidin beads opsonized with anti-avidin antibodies and containing biotin-PEG of indicated sizes were incubated with BMDM for 15 min. Normalized binding index is from >5 fields of 5–10 cells, n=3. Bars represent means ± SEM. C) RAW 264.7 cells and those stably expressing Dectin-1 challenged with heat-killed Candida albicans and stained with calcofluor-white (CFW) and Alexa488-phalloidin (F-actin) after fixation and permeabilization. D) The mean normalized binding index determined for >5 fields of >10 cells each, n=3. E) Diagrammatic representation of C. albicans cell wall. F) Wildtype (wt) and indicated MNN deletion strains of C. albicans live-stained with CFW to detect chitin and concanavalin A (ConA) to detect mannans. G) Quantitation of Alcian blue staining for C. albicans strains shown in F. H) Representative images of RAW 264.7 cells stably expressing Dectin-1 challenged with indicated C. albicans strains stained with calcofluor-white (C. albicans) and Alexa488-phalloidin (F-actin) after fixation and permeabilization. I-J) Quantification of RAW 264.7 cells stably expressing Dectin-1 in I, or parental RAW 264.7 cells in J, and challenged with indicated C. albicans strains. K-L) BMDM challenged with wt and ΔMNN-sextuple C. albicans strains. Representative images are shown in K. Normalized binding index determined for >5 fields of >5 cells, n=3. Bars represent means ± SEM. M) Macrophages elicited to the peritoneal cavity by periodate were challenged with C. albicans strains in vivo for 1 h followed by fixation and staining for F4/80. Normalized binding index determined for >5 fields of >5 cells each, n=3. Bars represent means ± SEM. All scale bars, 10 μm.
Figure 6.
Figure 6.. Transmembrane mucins override antibody blockade of CD47-SIRPα “don’t eat me” signals.
A) Zeta potential measurements of suspended karyoplasts derived from human breast adenocarcinoma (MCF-7) cells treated with a recombinant mucinase (StcE), α2–3,6,8 neuraminidase, or left untreated. Bars represent means ± SEM. n=3. B) Human monocyte-derived macrophages (hMDM) challenged with anti-CD47-opsonized MCF-7 cells treated with an Alexa Fluor 647 maleimide derivative. Cells are stained with Alexa 488 phalloidin (F-actin) and DRAQ5 (nuclei). C) Normalized binding index from >5 fields of >10 cells, n=3. Bars represent means ± SEM. D-F) Performed as in A-C but with SK-OV-3 cells. See also Figure S5 for target particle size determinations.

Comment in

References

    1. Flannagan RS, Jaumouille V, and Grinstein S (2012). The cell biology of phagocytosis. Annu Rev Pathol 7, 61–98. - PubMed
    1. Arandjelovic S, and Ravichandran KS (2015). Phagocytosis of apoptotic cells in homeostasis. Nat Immunol 16, 907–917. - PMC - PubMed
    1. Feng M, Jiang W, Kim BYS, Zhang CC, Fu YX, and Weissman IL (2019). Phagocytosis checkpoints as new targets for cancer immunotherapy. Nat Rev Cancer 19, 568–586. - PMC - PubMed
    1. Gordon SR, Maute RL, Dulken BW, Hutter G, George BM, McCracken MN, Gupta R, Tsai JM, Sinha R, Corey D, et al. (2017). PD-1 expression by tumour-associated macrophages inhibits phagocytosis and tumour immunity. Nature 545, 495–499. - PMC - PubMed
    1. Tseng D, Volkmer JP, Willingham SB, Contreras-Trujillo H, Fathman JW, Fernhoff NB, Seita J, Inlay MA, Weiskopf K, Miyanishi M, et al. (2013). Anti-CD47 antibody-mediated phagocytosis of cancer by macrophages primes an effective antitumor T-cell response. Proc Natl Acad Sci U S A 110, 11103–11108. - PMC - PubMed

Publication types

MeSH terms