. 2020 Dec 15;53(6):1230-1244.e5.
doi: 10.1016/j.immuni.2020.10.005. Epub 2020 Oct 22.

Polyreactive Broadly Neutralizing B cells Are Selected to Provide Defense against Pandemic Threat Influenza Viruses

Affiliations

Polyreactive Broadly Neutralizing B cells Are Selected to Provide Defense against Pandemic Threat Influenza Viruses

Jenna J Guthmiller et al. Immunity. .

Abstract

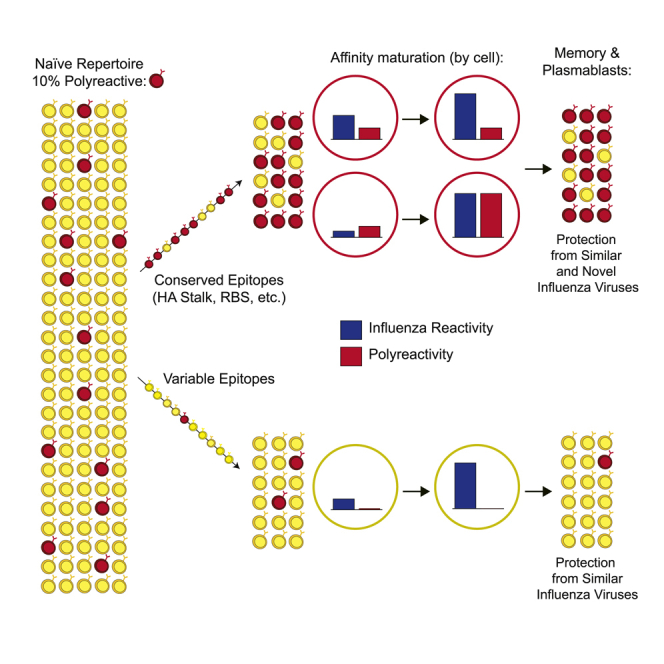
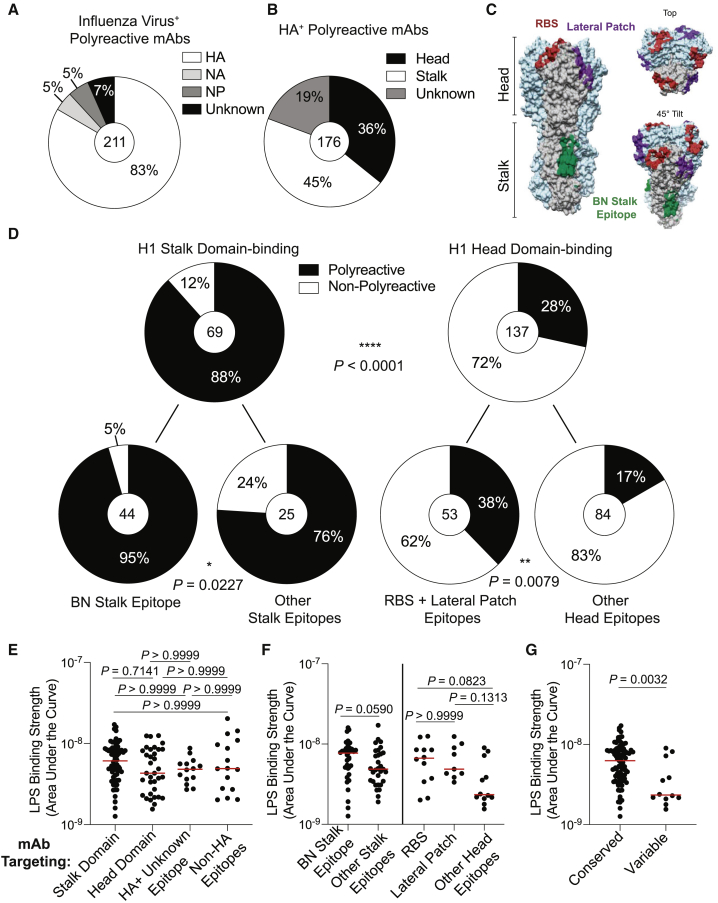
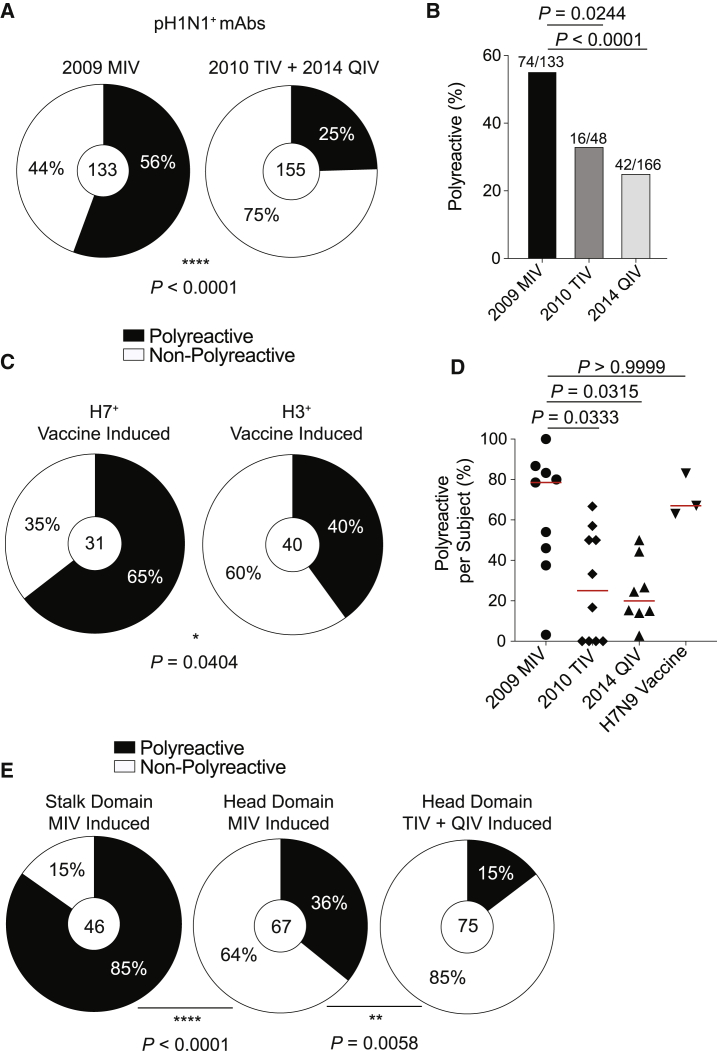
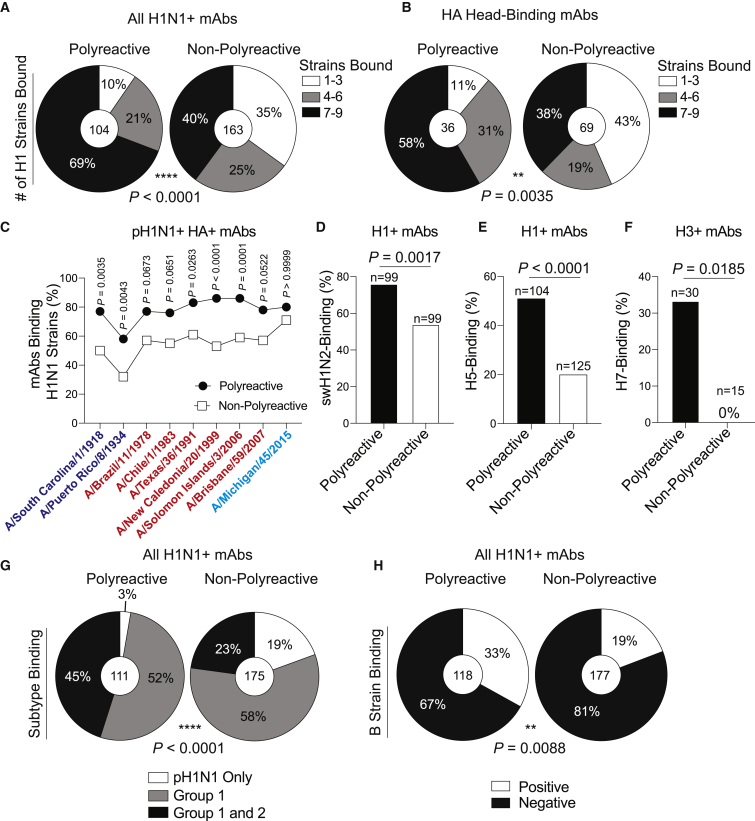
Polyreactivity is the ability of a single antibody to bind to multiple molecularly distinct antigens and is a common feature of antibodies induced upon pathogen exposure. However, little is known about the role of polyreactivity during anti-influenza virus antibody responses. By analyzing more than 500 monoclonal antibodies (mAbs) derived from B cells induced by numerous influenza virus vaccines and infections, we found mAbs targeting conserved neutralizing influenza virus hemagglutinin epitopes were polyreactive. Polyreactive mAbs were preferentially induced by novel viral exposures due to their broad viral binding breadth. Polyreactivity augmented mAb viral binding strength by increasing antibody flexibility, allowing for adaption to imperfectly conserved epitopes. Lastly, we found affinity-matured polyreactive B cells were typically derived from germline polyreactive B cells that were preferentially selected to participate in B cell responses over time. Together, our data reveal that polyreactivity is a beneficial feature of antibodies targeting conserved epitopes.

Keywords: antibody flexibility; broadly neutralizing antibodies; influenza viruses; monoclonal antibodies; polyreactivity.


Conflict of interest statement

Declaration of Interests The Icahn School of Medicine at Mount Sinai has submitted patent applications on universal influenza virus vaccines naming R.N., A.G.-S., P.P., and F.K. as inventors.

Figures

None
Graphical abstract
Figure 1
Figure 1
Polyreactive mAbs Target Conserved Epitopes on HA (A and B) Proportion of polyreactive mAbs binding distinct influenza antigens (A) and HA domains (B). (C) Structure of A/California/7/2009 HA (PDB: 4M4Y) showing the footprint of three mAbs binding conserved epitopes: CH65 (RBS; PDB: 5UGY), Fab6649 (lateral patch; PDB: 5W6G), and CR9114 (BN stalk epitope; PDB: 4FQI). (D) Proportion of stalk domain mAbs and head domain mAbs that are polyreactive, further broken down by specific epitopes targeted (bottom). (E–G) Polyreactive mAb binding strength to LPS (AUC) of mAbs targeting distinct antigens and antigen domains (stalk domain n = 66; head domain n = 34; HA+ unknown epitope n = 14; non-HA epitopes n = 16) (E), distinct epitopes of HA stalk domain (BN stalk epitope n = 35; other stalk epitopes n = 31) and head domain (RBS n = 12; lateral patch n = 9; other head epitopes n = 12) (F), and conserved epitopes of HA (stalk domain, RBS, and lateral patch; n = 87) and variable epitopes of the HA head (n = 12) (G). For data in (A), (B), and (D), the number in the center of each pie graph is the number of mAbs tested. For panels (E)–(G), each symbol represents one mAb and the red bar represents the median. Data for (D) were analyzed by Fisher’s exact tests, data for (E) were analyzed by non-parametric Kruskal-Wallis test, and data for (F) and (G) were analyzed by non-parametric Mann-Whitney test. Statistical analysis for (G) was further tested by a Bootstrap analysis to validate biological significance. See also Figures S1 and S2.
Figure 2
Figure 2
Novel Virus Exposures Induce Polyreactive mAbs (A and B) Proportion of pH1N1+ mAbs (A) or all influenza+ mAbs (B) that are polyreactive from individuals vaccinated with the 2009 MIV or 2010 TIV + 2014 QIV. (C) Proportion of H7+ or H3+ mAbs that are polyreactive from individuals vaccinated with an H7N9 LAIV/IIV or seasonal influenza vaccine (2010 TIV and 2014 QIV). (D) Proportion of polyreactive influenza+ mAbs per subject by cohort (2009 MIV n = 9; 2010 TIV n = 10; 2014 QIV n = 8; H7N9 vaccine n = 3). Each symbol represents one subject, and the red bar represents the median. Only subjects with three or more mAbs were included in the analysis. (E) Proportion of MIV stalk domain-induced, MIV head domain-induced, or seasonal vaccine head domain-induced mAbs that are polyreactive. For data in (A), (C), and (E), the number in the center of each pie graph is the number of mAbs tested. For (B), the number on top of individual bars is the number of polyreactive mAbs out of total mAbs tested. Data for (A)–(C) and (E) were analyzed by Fisher’s exact tests, and data for (D) were analyzed by a non-parametric Kruskal-Wallis test. See also Figure S3.
Figure 3
Figure 3
Polyreactive mAbs Have Broad Viral Binding Breadth (A–C) Number of tested H1N1 strains bound by all (A) or head domain-binding (B) pH1N1+ polyreactive and non-polyreactive mAbs. (C) Proportion of polyreactive and non-polyreactive mAbs binding H1N1 viruses over time, with each symbol representing the proportion of mAbs binding each strain. Viruses are color coded based on antigenic similarity. (D–F) Proportion of H1+ mAbs binding A/swine/Mexico/AVX8/2011 H1N2 virus (D) or rH5 (E) and H3+ mAbs binding rH7 (F). (G and H) Proportion of H1N1+ polyreactive and non-polyreactive mAbs binding Group 1 and Group 2 influenza viruses (G) or influenza B viruses (H). For data in (A), (B), and (D)–(H), the numbers in the center of each pie graph or above each bar are the number of mAbs tested. Data in (A), (B), and (G) were analyzed by using chi-square tests, and data in (C)–(F) and (H) were analyzed by Fisher’s exact test. See also Figure S3.
Figure 4
Figure 4
Polyreactivity Augments Viral Binding Apparent Affinity by Increasing Antibody Flexibility (A and B) Apparent affinity (Kd) of all polyreactive (n = 65) and non-polyreactive (n = 49) mAbs (A) or head-binding polyreactive (n = 25) and non-polyreactive (n = 39) mAbs (B) induced by 2009 MIV binding to pH1N1 virus. (C) Apparent affinity (Kd) of polyreactive and non-polyreactive mAbs from clonal families (n = 9). The line connects mAbs from the same clonal expansion, and each line is a different clonal family. For families with two or more polyreactive or non-polyreactive members, the median Kd is depicted. (D) Spearman correlation of the apparent affinity (Kd) of polyreactive mAb binding to A/California/7/2009 virus and dsDNA (n = 37). (E) Proportion of neutralizing HAI mAbs that are polyreactive or non-polyreactive. (F and G) MD simulations for clonal members SFV019 4C05 and 4D02 (F) and 241 IgA 1E04 and 2E06 (G). The right-hand panel of (F) is the neutralizing potency against A/California/7/2009 H1N1 (IC50) of 4C05 and 4D02. Corresponding heavy-chain sequences are listed above simulations. (H) Binding apparent affinity (AUC) of 241 IgA 1E04 and 2E06 to dsDNA and LPS. (I) Apparent affinity and microneutralization potency (IC50) of 241 IgA 1E04 and 2E06 against A/California/7/2009. For data in panels (A), (B), (D), and (F)–(I), each symbol represents one mAb. For data in (E), the number in the center of the pie graph is the number of mAbs tested. Data in (A) and (B) were analyzed by unpaired non-parametric Mann-Whitney tests, and data in (C) were analyzed by using a paired non-parametric Wilcoxon matched-pairs signed rank test. See also Figure S4.
Figure 5
Figure 5
Characteristics of Polyreactive Antibody Sequences (A) VH gene usage by polyreactive and non-polyreactive mAbs. Data are represented as the proportion of total polyreactive or non-polyreactive mAbs. (B) Specific epitope targeting by mAbs utilizing VH1-2 and VH1-69 genes. (C) VK or VL gene usage by polyreactive and non-polyreactive mAbs. Data are represented as the proportion of total polyreactive or non-polyreactive mAbs. (D) Somatic hypermutations (nucleotide mutations) of heavy and light chains of polyreactive (heavy n = 74; light n = 69) and non-polyreactive (heavy n = 56; light n = 52) mAbs induced by the 2009 MIV. (E) Somatic hypermutations of heavy chains of mAbs targeting the BN stalk epitope (n = 18), other epitopes on the stalk domain (n = 27), and epitopes on the head domain (n = 66) induced by the 2009 MIV. (F) HC-CDR3 isoelectric point of polyreactive (n = 137) and non-polyreactive (n = 245) mAbs. For data in (B), the number above each bar represents the number of mAbs tested. For panels (D)–(F), each symbol represents one mAb, and the red bar represents the median. Data in (A) and (C) were analyzed by Fisher’s exact test, data in (B) were analyzed by using chi-square test, data in (D) and (F) were analyzed by unpaired non-parametric Mann-Whitney tests, and data in (E) were analyzed by a non-parametric Kruskal-Wallis test. See also Figure S5.
Figure 6
Figure 6
Polyreactivity Is Inherent to Naive B Cells Selected into the Broadly Neutralizing Response (A) Proportion of mAbs generated from total naive B cells and MBCs and from influenza stalk domain-binding germline B cells, MBCs, and plasmablasts that were polyreactive. (B and C) Binding AUC of polyreactive mAbs or the corresponding germline-reverted mAbs binding to A/California/7/2009 (n = 12) and A/Brisbane/59/2007 viruses (n = 13) (B) and dsDNA (n = 11), insulin (n = 12), and LPS (n = 12) (C). Each line connects the germline and affinity-matured version of the same mAb. (D and E) Fold change in AUC of affinity-matured mAbs over AUC of germline mAbs of all tested mAbs (D) and further broken down by initial germline affinity for A/California/7/2009 virus (E). Cyan dots represent sc70 1F02, and orange dots represent SFV005 2G02. (F and G) MD simulations of the HC-CDR3 sequences of germline and affinity-matured versions of mAbs sc70 1F02 (F) and SFV005 2G02 (G). For (A), the numbers on top of individual bars is the number of polyreactive mAbs out of total mAbs tested from each cohort. For (D) and (E), each symbol represents one mAb, and the red bar represents the median. Data in (A) were analyzed by Fisher’s exact test, and data in (B) and (C) were analyzed by paired non-parametric Wilcoxon matched-pairs signed rank tests. See also Figure S6.

References

    1. Adelman S.A., Doll J.D. Generalized Langevin equation approach for atom/solid-surface scattering: Inelastic studies. J. Chem. Phys. 1975;64:2375.
    1. Aguilera I., Melero J., Nuñez-Roldan A., Sanchez B. Molecular structure of eight human autoreactive monoclonal antibodies. Immunology. 2001;102:273–280. - PMC - PubMed
    1. Andrews S.F., Huang Y., Kaur K., Popova L.I., Ho I.Y., Pauli N.T., Henry Dunand C.J., Taylor W.M., Lim S., Huang M. Immune history profoundly affects broadly protective B cell responses to influenza. Sci. Transl. Med. 2015;7:316ra192. - PMC - PubMed
    1. Andrews S.F., Kaur K., Pauli N.T., Huang M., Huang Y., Wilson P.C. High preexisting serological antibody levels correlate with diversification of the influenza vaccine response. J. Virol. 2015;89:3308–3317. - PMC - PubMed
    1. Angeletti D., Kosik I., Santos J.J.S., Yewdell W.T., Boudreau C.M., Mallajosyula V.V.A., Mankowski M.C., Chambers M., Prabhakaran M., Hickman H.D. Outflanking immunodominance to target subdominant broadly neutralizing epitopes. Proc. Natl. Acad. Sci. USA. 2019;116:13474–13479. - PMC - PubMed

Publication types

MeSH terms

Substances