

Co-exposure to PCB126 and PFOS increases biomarkers associated with cardiovascular disease risk and liver injury in mice
- PMID: 33096110
- PMCID: PMC7725976
- DOI: 10.1016/j.taap.2020.115301
Co-exposure to PCB126 and PFOS increases biomarkers associated with cardiovascular disease risk and liver injury in mice
Abstract
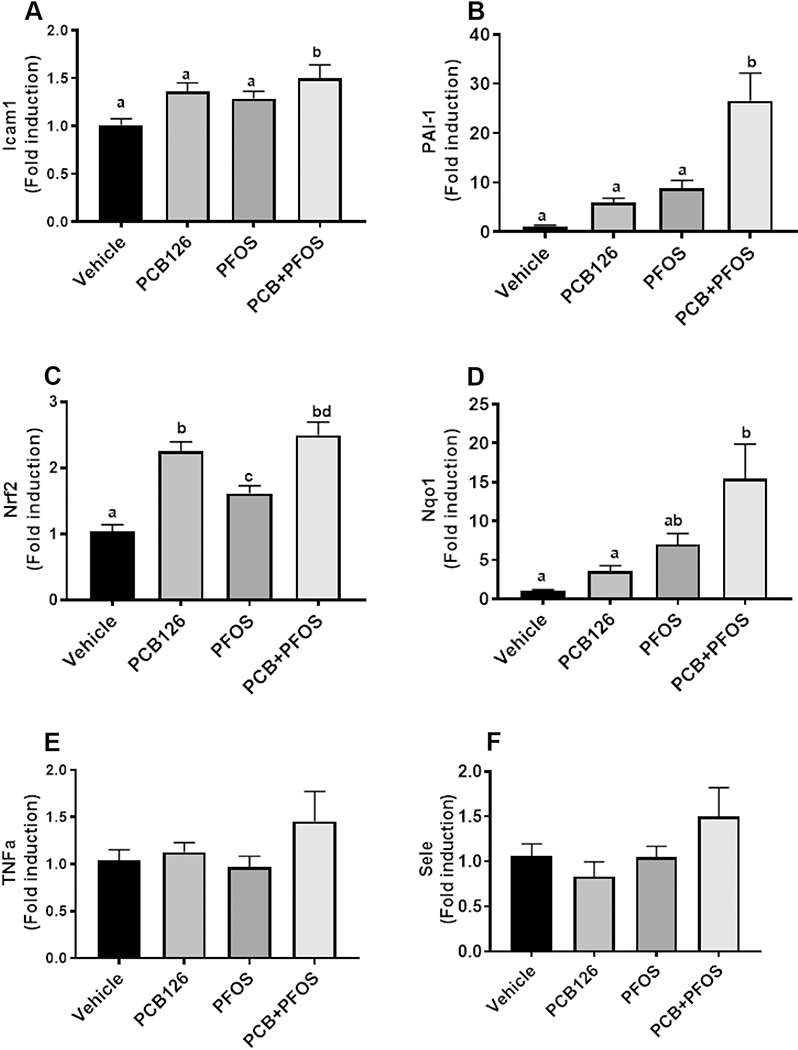
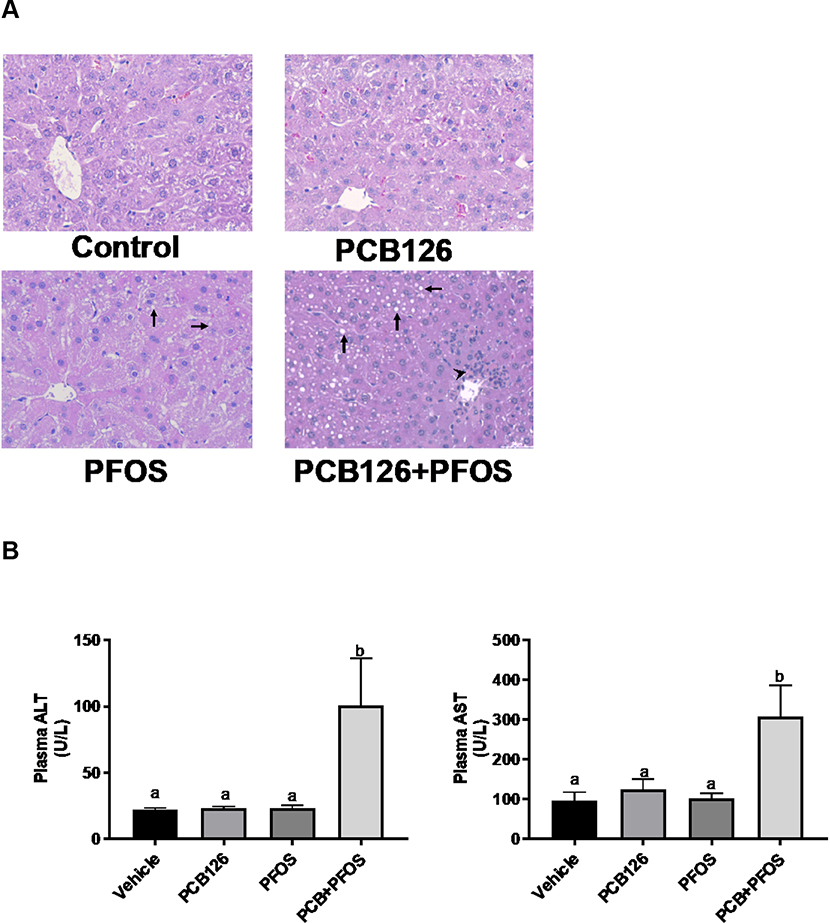
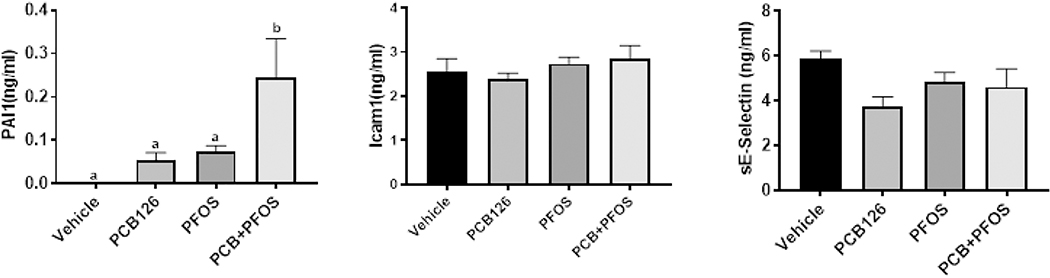
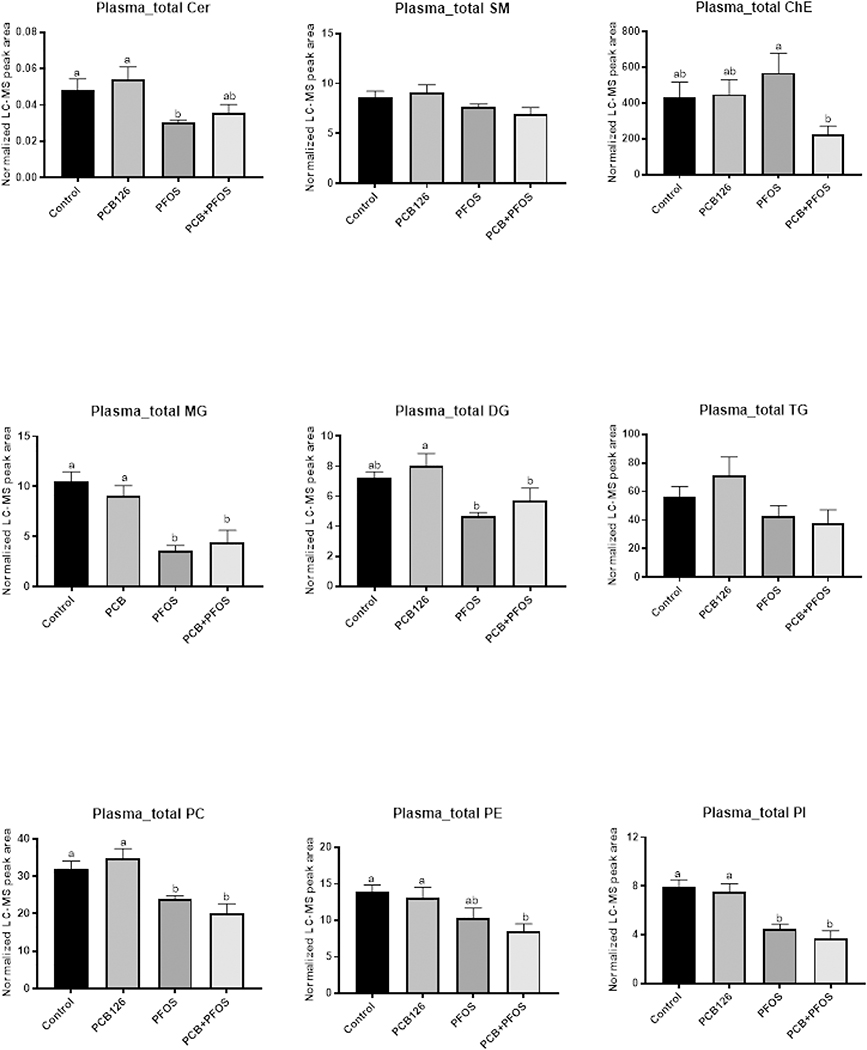
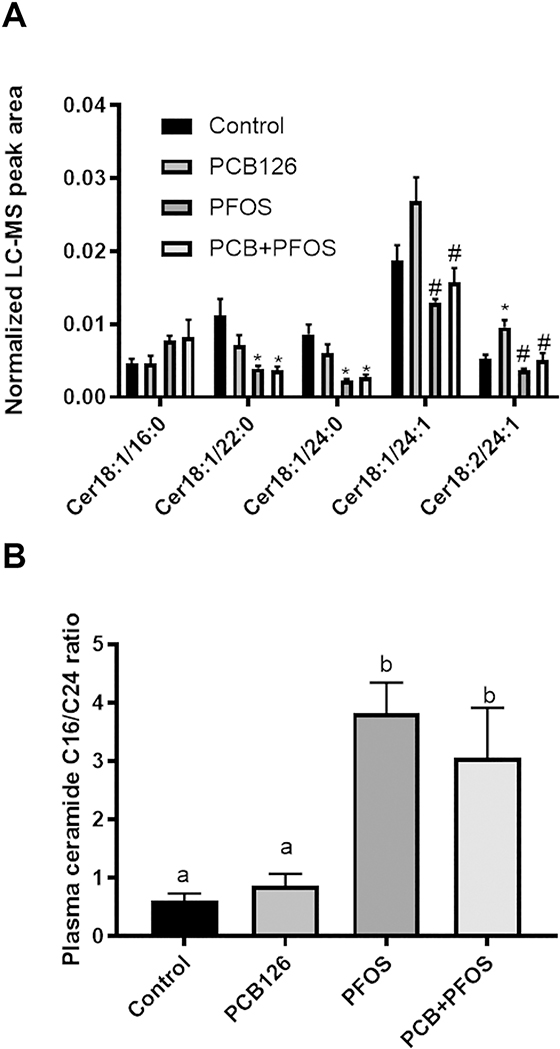
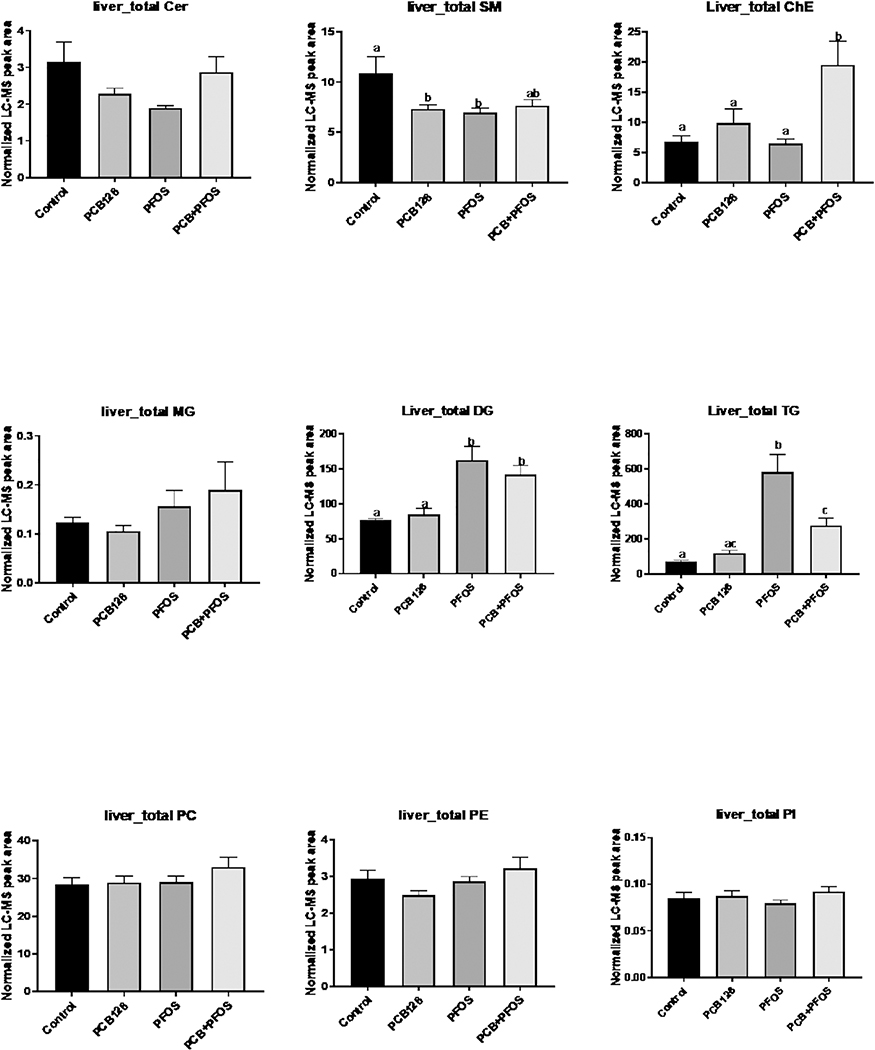
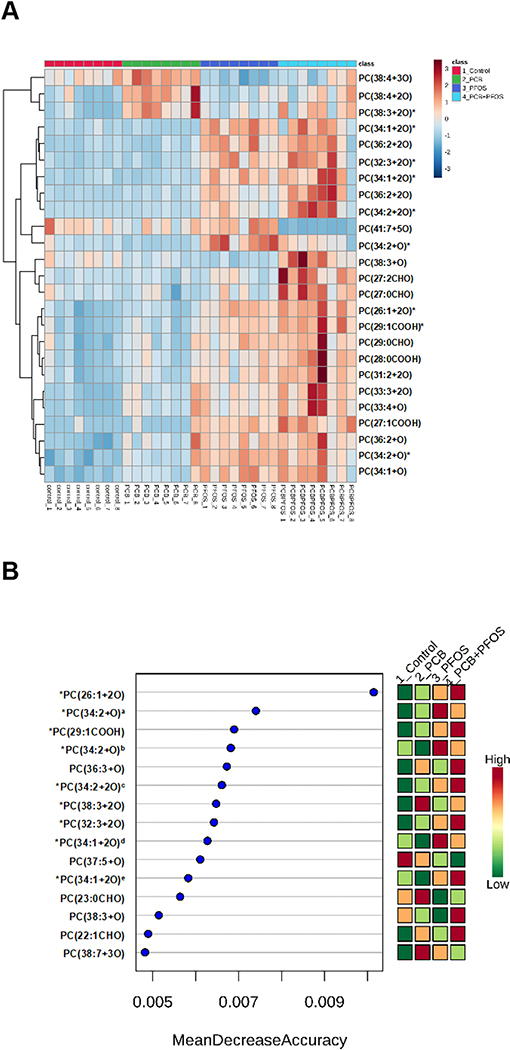
Polychlorinated biphenyl (PCB)126 and perfluorooctane sulfonic acid (PFOS) are halogenated organic pollutants of high concern. Exposure to these chemicals is ubiquitous, and can lead to potential synergistic adverse effects in individuals exposed to both classes of chemicals. The present study was designed to identify interactions between PCB126 and PFOS that might promote acute changes in inflammatory pathways associated with cardiovascular disease and liver injury. Male C57BL/6 mice were exposed to vehicle, PCB126, PFOS, or a mixture of both pollutants. Plasma and liver samples were collected at 48 h after exposure. Changes in the expression of hepatic genes involved in oxidative stress, inflammation, and atherosclerosis were investigated. Plasma and liver samples was analyzed using untargeted lipidomic method. Hepatic mRNA levels for Nqo1, Icam1, and PAI1 were significantly increased in the mixture-exposed mice. Plasma levels of PAI1, a marker of fibrosis and thrombosis, were also significantly elevated in the mixture-exposed group. Liver injury was observed only in the mixture-exposed mice. Lipidomic analysis revealed that co-exposure to the mixture enhanced hepatic lipid accumulation and elevated oxidized phospholipids levels. In summary, this study shows that acute co-exposure to PCB126 and PFOS in mice results in liver injury and increased cardiovascular disease risk.
Keywords: Cardiovascular disease; Lipid; Liver; PCB126; PFAS; PFOS.
Copyright © 2020 Elsevier Inc. All rights reserved.
Conflict of interest statement
Financial interests
The authors declare they have no actual or potential competing conflict of financial interest relevant to this work.
Declaration of interests
The authors declare that they have no known competing financial interests or personal relationships that could have appeared to influence the work reported in this paper.
Figures
Similar articles
-
Mixture-specific gene expression in zebrafish (Danio rerio) embryos exposed to perfluorooctane sulfonic acid (PFOS), perfluorohexanoic acid (PFHxA) and 3,3',4,4',5-pentachlorobiphenyl (PCB126).Sci Total Environ. 2017 Jul 15;590-591:249-257. doi: 10.1016/j.scitotenv.2017.02.232. Epub 2017 Mar 7. Sci Total Environ. 2017. PMID: 28283292
-
Editor's Highlight: PCB126 Exposure Increases Risk for Peripheral Vascular Diseases in a Liver Injury Mouse Model.Toxicol Sci. 2017 Dec 1;160(2):256-267. doi: 10.1093/toxsci/kfx180. Toxicol Sci. 2017. PMID: 28973532 Free PMC article.
-
Transcriptome sequencing reveals prenatal PFOS exposure on liver disorders.Environ Pollut. 2017 Apr;223:416-425. doi: 10.1016/j.envpol.2017.01.041. Epub 2017 Jan 25. Environ Pollut. 2017. PMID: 28131474
-
A compromised liver alters polychlorinated biphenyl-mediated toxicity.Toxicology. 2017 Apr 1;380:11-22. doi: 10.1016/j.tox.2017.02.001. Epub 2017 Feb 2. Toxicology. 2017. PMID: 28163111 Free PMC article.
-
Exposure to Perfluoroalkyl Chemicals and Cardiovascular Disease: Experimental and Epidemiological Evidence.Front Endocrinol (Lausanne). 2021 Jul 9;12:706352. doi: 10.3389/fendo.2021.706352. eCollection 2021. Front Endocrinol (Lausanne). 2021. PMID: 34305819 Free PMC article. Review.
Cited by
-
Metabolomic, Lipidomic, Transcriptomic, and Metagenomic Analyses in Mice Exposed to PFOS and Fed Soluble and Insoluble Dietary Fibers.Environ Health Perspect. 2022 Nov;130(11):117003. doi: 10.1289/EHP11360. Epub 2022 Nov 4. Environ Health Perspect. 2022. PMID: 36331819 Free PMC article.
-
Blood Levels of Organochlorine Contaminants Mixtures and Cardiovascular Disease.JAMA Netw Open. 2023 Sep 5;6(9):e2333347. doi: 10.1001/jamanetworkopen.2023.33347. JAMA Netw Open. 2023. PMID: 37698859 Free PMC article.
-
Association of exposure to per- and polyfluoroalkyl substances with liver injury in American adults.J Biomed Res. 2024 May 29;38(6):628-639. doi: 10.7555/JBR.38.20240018. J Biomed Res. 2024. PMID: 38807427 Free PMC article.
-
Effects of Early Life Exposures to the Aryl Hydrocarbon Receptor Ligand TCDF on Gut Microbiota and Host Metabolic Homeostasis in C57BL/6J Mice.Environ Health Perspect. 2024 Aug;132(8):87005. doi: 10.1289/EHP13356. Epub 2024 Aug 14. Environ Health Perspect. 2024. PMID: 39140734 Free PMC article.
-
A review of cardiovascular effects and underlying mechanisms of legacy and emerging per- and polyfluoroalkyl substances (PFAS).Arch Toxicol. 2023 May;97(5):1195-1245. doi: 10.1007/s00204-023-03477-5. Epub 2023 Mar 22. Arch Toxicol. 2023. PMID: 36947184 Review.
References
-
- Agency for Toxic Substances and Disease Registry, 2000. Toxicological Profile for Polychlorinated Biphenyls (PCBs). https://www.atsdr.cdc.gov/toxprofiles/tp17.pdf - PubMed
-
- Anderko L, Pennea E, Chalupka S, 2019. Per- and Polyfluoroalkyl Substances: An Emerging Contaminant of Concern. Annu. Rev. Nurs. Res, 38, 159–182. - PubMed
-
- Berenbaum MC, 1989. What is synergy? Pharmacol. Rev, 41, 93–141. - PubMed
Publication types
MeSH terms
Substances
Grants and funding
LinkOut - more resources
Full Text Sources
Medical
Miscellaneous
