. 2020 Nov:61:103058.
doi: 10.1016/j.ebiom.2020.103058. Epub 2020 Oct 21.

Novel PGK1 determines SKP2-dependent AR stability and reprograms granular cell glucose metabolism facilitating ovulation dysfunction

Affiliations

Novel PGK1 determines SKP2-dependent AR stability and reprograms granular cell glucose metabolism facilitating ovulation dysfunction

Xia Liu et al. EBioMedicine. 2020 Nov.

Abstract

Background: Disordered folliculogenesis is a core characteristic of polycystic ovary syndrome (PCOS) and androgen receptors (ARs) are closely associated with hyperandrogenism and abnormalities in folliculogenesis in PCOS. However, whether the new AR binding partner phosphoglycerate kinase 1 (PGK1) in granulosa cells (GCs) plays a key role in the pathogenesis of PCOS remains unclear.

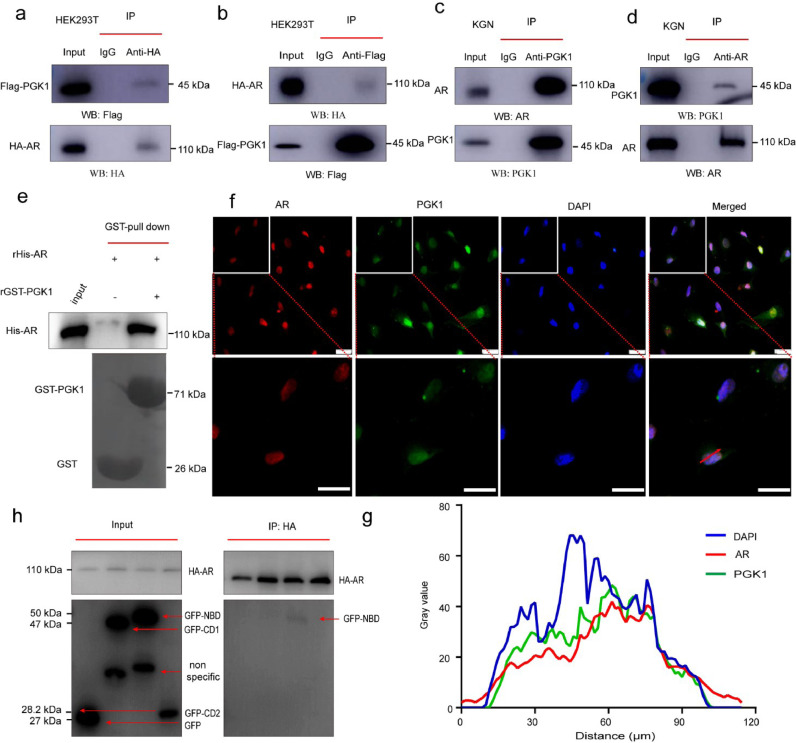
Methods: We identified the new AR binding partner PGK1 by co-IP (co-immunoprecipitation) in luteinized GCs, and reconfirmed by co-IP, co-localization and GST pull down assay, and checked PGK1 expression levels with qRT-PCR and western blotting. Pharmaceuticals rescue assays in mice, and metabolism assay, AR protein stability and RNA-seq of PGK1 targets in cells proved the function in PCOS.

Findings: PGK1 and AR are highly expressed in PCOS luteinized GCs and PCOS-like mouse ovarian tissues. PGK1 regulated glucose metabolism and deteriorated PCOS-like mouse metabolic disorder, and paclitaxel rescued the phenotype of PCOS-like mice and reduced ovarian PGK1 and AR protein levels. PGK1 inhibited AR ubiquitination levels and increased AR stability in an E3 ligase SKP2-dependent manner. Additionally, PGK1 promoted AR nuclear translocation, and RNA-seq data showed that critical ovulation-related genes were regulated by the PGK1-AR axis.

Interpretation: PGK1 regulated GCs metabolism and interacted with AR to regulate the expression of key ovulation genes, and also mediated cell proliferation and apoptosis, which resulted in the etiology of PCOS. This work highlights the pathogenic mechanism and represents a novel therapeutic target for PCOS.

Funding: National Key Research and Development Program of China; National Natural Science Foundation of China grant.

Keywords: Androgen receptor; Glucose metabolism; PCOS; Phosphoglycerate kinase 1; Ubiquitin ligase skp2.


Conflict of interest statement

Declaration of Competing Interest The authors declare that they have no competing interests.

Figures

Fig 1
Fig. 1
PGK1 is a new binding partner for AR, and PGK1 and AR protein levels are highly expressed in human PCOS luteinized granulosa cells. (a) Clinical luteinized granulosa cells (GCs) were used for a co-immunoprecipitation (co-IP) assay, with an AR antibody, and the proteins were separated by 10% SDS/PAGE, followed by Coomassie staining. Next, the gel was cut into strips containing the proteins of interest, treated with trypsin digestion, and analysed by LC-MS/MS. (b) Mass spectroscopy identified PGK1 as a new protein partner of the AR protein. (c) The relative expression level of PGK1 mRNA in human luteinized GCs from the Control (n = 36) and PCOS groups (n = 44). Data are expressed as the mean ± SE. The p values were calculated by an unpaired two-tailed Student's t-test compared with controls. (d) Correlation analysis between the relative expression levels of PGK1 mRNA and serum testosterone (TT) levels among patients (r = 0.5017, p < 0.0001, n = 80). (e) Correlation analysis between the relative expression levels of PGK1 mRNA and the ratio of serum LH (luteinizing hormone) to FSH (follicle stimulating hormone) among patients (r = 0.2611, p = 0.0193, n = 80). (f-g) PGK1 and AR protein were detected by western blotting analysis in human luteinized GCs from patients in the Control and PCOS (n = 4 per group). The protein expression levels of PGK1 and AR were statistically analysed. Data are expressed as the mean ± SE. The p values were calculated by an unpaired two-tailed Student's t-test compared with controls.
Fig 2
Fig. 2
PGK1 is upregulated in PCOS-like model mice and returns to normal levels after PTX treatment. (a) Continuous monitoring of the oestrus stage in the mice in three groups (Ctrl, DHEA, and DHEA+PTX). (b) Representative images of H&E-stained mouse ovaries for the indicated groups. * shows corpus luteum and # shows cystic follicles. Scale bar: 200 µm. (c) The number of embryos was analysed, and the data are expressed as the mean ± SE (n = 5 per group). (d) PGK1 and AR were detected by western blotting analysis in mouse ovaries from the indicated groups (n = 3 per group). The protein expression levels of PGK1 and AR were analysed, and the data are expressed as the mean ± SE. (e) Representative images of immunohistochemical staining, using PGK1- and AR-specific antibodies, of mouse ovaries from the indicated groups (n = 5 per group). Data are expressed as the mean ± SE. Scale bars in the original and enlarged images are 200 µm and 50 µm, respectively. (f) Representative images of immunohistochemical staining, using the indicated specific antibodies for c-Fos, p-c-Fos, c-Jun and p-c-Jun, of mouse ovaries from the indicated groups (n = 5 per group). Data are expressed as the mean ± SE. Scale bar: 50 µm. (g) Representative images of TUNEL assay results in mouse ovaries from the indicated groups (n = 3 per group). Scale bar: 200 µm. (h) Representative images of immunohistochemical staining, using Ki-67-specific antibodies, of mouse ovaries from the indicated groups (n = 3 per group). Scale bar: 100 µm. The statistical data were analysed by an unpaired two-tailed Student's t-test compared with controls.
Fig 3
Fig. 3
PGK1 mediates glucose metabolism in cells and aggravates PCOS-like mouse metabolic disorder. (a) Glucose levels in shPGK1 (PGK1 knockdown) and OE-PGK1 (PGK1 overexpression) KGN cells compared with Ctrl (control) KGN cells, n = 4. (b) Relative lactate levels in shPGK1 and OE-PGK1 KGN cells compared with Ctrl, n = 4. (c-d) Extracellular acidification rates (ECARs) and oxygen consumption rates (OCRs) in shPGK1 and Ctrl KGN cells. Data are expressed as the mean ± SE. Statistical analysis was performed using an unpaired two-tailed Student's t-test (*p < 0.05, ** p < 0.01). (e) Weight curves for Ctrl (control), PCOS (PCOS-like model mice), and PCOS+PTX (PCOS-like model mice treated with PTX) mice were recorded from 4 weeks to 16 weeks of age, n = 8. (f) Area under the curve (AUC) analysis of the three groups. (g) Homeostasis model assessment-insulin resistance (HOMA-IR) was analysed based on fasting blood glucose and insulin levels, n = 5. (h-k) Glucose tolerance tests and AUCs were assessed for the three groups, n = 5. (i-m) Insulin tolerance test and AUCs for mice in the three groups, n = 5. (n-o) Serum insulin levels after 30 min of fasting and the fold changes in serum insulin levels after glucose injection, n = 5. (p-q) Cumulative food intake over 24 h, and cumulative food intake normalised to body weight, n = 3. (r-s) Consumed O2 was measured in the three groups during light and dark phases; the histogram represents the mean ± SE of three mice per group. (t-u) RER was measured during light and dark phases; the histogram represents the mean ± SE of three mice per group. Three treatment groups of mice: Ctrl (control), PCOS (PCOS-like model mice), and PCOS+PTX (PCOS-like model mice treated with PTX). Statistical analysis was performed by an unpaired two-tailed t-test compared with relevant controls.
Fig 4
Fig. 4
PGK1 interacts with AR, both in vitro and in vivo. (a-b) HEK293T cells were transfected with HA-AR and Flag-PGK1. The immunoprecipitation interaction assay between HA-AR and Flag-PGK1 was performed by western blotting analysis. The input was used as the positive control and IgG was used as the negative control. (c-d) The endogenous immunoprecipitation interaction assay between PGK1 and AR was performed in KGN cells, and analysed by western blotting. The input was used as the positive control and IgG was used as the negative control. (e) PGK1 binding to AR in vitro, using the GST pull-down assay. The control GST and GST-PGK1 fusion protein were purified with GST-agarose, after being mixed with purified His-AR protein and the interaction was detected by western blotting. (f) Immunofluorescence images of KGN cells illustrate that PGK1 (green) co-localizes with AR (red) in the nucleus. Nuclear DNA was counterstained with DAPI (blue). Scale bars: 200 µm. (g) Line scans of a cell co-stained against PGK1, AR, and DNA, at the position shown by the arrow. (h) An immunoprecipitation assay performed in HEK293T cells showed that AR primarily interacts with the PGK1 NBD domain.
Fig 5
Fig. 5
PGK1 promotes AR translocation into the nucleus and increases AR stability, which depends on the E3 ubiquitin ligase SKP2. (a) Screening and validation of the knockdown shRNA of PGK1 by western blotting. (b) Total PGK1 and AR proteins were detected by western blotting analysis after KGN cells were treated with shPGK1. (c) Nuclear-localized PGK1 and AR proteins were detected by western blotting analysis after KGN cells were treated with shPGK1. (d) The immunofluorescence assay shows that PGK1 promotes AR translocation into the nucleus, in a DHT-dependent manner. KGN cells were fixed with 4% paraformaldehyde and stained with PGK1 and AR antibodies. DAPI was used to stain the nucleus. Scale bars: 200 µm. (e) Western blotting analysis was used to detect total protein expression levels in HEK293T cells transfected with HA-AR and either Flag-vector or Flag-PGK1. (f) Total PGK1 and AR proteins were detected by western blotting analysis in KGN cells treated with shCtrl or shPGK1. (g) The total AR and PGK1 proteins in KGN cells were analysed by western blotting analysis. The cells were treated with PGK1 shRNA, followed by either cycloheximide or MG132, at the indicated time points. (h) GSEA analysis of the ubiquitin mediated proteolysis pathway in KGN cells treated with shPGK1 compared to Control (shCtrl). (i) AR polyubiquitination was detected by western blotting. HA or HA-PGK1, Flag-AR, and HA-Ub were transfected into HEK293T cells. (j) Primary enrichment genes associated with the ubiquitin-regulated proteolysis pathway were identified in shPGK1 treated KGN cells. The arrow indicates that SKP2 was increased in PGK1 knockdown cells. (k) KGN cells were transfected with PGK1 or si-SKP1, and the total protein levels for AR, PGK1, and SKP2 were analysed by western blotting.
Fig 6
Fig. 6
PGK1 regulates AR transcriptional activity and ovulation-related gene expression in KGN cells. (a-b) Volcano plot and heatmap showing differentially expressed genes between shCtrl+DHT and shPGK1+DHT. (c) Venn diagram comparing the differentially expressed genes identified between shCtrl and shPGK1, and between shCtrl+DHT and shPGK1+DHT. (d) Heatmap showing the differentially expressed genes dependent on DHT and regulated by PGK1. (e) Venn diagram comparing the differentially expressed genes identified between shCtrl+DHT and shPGK1+DHT with AR target genes. (f) Network of differentially expressed AR target genes regulated by PGK1. Red indicates upregulation and blue indicates downregulation. (g) Venn diagram comparing the differentially expressed genes identified between shCtrl+DHT and shPGK1+DHT with ovulation-related genes. (h) Heatmap showing ovulation-related genes regulated by PGK1. (i) Venn diagram showing the key ovulation-related genes regulated by the PGK1-AR axis. (j) The expression levels of MAP2K6, KLF15, LRIG3 and MYOF were confirmed by real-time qPCR following DHT treatment in KGN cells (n = 3). (k) The expression levels of MAP2K6, KLF15, LRIG3 and MYOF were verified by real-time qPCR in the ovaries of the Ctrl (control), PCOS (PCOS-like model mice), and PCOS+PTX (PCOS-like model mice treated with PTX) mice (n = 3).Statistical analysis was performed by an unpaired two-tailed t-test compared with relevant controls.
Fig 7
Fig. 7
PGK1 inhibits apoptosis and enhances cell proliferation. (a-b) Representative images of TUNEL assays in indicated KGN cells. Scale bar: 300 µm. Data are presented as the mean ± SE, n = 3. There were four treatment groups for cells, shCtrl: shRNA control; shPGK1: PGK1 shRNA; Ctrl+DHT: shCtrl treated with DHT for 24 hrs; and shPGK1+DHT: shPGK1 treated with DHT for 24 hrs. (c-d) c-cas9, cas9, Bcl2 and Bax were detected by western blotting analysis following the indicated treatments in KGN cells. Data are presented as the mean ± SE, n = 3. (e) Cell Counting Kit-8 assays were performed following the indicated treatments in KGN cells (n = 3). (f-g) Representative images and the quantification of cell colonies in indicated KGN cells. Scale bar: 1 cm. Data are presented as the mean ± SE, n = 3. (h-i) Representative images and the quantification of BrdU (+) in indicated cells. Scale bar: 200 µm. Data are presented as the mean ± SE, n = 3.Statistical analysis was performed by an unpaired two-tailed t-test compared with relevant controls.
Fig 8
Fig. 8
Proposed model of effect of the PGK1-AR axis during ovulatory dysfunction.

References

    1. Norman R.J., Dewailly D., Legro R.S., Hickey T.E. Polycystic ovary syndrome. Lancet. 2007;370(9588):685–697. - PubMed
    1. Escobar-Morreale H.F. Polycystic ovary syndrome: definition, aetiology, diagnosis and treatment. Nat Rev Endocrinol. 2018;14(5):270–284. - PubMed
    1. Tanos T., Marinissen M.J., Leskow F.C. Phosphorylation of c-Fos by members of the p38 MAPK family. Role in the AP-1 response to UV light. J. Biol. Chem. 2005;280(19):18842–18852. - PubMed
    1. Sharma S.C., Richards J.S. Regulation of AP1 (Jun/Fos) factor expression and activation in ovarian granulosa cells. Relation of JunD and Fra2 to terminal differentiation. J. Biol. Chem. 2000;275(43):33718–33728. - PubMed
    1. Angel P., Karin M. The role of Jun, Fos and the AP-1 complex in cell-proliferation and transformation. Biochim. Biophys. Acta. 1991;1072(2–3):129–157. - PubMed

MeSH terms