. 2020 Oct 21;13(10):323.
doi: 10.3390/ph13100323.

Novel Sulfonamide-Based Analogs of Metformin Exert Promising Anti-Coagulant Effects without Compromising Glucose-Lowering Activity

Affiliations

Novel Sulfonamide-Based Analogs of Metformin Exert Promising Anti-Coagulant Effects without Compromising Glucose-Lowering Activity

Magdalena Markowicz-Piasecka et al. Pharmaceuticals (Basel). .

Abstract

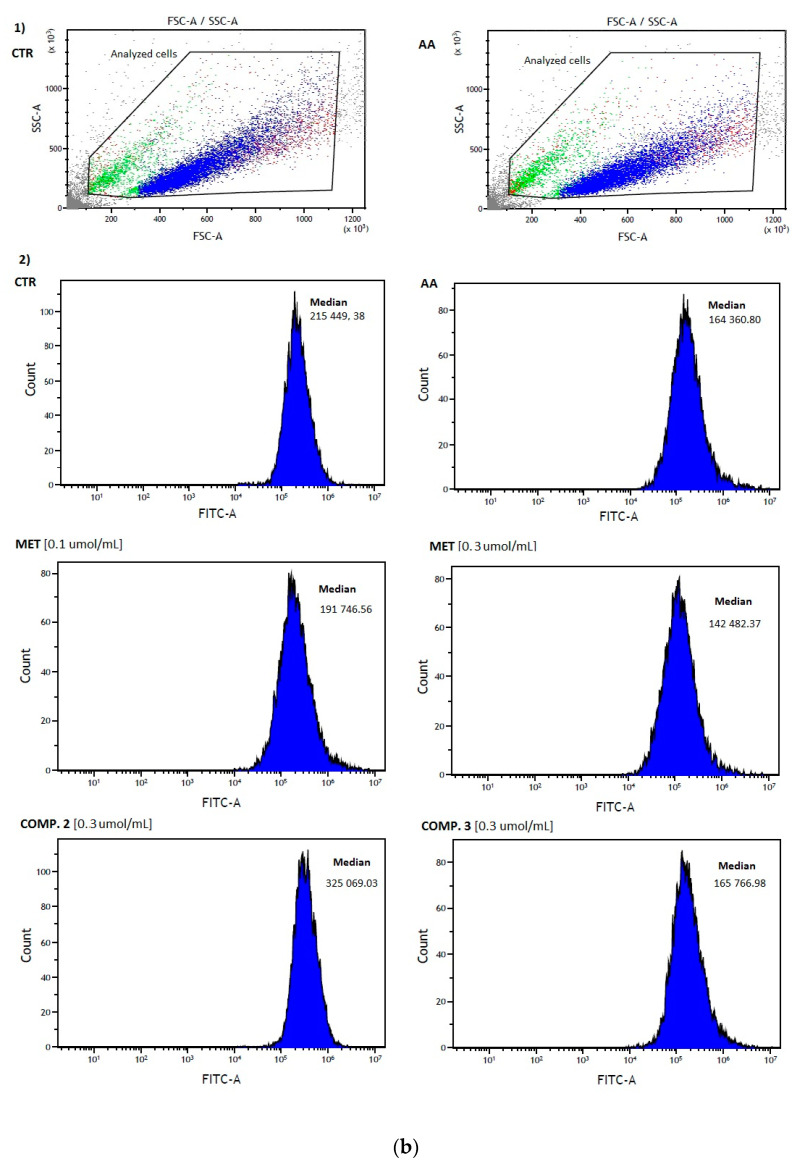
Metformin, one of the most frequently prescribed oral anti-diabetic drugs, is characterized by multidirectional activity, including lipid lowering, cardio-protective and anti-inflammatory properties. This study presents synthesis and stability studies of 10 novel sulfonamide-based derivatives of metformin with alkyl substituents in the aromatic ring. The potential of the synthesized compounds as glucose-lowering agents and their effects on selected parameters of plasma and vascular hemostasis were examined. Compounds with two or three methyl groups in the aromatic ring (6, 7, 9, 10) significantly increased glucose uptake in human umbilical vein endothelial cells (HUVECs), e.g., 15.8 µmol/L for comp. 6 at 0.3 µmol/mL versus 11.4 ± 0.7 µmol/L for control. Basic coagulation studies showed that all examined compounds inhibit intrinsic coagulation pathway and the process of fibrin polymerization stronger than the parent drug, metformin, which give evidence of their greater anti-coagulant properties. Importantly, synthesized compounds decrease the activity of factor X, a first member of common coagulation pathway, while metformin does not affect coagulation factor X (FX) activity. A multiparametric clot formation and lysis test (CL-test) revealed that the examined compounds significantly prolong the onset of clot formation; however, they do not affect the overall potential of clot formation and fibrinolysis. Erythrotoxicity studies confirmed that none of the synthesized compounds exert an adverse effect on erythrocyte integrity, do not contribute to the massive hemolysis and do not interact strongly with the erythrocyte membrane. In summary, chemical modification of metformin scaffold into benzenesulfonamides containing alkyl substituents leads to the formation of potential dual-action agents with comparable glucose-lowering properties and stronger anti-coagulant activity than the parent drug, metformin.

Keywords: biguanide; coagulation; endothelium; hemostasis; metformin.


Conflict of interest statement

The authors declare no conflict of interest. The funders had no role in the design of the study; in the collection, analyses or interpretation of data; in the writing of the manuscript, or in the decision to publish the results.

Figures

Scheme 1
Scheme 1
Synthetic route for metformin sulfonamide derivatives; (i) CH2Cl2/DMF, MW, 100 °C, 15 min, 42–77%.
Figure 1
Figure 1
Effects of metformin and synthesized compounds 110, and ᴅ-glucose on the 2-NBDG (2-(N-(7-Nitrobenz-2-oxa-1,3-diazol-4-yl)Amino)-2-Deoxyglucose) uptake in human umbilical vein endothelial cells (HUVEC) cells. The cells were treated with the tested compounds for 24 h prior to the experiments. On the day of the experiment the cells were glucose-starved for 2 h, then incubated with insulin (30 min), and in sequence with 2-NBDG for 45 min. The results are presented as mean ± SD, n = 4–6. Significant differences in glucose uptake are denoted with asterisk; ** p < 0.01, *** p < 0.001.
Figure 2
Figure 2
Effects of synthesized compounds 110 on the hemolysis of erythrocytes. Positive control was Triton X-100, which constituted 100% hemolysis. The results are presented as mean ± S.D.; n = 4, * denotes significant differences compared to control (* p < 0.05; ** p < 0.01; *** p < 0.001). Exposure to all compounds at 1.5 μmol/mL contributed to a significant increase in erythrocyte hemolysis; however, in most cases this value did not exceed 5%. In our previous study [22], metformin was not found to significantly affect RBC (red blood cell) hemolysis.
Figure 3
Figure 3
(A,B). Effects of synthesized compounds 110 on erythrocytes morphology. Representative phase-contrast images are shown (magnification of 400 times), echinocytes are marked with black arrows, ovalocytes are marked with black dashed arrows and stomatocytes are marked with red arrows. In these studies, metformin was used as a reference compound. It was found to induce the formation of echinocytes. At higher concentrations (1.5 μmol/mL), RBC membrane deformability could also be observed which might be attributed to eryptosis (Figure S2, Supplementary Materials).
Figure 4
Figure 4
Inhibition of cell migration in the presence of selected compounds (metformin, compounds 13, 6, 10). HUVEC cell migration was evaluated using wound healing assay performed in the JuLiStage system. Graphs depict changes of the wound width [µm] during 24 h in the absence (control) and in the presence of examined compounds at 0.5 μmol/mL. The results are presented as mean ± SD (n = 4–8). * p < 0.05 compared with control.
Figure 5
Figure 5
Effects of sulfonamides 2, 3, 4, 6, and 10 on the overall potential of clot formation and fibrinolysis (CLAUC), and selected parameters of clot formation and fibrinolysis process: maximum clotting (Fmax); initial plasma clotting velocity (Fvo); initial clot fibrinolysis velocity (Lvo). The results are presented as mean ± standard deviation (SD), n = 5–6. * denotes significant difference (p < 0.05) between the sample with tested compound and respective controls. In our previous study metformin was found to not affect the overall potential of clot formation and fibrinolysis (CLAUC) over the entire concentration range. Metformin also did not influence the kinetic parameters of the process (Fmax, Fvo, Lvo constans) [22].
Figure 6
Figure 6
Effects of selected compounds (2, 3, 4, 6 and 10) on the activity of factor X (data are presented as mean ± SD; n = 4–5) after 1-min incubation with plasma deficient factor X; final volume 210 µL. The asterisk denotes a statistically significant difference between the samples treated with compounds and respective controls; * p < 0.05, ** p < 0.01, *** p < 0.001. All tested compounds at the highest concentration decreased the activity of factor X.
Figure 7
Figure 7
Effects of selected biguanides on the production of intracellular reactive oxygen species. The experiments were performed using 2′,7′-dichlorodihydrofluorescein diacetate (H2DCFDA), a fluorescent indicator for ROS in cells. The fluorescence of stained HUVECs was measured by flow cytometry. (a) Summary of the effects of metformin, compound 2, 3, 4, 6 and 10 on the H2DCFDA fluorescence in viable HUVEC cells. The results are presented as median ± range, n = 3). The asterisk denotes a statistically significant difference in comparison to control, * p < 0.05. Ascorbic acid (AA) was used as a reference compound; (b) Flow cytometry analysis of the intracellular fluorescence in HUVECs. (a) Representative histograms of unstimulated HUVECs (control), and HUVECs treated with ascorbic acid (0.1 µmol/mL)—forward and side scatter plot of HUVECs; the analyzed cells are gathered in black frame. (b) Representative cytograms of analyzed cells treated with metformin (0.1 and 0.5 µmol/mL), and compounds 2 and 3 (0.5 µmol/mL). Median fluorescence intensity of analyzed cells is indicated in every cytogram.
Figure 7
Figure 7
Effects of selected biguanides on the production of intracellular reactive oxygen species. The experiments were performed using 2′,7′-dichlorodihydrofluorescein diacetate (H2DCFDA), a fluorescent indicator for ROS in cells. The fluorescence of stained HUVECs was measured by flow cytometry. (a) Summary of the effects of metformin, compound 2, 3, 4, 6 and 10 on the H2DCFDA fluorescence in viable HUVEC cells. The results are presented as median ± range, n = 3). The asterisk denotes a statistically significant difference in comparison to control, * p < 0.05. Ascorbic acid (AA) was used as a reference compound; (b) Flow cytometry analysis of the intracellular fluorescence in HUVECs. (a) Representative histograms of unstimulated HUVECs (control), and HUVECs treated with ascorbic acid (0.1 µmol/mL)—forward and side scatter plot of HUVECs; the analyzed cells are gathered in black frame. (b) Representative cytograms of analyzed cells treated with metformin (0.1 and 0.5 µmol/mL), and compounds 2 and 3 (0.5 µmol/mL). Median fluorescence intensity of analyzed cells is indicated in every cytogram.

Similar articles

Cited by

References

    1. Iqbal N. Imatinib: A Breakthrough of Targeted Therapy in Cancer. Chemother. Res. Pract. 2014;2:357027. doi: 10.1155/2014/357027. - DOI - PMC - PubMed
    1. Giulianotti M.A., Welmaker G.S., Houghten R.A. Shifting from the single to the multitarget paradigm in drug discovery. Drug Disc. Today. 2013;18:495–501. - PMC - PubMed
    1. Apaydın S., Török M. Sulfonamide derivatives as multi-target agents for complex diseases. Bioorg. Med. Chem. Lett. 2019;29:2042–2050. doi: 10.1016/j.bmcl.2019.06.041. - DOI - PubMed
    1. Soma P., Pretorius E. Interplay between ultrastructural findings and atherothrombotic complications in type 2 diabetes mellitus. Cardiovasc. Diabetol. 2015;14:96. doi: 10.1186/s12933-015-0261-9. - DOI - PMC - PubMed
    1. Karim S., Shamima Akter F., Jahan Q., Khanom S., Haque A., Yeasmin S., Siddika T., Sinha T. Coagulation Impairment in Type 2 Diabetes Mellitus. J. Bangladesh Soc. Physiol. 2015;10:26–29. doi: 10.3329/jbsp.v10i1.24614. - DOI

LinkOut - more resources