. 2020 Oct 21;9(10):2333.
doi: 10.3390/cells9102333.

Tafazzin Mutation Affecting Cardiolipin Leads to Increased Mitochondrial Superoxide Anions and Mitophagy Inhibition in Barth Syndrome

Affiliations

Tafazzin Mutation Affecting Cardiolipin Leads to Increased Mitochondrial Superoxide Anions and Mitophagy Inhibition in Barth Syndrome

Patrice X Petit et al. Cells. .

Abstract

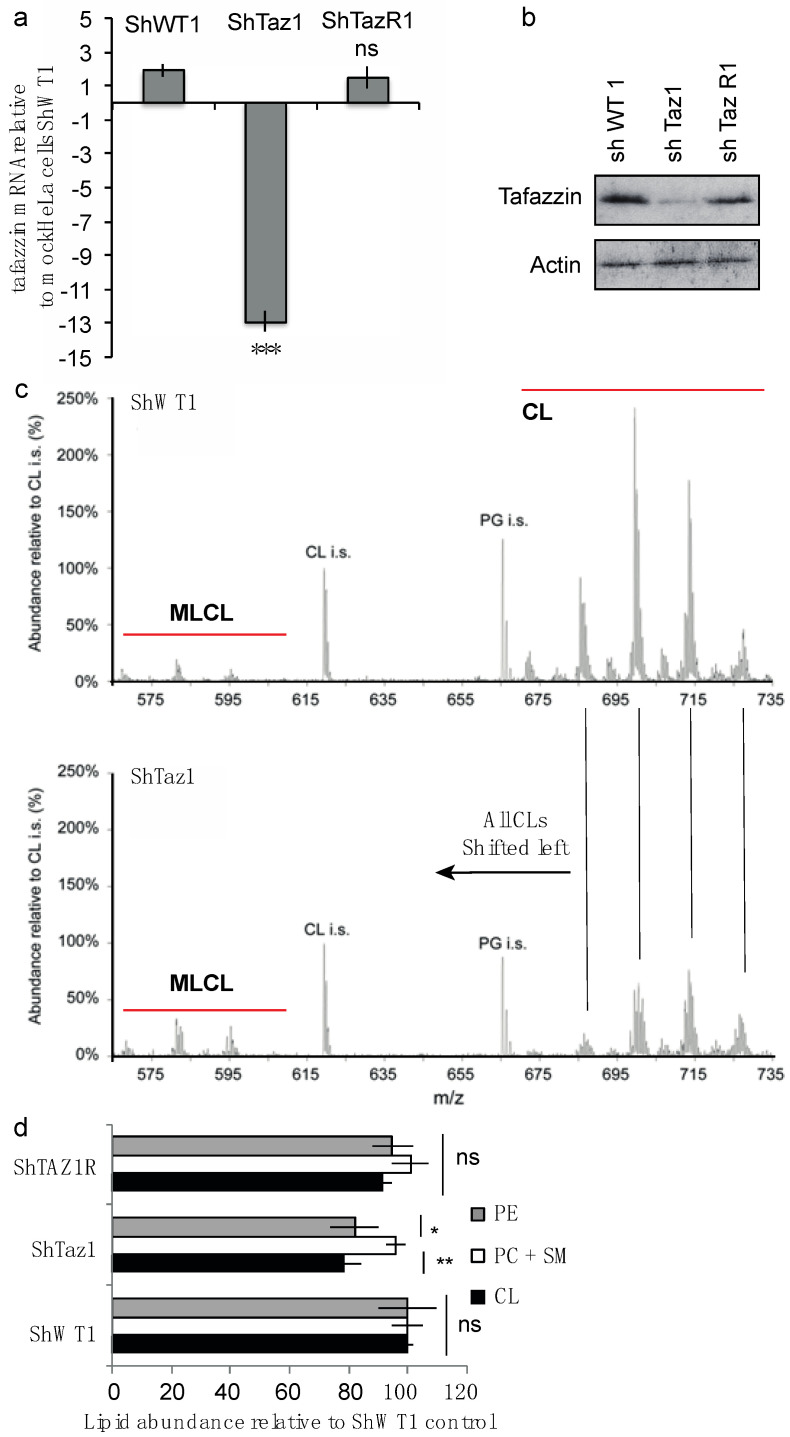
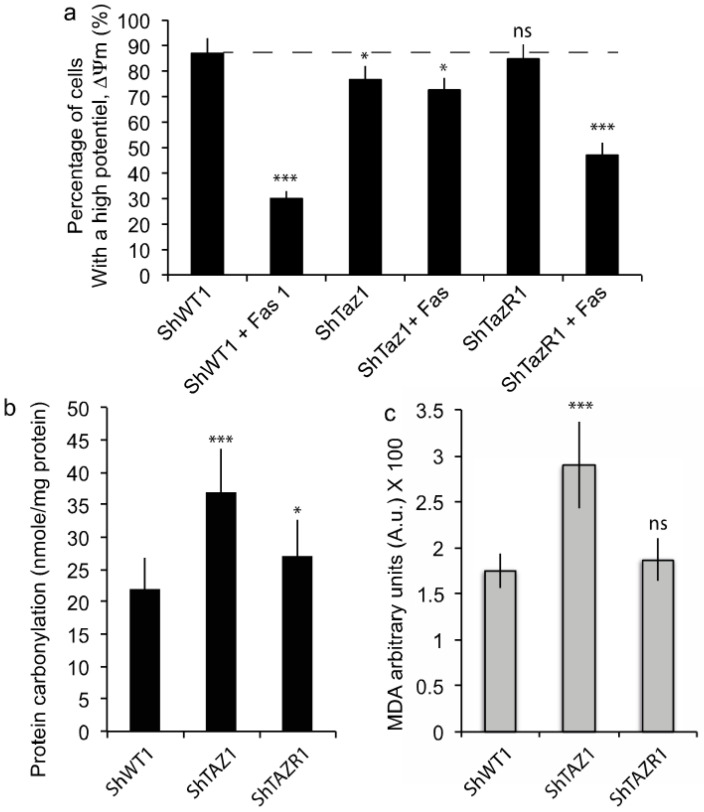
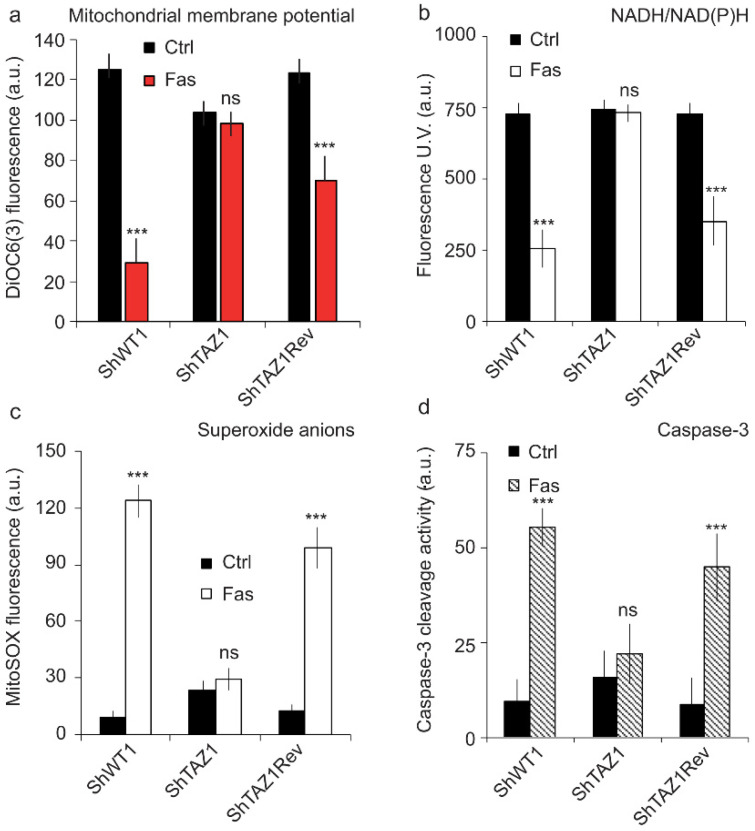
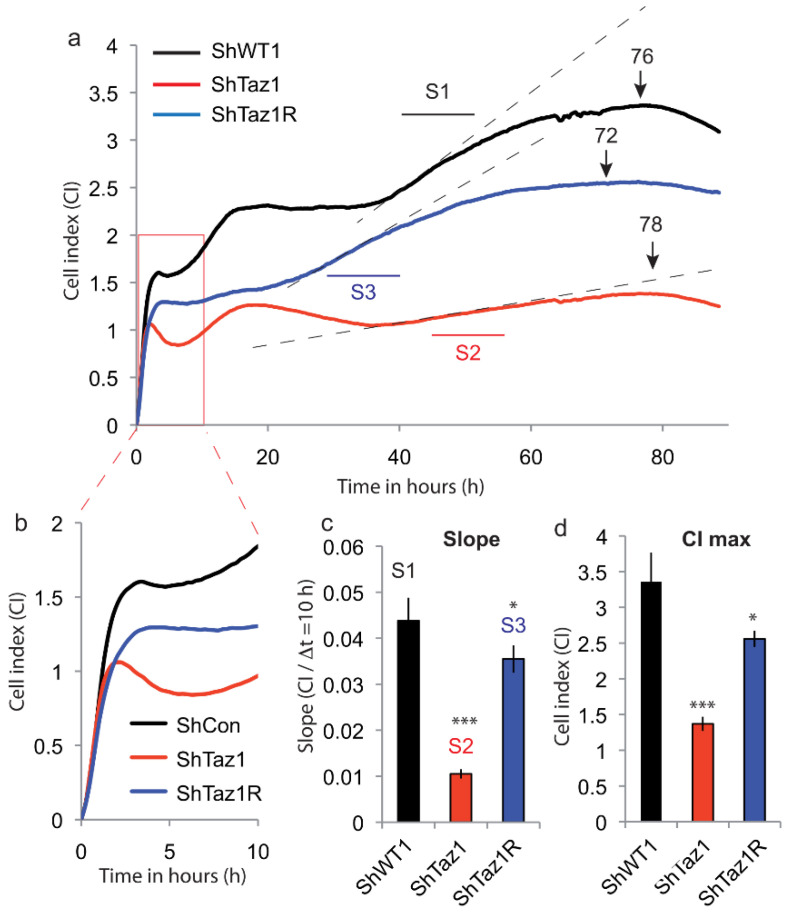
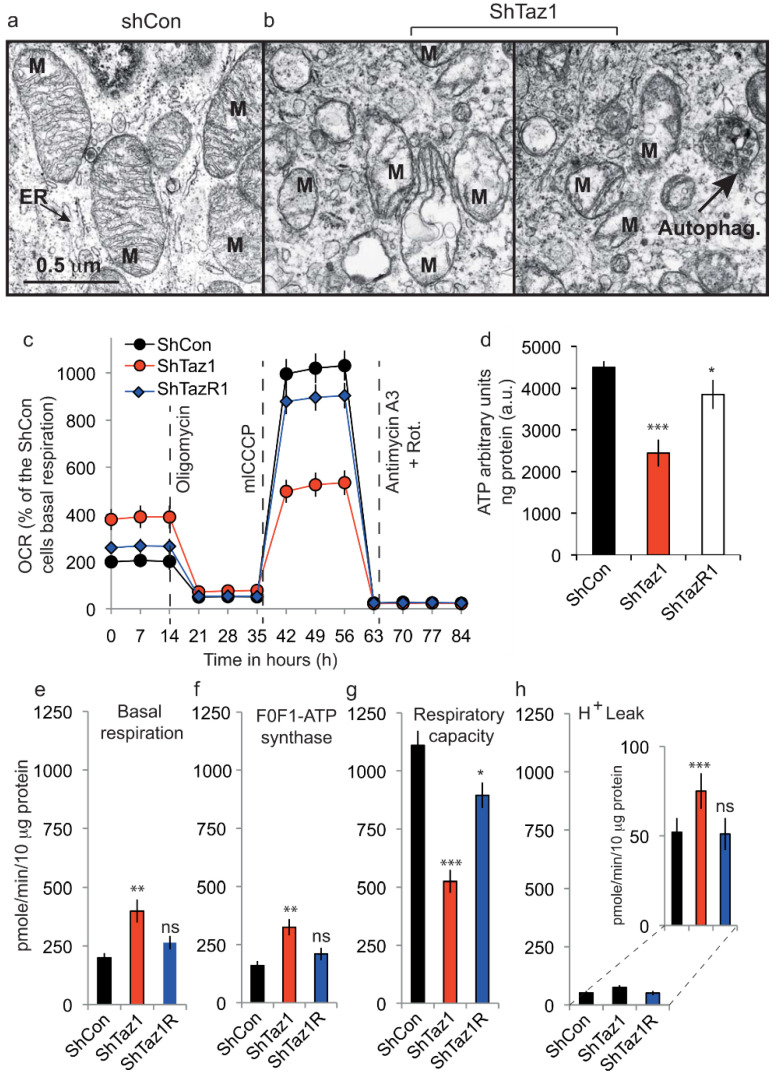
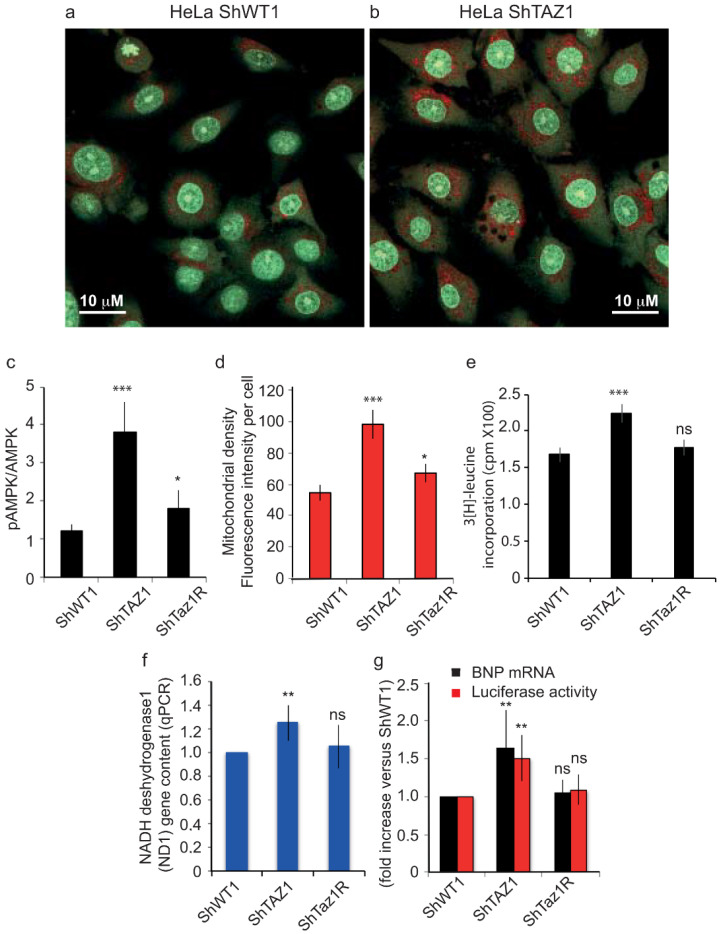
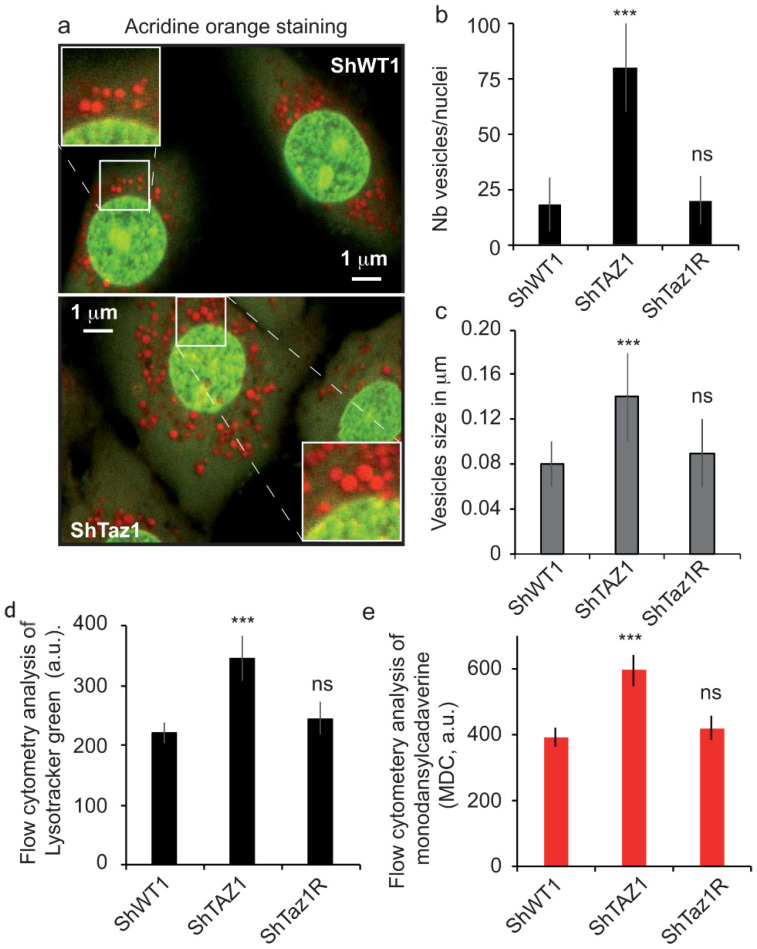
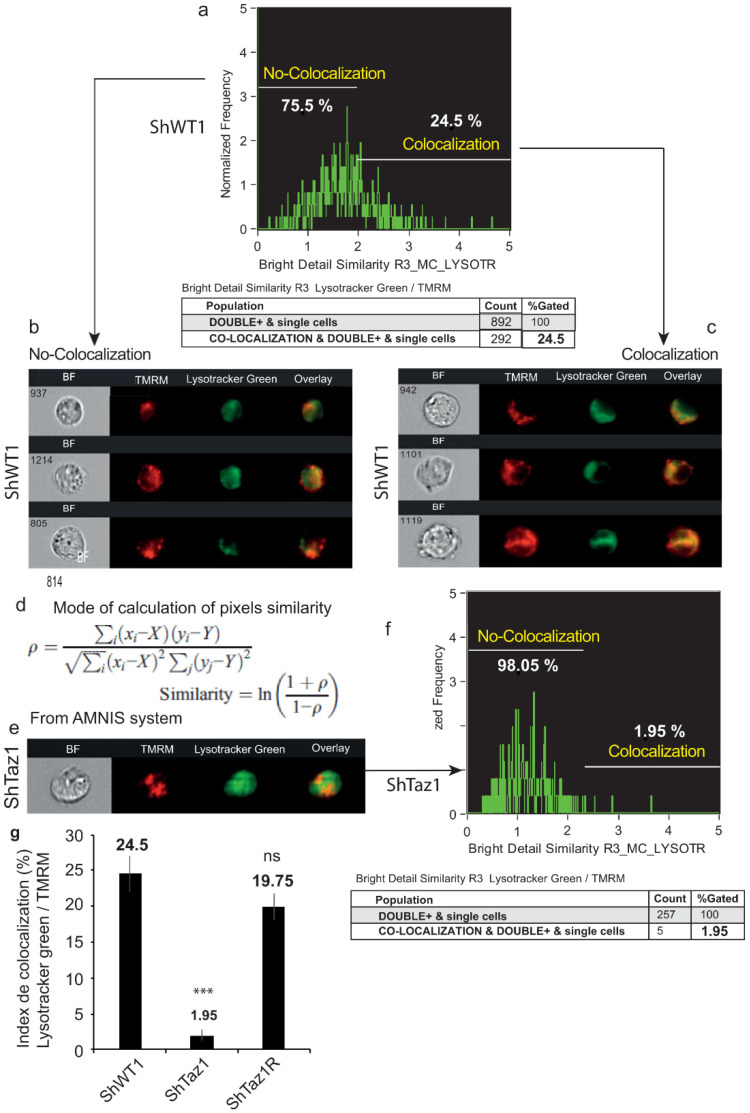
Tafazzin is a phospholipid transacylase that catalyzes the remodeling of cardiolipin, a mitochondrial phospholipid required for oxidative phosphorylation. Mutations of the tafazzin gene cause Barth syndrome, which is characterized by mitochondrial dysfunction and dilated cardiomyopathy, leading to premature death. However, the molecular mechanisms underlying the cause of mitochondrial dysfunction in Barth syndrome remain poorly understood. We again highlight the fact that the tafazzin deficiency is also linked to defective oxidative phosphorylation associated with oxidative stress. All the mitochondrial events are positioned in a context where mitophagy is a key element in mitochondrial quality control. Here, we investigated the role of tafazzin in mitochondrial homeostasis dysregulation and mitophagy alteration. Using a HeLa cell model of tafazzin deficiency, we show that dysregulation of tafazzin in HeLa cells induces alteration of mitophagy. Our findings provide some additional insights into mitochondrial dysfunction associated with Barth syndrome, but also show that mitophagy inhibition is concomitant with apoptosis dysfunction through the inability of abnormal mitochondrial cardiolipin to assume its role in cytoplasmic signal transduction. Our work raises hope that pharmacological manipulation of the mitophagic pathway together with mitochondrially targeted antioxidants may provide new insights leading to promising treatment for these highly lethal conditions.

Keywords: Barth syndrome; apoptosis; autophagy; cardiolipin; electron transport; mitochondria; tafazzin.


Conflict of interest statement

The authors declare no conflict of interest.

Figures

Figure 1
Figure 1
General biochemical characterization of the different cell lines (ShWT1; control, ShTaz1; Tafazzin knockdown and ShTazR1; Tafazzin revertant). (a) Measurement of tafazzin mRNA for each cell line (ShWT1, ShTaz1, and ShTazR1) relative to mock HeLa cells as control. Data show mean of 5 independent preparations ± SEM. For comparison one t test was performed. ns = no significant and *** is the p-value ≤ 0.001. (b) Western blot analysis of tafazzin in the ShWT1, ShTaz1, and ShTazR1 cells. (c) Lipid extracts from control and tafazzin knockdown HeLa cells were analyzed for the overall levels of CL, PE and PC together with sphingomyelin (PC + SM). (d) Lipid abundance relative to ShWT1 control? For comparison one t-test was performed. ns = no significant and * is the p-value ≤ 0.05 and ** is the p-value ≤ 0.01.
Figure 2
Figure 2
Biochemical characterization of Fas-induced apoptosis and the oxidative cellular context. (a) Fas-induced apoptosis is inhibited in ShTaz1 RNAi knockdown cells and the cell death process is restored in the revertant cells (ShTaz1R cells). The ± SEM is related to seven independent preparations. (b) Protein carbonylation measurements for ShWT1, ShTaz1 and ShTazR1 cells. (c) Malonaldehyde product ion measurements for ShWT1, ShTaz1 and ShTazR1 cells. ns = no significant and * is the p-value ≤ 0.05 and *** is the p-value ≤ 0.001.
Figure 3
Figure 3
Flow cytometric analysis of the “canonical” early events of apoptosis that are affected in the tafazzin mutant cells (ShThaz1). (a) Measurement of the mitochondrial membrane potential (ΔΨm) with DiOC6(3) in the three cell lines when treated with Fas. (b) Estimation of the NAD(P)H reduction (The fluorescent NADH and NADPH give rise to non-fluorescent NAD+ or NADP+) in the three cell lines when treated with Fas, which is concomitant with potential changes in the mitochondrial membrane, when they occur. (c) Measurement of the superoxide anions produced by the defective mitochondrial electron transport chain during Fas-induced apoptosis. (d) Caspase-3 activity associated with cytochrome c release from the mitochondria when Fas-induced apoptosis is occurring. ns = no significant and *** is the p-value ≤ 0.001.
Figure 4
Figure 4
Analysis of the cellular proliferation of the three lines (ShWT1, ShTaz1 and ShTazR1) by impedancemetry with the Xcelligence system (ACEA, Invitrogen). (a) The histogram represents the cell index (CI) versus time of proliferation (in h) of the three cell lines ShWT1, ShTaz1 and ShTaz1R. S1 to S3 are the slope measurements over 10 h for each proliferation curve. SWT1 in black, ShTaz1 in red and ShTaz1R in blue. The number on the top of the curve indicates the number of hours needed to reach peak proliferation for each cell line. (b) Cellular enlargement and the early phase of cell adhesion to the bottom of the wells for the three cell lines. (c) Histogram representation of the slope of cellular proliferation of the three cell lines. The slope is given as CI/Δt (recorded over ten hours between 50 and 60 h of cell culture). (d) Histogram representation of the maximum CI reached by the three cell lines at their peak proliferation. CI is in arbitrary units (a.u.). * is the p-value ≤ 0.05 and *** is the p-value ≤ 0.001.
Figure 5
Figure 5
Quantitation of mitochondrial functional parameters; electron microscopy and respiratory activity. (a,b) Electron microscopy of the ShWT1 and ShTaz1 cells. Left panel, ShWT1 (a) and ShTaz1 (b, the middle and right panel). In b, two electron microscopy pictures of the different types of mitochondria found for the ShTaz1 cells (middle and left panel). ER; Endoplasmic reticulum, M: Mitochondria; Autoph (indicated by the black arrow), autophagosomes enclosing part of the cytoplasm. (c) Analysis of the mitochondrial oxygen consumption rate (OCR) for the three cell lines in response to successive treatments with oligomycin (Oligo, 0.5 μM, an ATP synthase inhibitor), mClCCP (an uncoupler, 0.5 μM) and antimycin + rotenone (Rot) (0.5 μM, complex III inhibitor and for Rot 1 μM) with a Seahorse device XF24 flux analyzer. (e) Deduced by calculations from (d) Histogram representation of basal respiration. (f) Deduced by calculations from (d) Histogram representation of F0F1ATP synthase activity. (g) Deduced by calculations from (d) Histogram representation of maximal respiration capacity (h) Deduced by calculations from (d) Histogram representation of the proton leak (H+ leak). Since the H+ leak is small, there is an enlarged representation on another scale on the left of the primary histogram. In (eh), the activities are always measured in pmol/min/10 μg protein. ns = no significant and * is the p-value ≤ 0.05 and ** is the p-value ≤ 0.01 and *** is the p-value ≤ 0.001.
Figure 6
Figure 6
Tafazzin knockdown induces cellular hypertrophy and mitochondrial biogenesis. (a) and (b) Confocal images of the ShWT1 and ShTaz1 HeLa cells after staining with 5 μM AO as described in materials and methods. AO stains the nuclei (binds to DNA) and part of the cytoplasm in green (non-aggregated form) and also the acidic vesicles where it accumulates and because of its stacking is subject to a Stokes shift and is re-emitted in red (i.e., mainly the lysosomes and the autophagic vacuoles when present). * p < 0.05 vs. Control HeLa cells (ShWT1). (c) ShTaz1 knockdown cells as well as their revertant ShTAZR1 were treated and assayed for phospho-AMPK (p-AMPK) as described in materials and methods. p-AMPK was corrected for total AMPK and expressed as fold increase vs. ShWT1 control (arbitrarily set at 1). (d) Quantification of red fluorescence from TMRM staining on confocal images where the intensity per cell is taken into account. (e) ShTaz1 cells exhibited increased protein synthesis. HeLa cells were transduced with the shRNA adenovirus and labeled with 3[H]leucine as described in materials and methods. Protein synthesis is expressed as counts per minute (cpm) of 3[H]leucine incorporated. Data represent means ± SE from 4 separate experiments. From (c) to (g) the ± SEM is given on 6 independent preparations (f) Mitochondrial DNA content as assayed by NADH dehydrogenase 1 (ND1) gene content measured by RT-PCR (see materials and methods). (g) Increases expression of the hypertrophic marker brain natriuretic peptide (BNP). RT-PCR is used to detect the BNP mRNA. The BNP promoter was activated in tafazzin knockdown HeLa cells (ShWT1). ShWT1 cells were transfected with a luciferase reporter gene under the control of a BNP promoter and infected with shRNA adenovirus. The BNP promoter activity is detected by luciferase activity, expressed as fold increase vs. SCR control. ns = no significant and * is the p-value ≤ 0.05 and ** is the p-value ≤ 0.01 and *** is the p-value ≤ 0.001.
Figure 7
Figure 7
Confocal images and flow cytometry analysis of the acidic vesicles formed in the cytoplasm of control HeLa cells (ShWT1) and tafazzin knockdown cells (ShTaz1). (ac) Analysis of the three HeLa cell lines (ShWT1, ShTaz1 and ShTaz1R) stained with AO. (a) Acridine orange staining of the lysosomes and other acidic compartments. At the top, ShWT1 control cells and bottom, ShTaz1 tafazzin knockdown. (b) Histogram representation of the number of red vesicles per nucleus. Calculation from 10–20 image field as presented in Figure 6a,b. (c) Histogram representation of vesicle size in μM calculated in the same image fields as presented in Figure 6a,b. (d) Flow cytometry analysis of the accumulation of LysoTracker Green in arbitrary units (a.u.). (e) Flow cytometry analysis of staining by monodansylcadaverine (MDC, in arbitrary units). ns = no significant and *** is the p-value ≤ 0.001.
Figure 8
Figure 8
Image analysis of the co-localization of LysoTracker Green (lysosomes and acidic fusion vesicles) and the mitochondrial membrane potential dye, TMRM. (a) Colocalization based on brightness similarity and the corresponding histogram with 75.5% of the cells exhibiting different similarity indices, whereas 24.5% exhibit strict co-localization estimated by the similarity index. (b) Images of cells with similarity index < 2; no co-localization of the two probes. (c) Images of cells with similarity index > 2, which indicates co-localization of mitochondria in the acidic vesicles. (d) Method of calculation used to estimate the similarity index. (e,f) Analysis of ShTaz1 cells, which are deficient in tafazzin; (e) images and (f) curve of co-localization. (g) The co-localization index is reported on a histogram for the three cell types (ShWT1, ShTaz1, and ShTaz1R). ± SEM on 5 different preparations. ns = no significant and *** is the p-value ≤ 0.001.
Figure 9
Figure 9
Flow cytometry analysis of acridine orange staining and LC3 Western blot. (af) Flow cytometric analysis of AO staining for the three cell lines (ShWT1, ShTaz1, and ShTaz1R) as described in materials and methods when treated or not with rapamycin for 24 h. Green fluorescence when the AO molecules are free or bind to the DNA; red fluorescence in an acidic environment where the molecules form stacks (Stokes shift). The histograms of green and red fluorescence show the enhancement of the acidic compartment (red fluorescence), but also the death of cells, which usually lose their acidic vesicles and have a compacted DNA resulting in less green fluorescence (green fluorescence). (ac) Basal acidic vesicles/untreated cells (df) Cells treated with rapamycin (autophagy inducer) for 24 h. (g) Histogram representation of red fluorescence (mean values) in monitoring of acidic vesicle (lysosomes and certainly autophagosomes) statistics are given for 12 different preparations. (h) Western blot analysis of LC3 staining following basal, or rapamycin, or bafilomycin A3 treatment of the three cell lines (ShWT1, ShTaz1 and ShTaz1R). ns = no significant and *** is the p-value ≤ 0.001.

Similar articles

Cited by

References

    1. Barth P., Scholte H., Berden J., Moorsel J.V.D.K.-V., Luyt-Houwen I., Veer-Korthof E.V., Van Der Harten J., Sobotka-Plojhar M. An X-linked mitochondrial disease affecting cardiac muscle, skeletal muscle and neutrophil leucocytes. J. Neurol. Sci. 1983;62:327–355. doi: 10.1016/0022-510X(83)90209-5. - DOI - PubMed
    1. Clarke S.L., Bowron A., Gonzalez I.L., Groves S.J., Newbury-Ecob R., Clayton N., Martin R.P., Tsai-Goodman B., Garratt V., Ashworth M., et al. Barth syndrome. Orphanet J. Rare Dis. 2013;8:23. doi: 10.1186/1750-1172-8-23. - DOI - PMC - PubMed
    1. Christodoulou J., McInnes R.R., Jay V., Wilson G., Becker L.E., Lehotay D.C., Platt B.-A., Bridge P.J., Robinson B.H., Clarke J.T.R. Barth syndrome: Clinical observations and genetic linkage studies. Am. J. Med. Genet. 1994;50:255–264. doi: 10.1002/ajmg.1320500309. - DOI - PubMed
    1. Johnston J., Kelley R.I., Feigenbaum A., Cox G.F., Iyer G.S., Funanage V.L., Proujansky R. Mutation characterization and genotype-phenotype correlation in Barth syndrome. Am. J. Hum. Genet. 1997;61:1053–1058. doi: 10.1086/301604. - DOI - PMC - PubMed
    1. Ronvelia D., Greenwood J., Platt J., Hakim S., Zaragoza M.V. Intrafamilial variability for novel TAZ gene mutation: Barth syndrome with dilated cardiomyopathy and heart failure in an infant and left ventricular noncompaction in his great-uncle. Mol. Genet. Metab. 2012;107:428–432. doi: 10.1016/j.ymgme.2012.09.013. - DOI - PMC - PubMed

Publication types

MeSH terms

LinkOut - more resources