. 2020 Oct 21;20(20):5959.
doi: 10.3390/s20205959.

How to Use Heart Rate Variability: Quantification of Vagal Activity in Toddlers and Adults in Long-Term ECG

Affiliations

How to Use Heart Rate Variability: Quantification of Vagal Activity in Toddlers and Adults in Long-Term ECG

Helmut Karl Lackner et al. Sensors (Basel). .

Abstract

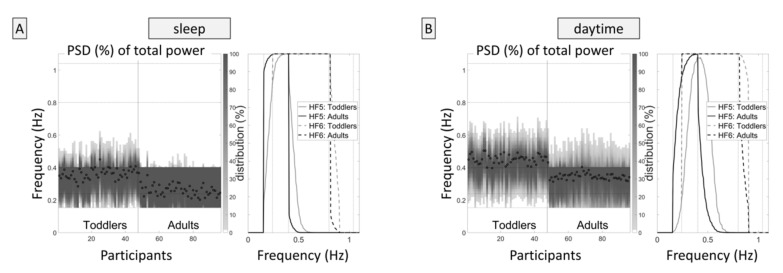
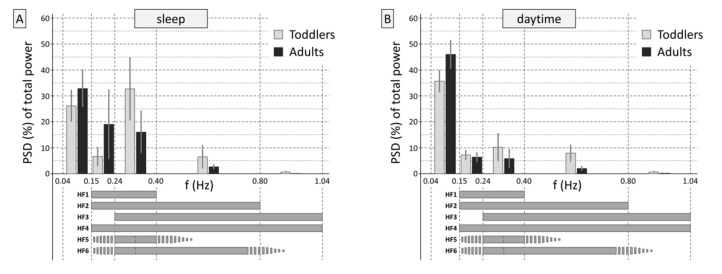
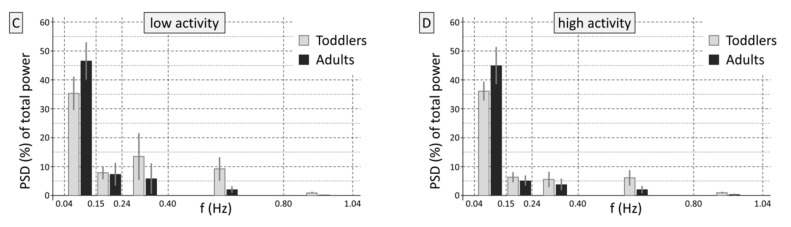
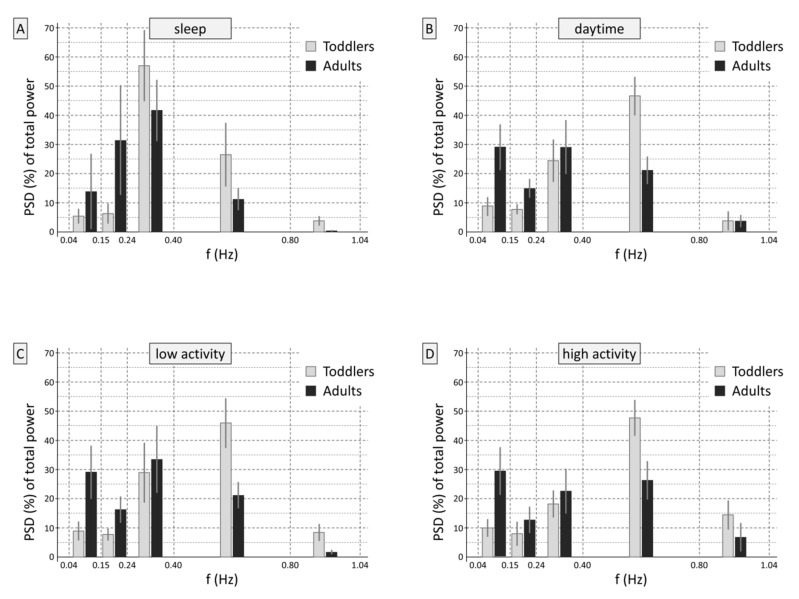
Recent developments in noninvasive electrocardiogram (ECG) monitoring with small, wearable sensors open the opportunity to record high-quality ECG over many hours in an easy and non-burdening way. However, while their recording has been tremendously simplified, the interpretation of heart rate variability (HRV) data is a more delicate matter. The aim of this paper is to supply detailed methodological discussion and new data material in order to provide a helpful notice of HRV monitoring issues depending on recording conditions and study populations. Special consideration is given to the monitoring over long periods, across periods with different levels of activity, and in adults versus children. Specifically, the paper aims at making users aware of neglected methodological limitations and at providing substantiated recommendations for the selection of appropriate HRV variables and their interpretation. To this end, 30-h HRV data of 48 healthy adults (18-40 years) and 47 healthy toddlers (16-37 months) were analyzed in detail. Time-domain, frequency-domain, and nonlinear HRV variables were calculated after strict signal preprocessing, using six different high-frequency band definitions including frequency bands dynamically adjusted for the individual respiration rate. The major conclusion of the in-depth analyses is that for most applications that implicate long-term monitoring across varying circumstances and activity levels in healthy individuals, the time-domain variables are adequate to gain an impression of an individual's HRV and, thus, the dynamic adaptation of an organism's behavior in response to the ever-changing demands of daily life. The sound selection and interpretation of frequency-domain variables requires considerably more consideration of physiological and mathematical principles. For those who prefer using frequency-domain variables, the paper provides detailed guidance and recommendations for the definition of appropriate frequency bands in compliance with their specific recording conditions and study populations.

Keywords: ECG derived respiration; Poincaré plot; artifact detection; autonomic nervous system; dynamic adaptation; methodological considerations; short-term variability; signal preprocessing; wearable biomedical sensing.


Conflict of interest statement

The authors declare no conflict of interest.

Figures

Figure 1
Figure 1
Dynamically adjusted frequency bands. The figure on the left side shows the distribution of the frequency ranges for each participant during sleep. (A), each column represents one participant. The shade of the columns represents the percentage of the power spectral density (PSD) in the respective frequency (percentage of the respective participant’s total power). The dots represent the respiration frequency of each participant (the arithmetic mean of all dots for toddlers equals the value given in Table 1, i.e., 0.36 Hz or 21.7 min−1). (B) shows the percentages of participants in whom variability in the respective frequencies was continuously present, that is, in all 180 s segments over the entire recording period, displayed for HF5 and HF6. The figure illustrates how well (or poorly) the frequency bands captured the actual heart rate variability in adults and toddlers: In the majority of adults, but not in toddlers, the dominant frequencies are in the recommended frequency range for short-term heart rate variability (HRV, 0.15–0.40 Hz). The right figure shows the dynamic frequency band adaptation for the day.
Figure 2
Figure 2
Prevalent frequency ranges (frequency domain). (A) shows the proportions of normalized high-frequency (HF) power in the frequency ranges of interest, which were averaged across participants and expressed as percentages of the total heart rate (HR) variability. Adding up the depicted values to HF1 (0.15–0.40 Hz, i.e., 2nd + 3rd column, see schematic bars below parts (A,B), HF2 (0.15–0.80 Hz), HF3 (0.24–1.04 Hz), and HF4 (0.15–1.04 Hz) provides an impression of the power spectral density estimates for these frequency bands, independently from the RRI level. Furthermore, the proportion of long-term variability can be seen in the low-frequency range (0.04–0.15 Hz). During sleep, the difference in the dominant HF frequency band between toddlers and adults—in toddlers 0.24–0.40 Hz—can be seen clearly. (B) shows the normalized HF power during the day, and (C,D) displays the separate analyses for periods with low and high levels of activity during the day.
Figure 2
Figure 2
Prevalent frequency ranges (frequency domain). (A) shows the proportions of normalized high-frequency (HF) power in the frequency ranges of interest, which were averaged across participants and expressed as percentages of the total heart rate (HR) variability. Adding up the depicted values to HF1 (0.15–0.40 Hz, i.e., 2nd + 3rd column, see schematic bars below parts (A,B), HF2 (0.15–0.80 Hz), HF3 (0.24–1.04 Hz), and HF4 (0.15–1.04 Hz) provides an impression of the power spectral density estimates for these frequency bands, independently from the RRI level. Furthermore, the proportion of long-term variability can be seen in the low-frequency range (0.04–0.15 Hz). During sleep, the difference in the dominant HF frequency band between toddlers and adults—in toddlers 0.24–0.40 Hz—can be seen clearly. (B) shows the normalized HF power during the day, and (C,D) displays the separate analyses for periods with low and high levels of activity during the day.
Figure 3
Figure 3
Prevalent frequency ranges in root mean square successive differences of R-R intervals (RMSSD)/SD1. (A) shows the proportions of normalized power for the time series of differences of successive R-R intervals in the frequency ranges of interest, which were averaged across participants and expressed as percentages of the total HR variability. Adding up the depicted values to HF1 (0.15–0.40 Hz), HF2 (0.15–0.80 Hz), HF3 (0.24–1.04 Hz), and HF4 (0.15–1.04 Hz) provides an impression of the power spectral density estimates for these frequency bands, independently from the RRI level. Furthermore, the proportion of long-term variability can be seen in the low-frequency range (0.04–0.15 Hz). During sleep, the difference in the dominant HF frequency band between toddlers and adults—in toddlers, 0.24–0.40 Hz—can be seen clearly. (B) shows the normalized HF power during the day, and (C,D) displays the separate analyses for periods with low and high levels of activity during the day. Please compare Figure 2 and Figure 3 to gain an impression of the high-pass filter effect of the calculation of RMSSD or SD1.

References

    1. Mohino-Herranz I., Gil-Pita R., Rosa-Zurera M., Seoane F. Activity Recognition Using Wearable Physiological Measurements: Selection of Features from a Comprehensive Literature Study. Sensors. 2019;19:5524. doi: 10.3390/s19245524. - DOI - PMC - PubMed
    1. Weippert M., Kumar M., Kreuzfeld S., Arndt D., Rieger A., Stoll R. Comparison of three mobile devices for measuring R–R intervals and heart rate variability: Polar S810i, Suunto t6 and an ambulatory ECG system. Eur. J. Appl. Physiol. 2010;109:779–786. doi: 10.1007/s00421-010-1415-9. - DOI - PubMed
    1. Shaffer F., Ginsberg J.P. An Overview of Heart Rate Variability Metrics and Norms. Front. Public Health. 2017;5:258. doi: 10.3389/fpubh.2017.00258. - DOI - PMC - PubMed
    1. Maestri R., Pinna G.D. POLYAN: A computer program for polyparametric analysis of cardio-respiratory variability signals. Comput. Methods Prog. Biomed. 1998;56:37–48. doi: 10.1016/S0169-2607(98)00004-2. - DOI - PubMed
    1. Perakakis P., Joffily M., Taylor M., Guerra P., Vila J. KARDIA: A Matlab software for the analysis of cardiac interbeat intervals. Comput. Methods Prog. Biomed. 2010;98:83–89. doi: 10.1016/j.cmpb.2009.10.002. - DOI - PubMed

LinkOut - more resources