. 2020 Oct 21;21(20):7800.
doi: 10.3390/ijms21207800.

Intranasal Administration of Mesenchymal Stem Cell Secretome Reduces Hippocampal Oxidative Stress, Neuroinflammation and Cell Death, Improving the Behavioral Outcome Following Perinatal Asphyxia

Affiliations

Intranasal Administration of Mesenchymal Stem Cell Secretome Reduces Hippocampal Oxidative Stress, Neuroinflammation and Cell Death, Improving the Behavioral Outcome Following Perinatal Asphyxia

Nancy Farfán et al. Int J Mol Sci. .

Abstract

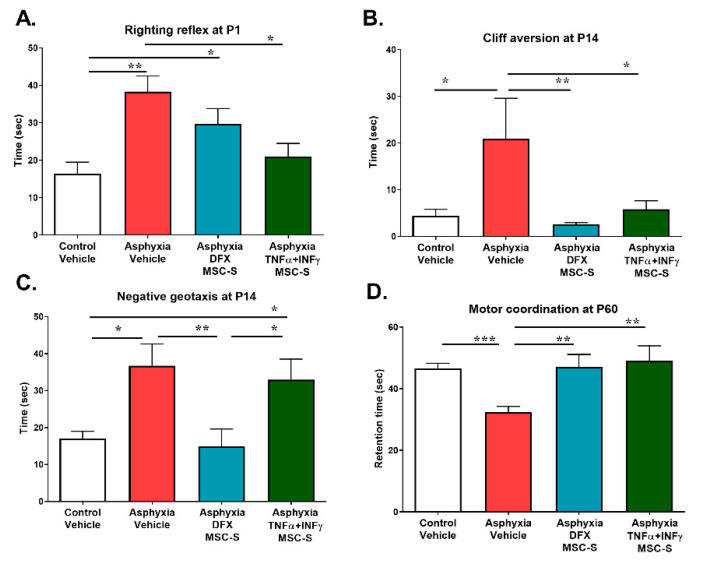
Perinatal Asphyxia (PA) is a leading cause of motor and neuropsychiatric disability associated with sustained oxidative stress, neuroinflammation, and cell death, affecting brain development. Based on a rat model of global PA, we investigated the neuroprotective effect of intranasally administered secretome, derived from human adipose mesenchymal stem cells (MSC-S), preconditioned with either deferoxamine (an hypoxia-mimetic) or TNF-α+IFN-γ (pro-inflammatory cytokines). PA was generated by immersing fetus-containing uterine horns in a water bath at 37 °C for 21 min. Thereafter, 16 μL of MSC-S (containing 6 μg of protein derived from 2 × 10⁵ preconditioned-MSC), or vehicle, were intranasally administered 2 h after birth to asphyxia-exposed and control rats, evaluated at postnatal day (P) 7. Alternatively, pups received a dose of either preconditioned MSC-S or vehicle, both at 2 h and P7, and were evaluated at P14, P30, and P60. The preconditioned MSC-S treatment (i) reversed asphyxia-induced oxidative stress in the hippocampus (oxidized/reduced glutathione); (ii) increased antioxidative Nuclear Erythroid 2-Related Factor 2 (NRF2) translocation; (iii) increased NQO1 antioxidant protein; (iv) reduced neuroinflammation (decreasing nuclearNF-κB/p65 levels and microglial reactivity); (v) decreased cleaved-caspase-3 cell-death; (vi) improved righting reflex, negative geotaxis, cliff aversion, locomotor activity, anxiety, motor coordination, and recognition memory. Overall, the study demonstrates that intranasal administration of preconditioned MSC-S is a novel therapeutic strategy that prevents the long-term effects of perinatal asphyxia.

Keywords: Neonatal hypoxia; behavioral development; cell death; hippocampus; intranasal administration; memory; mesenchymal stem cell secretome (MSC-S); neuroinflammation; neuroprotection; oxidative stress.


Conflict of interest statement

The authors declare no conflict of interest.

Figures

Figure 1
Figure 1
Effect of intranasal administration of DFX- or TNF-α+IFN-γ-MSC-S on hippocampal oxidative stress (GSSG/GSH ratio) induced by PA evaluated at P7 and P60. (A). Schematic representation of intranasal administration of vehicle or MSC-S monitoring schedules. Animals evaluated at P7 received only one MSC-S dose (2 h after birth), and those evaluated at P60 received two doses (2 h after birth and at P7). The GSSG/GSH ratio was determined in the hippocampus of control and asphyxia-exposed rats (intranasally treated with vehicle or either DFX- or TNF-α+IFN-γ-MSC-S, evaluated at P7 and P60. (B). GSSG/GSH ratio at P7: PA-exposed rats treated with vehicle (AS) (red bar) showed an increased GSSG/GSH ratio, versus vehicle-treated (CS) controls (white bar). Administration of a single dose of DFX-MSC-S (cyan bar) or TNF-α+IFN-γ-MSC-S (green bar) fully reversed the effect of PA on the GSSG/GSH ratio. Data represent means ± SEM. One-way ANOVA, F(3,30) = 6.375, ** p < 0.005. Benjamini, Hochberg, and Yekutieli post-hoc: *** p < 0.0005; CS v/s AS, ** p < 0.005; AS v/s Asphyxia-DFX-MSC-S, ** p < 0.005; AS v/s Asphyxia-TNF-α+IFN-γ-MSC-S, N = 6–10 samples per group. (C). GSSG/GSH ratio at P60: AS rats (red bar) still displayed an increased GSSG/GSH ratio versus CS (white bar). Administration of two intranasal doses of DFX- (cyan bar) or TNF-α+IFN-γ-MSC-S (green bar) fully reversed the effect of PA on the GSSG/GSH ratio. One-way ANOVA, F(3,16) = 18.55, **** p < 0.0001. Benjamini, Hochberg, and Yekutieli post-hoc: *** p < 0.0005, CS v/s AS, **** p < 0.0001; AS v/s Asphyxia-DFX-MSC-S, **** p < 0.0001; AS v/s Asphyxia-TNF-α +IFN-γ-MSC-S, N = 4–6 samples per group.
Figure 2
Figure 2
Effect of intranasal administration of DFX- or TNF-α+IFN-γ-MSC-S on nuclear and cytoplasmic NRF2 protein levels in hippocampus of PA-exposed and control rats at P7. (A) Cytoplasmic NRF2 protein levels; (B) Nuclear NRF2 protein levels. Hippocampal protein levels were evaluated by Western blots in control (white bar) and asphyxia-exposed rats (red bar), intranasally treated with vehicle- or DFX-MSC-S (cyan bar)- or TNF-α+IFN-γ-MSC-S (green bar)-MSC-S at P7. β-tubulin and histone H-4 were used as normalizers for cytoplasmic and nuclear extracts, respectively. Representative Western blot images are shown (C) and (D). Data are presented as ratio of protein/normalizer level, relative to vehicle controls. (A) PA-exposed rats treated with vehicle (AS) (red bar) showed an increased cytoplasmic NRF2 protein levels versus vehicle-treated (CS) controls (white bar). Administration of a single dose of DFX-MSC-S (cyan bar) or TNF-α+IFN-γ-MSC-S (green bar) reversed the effect of PA on cytoplasmic NRF2 levels. Data represent means ± SEM. One-way ANOVA, F(3,23) = 3.973, ** p < 0.05. Benjamini, Hochberg, and Yekutieli post-hoc: * p < 0.05, CS v/s AS, ** p < 0.005; AS v/s Asphyxia DFX-MSC-S; * p < 0.05; AS v/s Asphyxia-TNF-α+IFN-γ-MSC-S, N = 6–7 samples per group. (B). A single intranasal administration of DFX-MSC-S (cyan bar) or TNF-α+IFN-γ-MSC-S (green bar) to PA-exposed rats increased nuclear NRF2 levels, compared to AS (red bar) and to CS (white bar) rats. One-way ANOVA F(3,30) = 3.772,* p < 0.05. Benjamini, Hochberg, and Yekutieli post-hoc: * p < 0.05, CS v/s Asphyxia-DFX-MSC-S; ** p < 0.005, AS v/s Asphyxia-DFX-MSC-S; * p < 0.05, AS v/s Asphyxia-(TNF-α+IFN-γ)-MSC-S, N = 8–10 samples per group.
Figure 3
Figure 3
Effect of intranasal administration of DFX- or TNF-α+IFN-γ-MSC-S on NRF2 effector NQO1 and HO1 protein levels determined in hippocampus of PA-exposed and control rats at P7. (A) NQO1 and (B). HO1 hippocampal protein levels evaluated by Western blot in control (CS, white bar) and asphyxia-exposed rats (AS, red bar), intranasally treated with vehicle- or DFX -MSC-S(cyan bar) or TNF-α+IFN-γ-MSC-S (green bar) at P7. β-tubulin was used as normalizer for protein extracts. Data are presented as ratios of protein levels/normalizer levels, relative to vehicle control levels. Representative Western blot images are shown in (C) and (D). Data represent means ± SEM. (A) NQO1levels: A single intranasal administration of DFX-MSC-S to PA-exposed rats (cyan bar) increased NQO1 levels compared to AS (red bar) and CS rats (white bar). One-way ANOVA, F(3,19) = 4.966,* p < 0.01 Benjamini, Hochberg, and Yekutieli post-hoc: ** p < 0.005, CS v/s Asphyxia-DFX-MSC-S, ** p < 0.005; AS v/s Asphyxia-DFX-MSC-S, * p = 0.05; Asphyxia-DFX-MSC-S v/s Asphyxia-TNFα+IFN-γ-MSC-S, N = 5–6 samples per group. (B) HO1 levels: No effect of PA and/or MSC-S treatment was observed on HO1 protein levels, evaluated in hippocampus at P7. One-way ANOVA, F(3,29 = 1.726, n.s. N = 8 samples per group.
Figure 4
Figure 4
Effect of intranasal administration of DFX- or TNF-α+IFN-γ-MSC-S on cytoplasmic and nuclear p65 protein levels determined in hippocampus of PA-exposed rats at P7. (A) Cytoplasmic and (B). Nuclear p65 protein levels evaluated by Western blot at P7 in control (white bar) and asphyxia-exposed rats (red bar), intranasally treated with vehicle- or DFX-MSC-S (cyan bar) or TNF-α+IFN- γ-MSC-S (green bar). β-tubulin and histone H-4 were used as normalizers for cytoplasmic and nuclear extracts, respectively. Data are presented as ratios of protein levels/normalizer levels, relative to control levels. Representative Western blot images are shown in (C). and (D). Data represent means ± SEM. (A) Cytoplasmic p65 protein levels: An increased cytoplasmic p65 level was observed in PA treated with TNF-α+IFN-γ-MSC-S (green bar), compared to vehicle-treated control rats (CS, white bar). One-way ANOVA, F(3,20) = 1.892, p = 0.164. Benjamini, Hochberg, and Yekutieli post-hoc: * p < 0.05, CS v/s TNF-α+IFN-γ-MSC-S, N = 5–6 samples per group. (B). Nuclear p65 protein levels: A decrease in nuclear p65 levels was observed in PA-exposed rats treated with DFX- (cyan bar) or TNF-α+IFN-γ-MSC-S rats (green bar), compared to PA-exposed (AS) (red bar) and CS rats (white bar). One-way ANOVA, F(3,18) = 23.99, **** p < 0.0001. Benjamini, Hochberg, and Yekutieli post-hoc: **** p < 0.0001, CS v/s Asphyxia-DFX-MSC-S; CS v/s Asphyxia-TNF-α+IFN-γ-MSC-S; AS v/s Asphyxia-DFX-MSC-S; AS v/s. TNF-α+IFN-γ-MSC-S, N = 4–6 samples per group.
Figure 5
Figure 5
Effect of intranasal administration of TNF-α+IFN-γ-MSC-S on microglial process length in hippocampal CA1 region from PA-exposed rats at P7. (A) Representative microphotographs of immunofluorescence of IBA-1 (red) counterstained with DAPI (cyan) markers from controls and asphyxia rats treated with vehicle (AS) and asphyxia rats treated with-TNF-α+IFN-γ-MSC-S in the stratum radiatum of the CA1 hippocampal region at P7. White arrows indicate representative microglial cells depicted in the lower panel showing the three-dimensional reconstruction of their primary (green) and secondary (purple) processes, analyzed by FIJI software. (Bar: 20µm). Length of primary microglial processes. (B) Length of secondary microglial processes (IBA-1+ cells). (C) Data represent mean ± SEM. * p ˂ 0.05 ANOVA and Benjamini, Hochberg, and Yekutieli post-test. (B) Primary processes; ** p < 0.005, Control vehicle (CS) v/s AS; * p < 0.05, AS v/s Asphyxia- TNF-α+IFN-γ-MSC-S. (C). Secondary processes; ** p < 0.005, CS v/s AS; * p < 0.05, AS v/s Asphyxia-TNF-α+IFN-γ-MSC-S, N = 5–8 samples per group.
Figure 6
Figure 6
Effect of intranasal administration of DFX- or TNF-α+IFN-γ-MSC-S on hippocampal cell death (cleaved-caspase-3) induced by PA at P7. Cleaved-caspase-3 protein level evaluated by Western blot at P7 in control (CS, white bar) and asphyxia-exposed rats (AS, red bar), intranasally treated with vehicle- or DFX-MSC-S (cyan bar), or TNF-α+IFN-γ-MSC-S (green bar). β-tubulin was used as normalizer. Data are presented as ratios of protein levels/normalizer levels, relative to vehicle control levels. Data represent means ± SEM. (A) Cleaved-caspase-3 protein levels: AS rats showed an increased level of cleaved-caspase-3 protein, versus CS rats. Administration of a single dose of DFX- or TNF-α+IFN-γ-MSC-S reversed the effect of PA on cleaved-caspase-3 levels. One-way ANOVA, F (3,22) = 3.985, * p < 0.05. Benjamini, Hochberg, and Yekutieli post-hoc: ** p < 0.005; CS v/s AS; * p < 0.05; AS v/s Asphyxia-DFX-MSC-S; * p < 0.05; AS v/s Asphyxia-TNF-α+IFN-γ-MSC-S, N = 7–6 samples per group. (B) Representative Western blot image is shown.
Figure 7
Figure 7
Effect of intranasal administration of DFX- or TNF-α+IFN-γ-MSC-S on the behavioral outcome induced by PA. Schematic representation of intranasal administration of vehicle or MSC-S and evaluation schedule are shown in Supplementary Figure S2. (A) Righting reflex: rats were placed in a supine position and the time elapsed in seconds to turn over to a prone position, standing on all four paws, was recorded for control (CS, white bar) and asphyxia-exposed rats (AS, red bar) at P1, intranasally treated with vehicle, DFX-MSC-S (cyan bar), or TNF-α+IFN-γ-MSC-S (green bar). Data represent means ± SEM. Kruskal-Wallis test, ** p < 0.05, Benjamini, Hochberg, and Yekutieli post-hoc: ** p < 0.005; CS v/s AS, * p < 0.05; AS v/s Asphyxia- (TNF-α+IFN-γ)-MSC-S, * p < 0.05; CS v/s asphyxia-DFX-MSC-S, * p < 0.05; AS v/s Asphyxia-TNFα+IFN-γ-MSC-S; N = 38–35 samples per group. (B) Cliff aversion: the rat was placed with its forelimbs and head on the edge of a raised surface 30 cm from the floor for 30 s. The time at which the rat turned away from the cliff and moved its paws and head away from the edge was recorded at P14. Data represent means ± SEM. Kruskal-Wallis test, * p < 0.05, using Benjamini, Hochberg, and Yekutieli as post-hoc test: * p < 0.05; CS (white bar) v/s AS (red bar), ** p < 0.005; AS v/s Asphyxia-DFX-MSC-S (cyan bar), * p < 0.05; AS v/s Asphyxia-TNFα+IFN-γ-MSC-S (green bar), N = 7–9 samples per group. (C) Negative geotaxis: the rat was placed facing down on a slope (30°). The hindlimbs of the pups were placed in the middle of the slope. The time in which the rat turned to face up the slope and climbed up with its forelimbs reaching the upper rim was recorded at P14. Data represent means ± SEM. Kruskal-Wallis test ** p < 0.005, followed by Benjamini and Hochberg, and Yekutieli post-hoc: * p < 0.05, CS (white bar), * p < 0.05; CS v/s Asphyxia-TNFα+IFN-γ-MSC-S (green bar), ** p < 0.005; AS v/s Asphyxia-DFX-MSC-S (cyan bar), ** p < 0.005; Asphyxia-DFX-MSC-S v/s Asphyxia-TNFα+IFN-γ-MSC-S, N = 5–8 per group. (D) Motor coordination: At P60, the rat was placed on a rotarod apparatus perpendicular to a rod axis, with its head facing in the opposite direction to the rotation around the rod’s axis. Trials ended once the rat had fallen and the time spent on the rod was recorded (retention time). Data represent means ± SEM. Kruskal-Wallis test, *** p <0.0005, followed by Benjamini, Hochberg, and Yekutieli post-hoc: *** p < 0.0005, CS (white bar) v/s AS (red bar), ** p < 0.005; AS v/s Asphyxia-DFX-MSC-S (cyan bar), ** p < 0.005; AS v/s Asphyxia-TNFα+IFN-γ-MSC-S (green bar), N = 19–23 samples per group.
Figure 8
Figure 8
Effect of intranasal administration of DFX- or TNF-α+IFN-γ-MSC-S on locomotor activity, anxiety, and recognition memory. Locomotor activity: exploratory behavior was monitored in a square open field arena at P7 and P30. (A) Locomotor activity at P7. Data represent means ± SEM. Kruskal-Wallis, * p < 0.05, followed by Benjamini, Hochberg, and Yekutieli post-hoc: * p < 0.05, Control vehicle (CS, white bar) v/s Asphyxia vehicle (AS, red bar), * p < 0.05; CS v/s Asphyxia-TNFα+IFN-γ-MSC-S (green bar), * p < 0.05; AS v/s Asphyxia-DFX-MSC-S (cyan bar), * p < 0.05; Asphyxia-DFX-MSC-S v/s Asphyxia-TNFα+IFN-γ-MSC-S, N = 8–10 samples per group. (C) Similar effects on locomotor activity were observed at P30: Kruskal-Wallis, * p < 0.05, followed by Benjamini, Hochberg, and Yekutieli post-hoc: * p < 0.005, CS v/s AS; * p < 0.05, AS v/s Asphyxia-DFX-MSC-S), N = 8–12 samples per group. Representative tracking traces showing the occupancy maps of different groups of rats in the arena at P7: (B); and at P30: (D) The color bars represent the time of occupancy and the solid line the trajectory travelled. (E) Anxiety at P30. Quantification of the time spent by the rats at the center of the arena was monitored during a first 5 min observation period. AS rats remained close to the wall of the arena, avoiding the center and other areas devoid of thigmotactic cues. This behavior was reversed by TNFα+IFN-γ-MSC-S administration. Data represent means ± SEM. Kruskal-Wallis test, ** p < 0.005, followed by Benjamini, Hochberg, and Yekutieli post-hoc: ** p < 0.005; CS v/s AS, ** p < 0.005; AS v/s Asphyxia-TNFα+IFN-γ-MSC-S, N = 8–12 samples per group. (F) Novel object recognition memory at P30. First, the rat was exposed to two identical objects for 5 min. 24 h later, the rat was exposed to one of the same objects and to a new object. Memory index refers to the time spent exploring the new object divided by the total time spent exploring the old and the new object. Values of memory index equal to or below 0.5 indicate memory deficit. Data represent means ± SEM. Kruskal-Wallis test * p < 0.05, followed by Benjamini, Hochberg, and Yekutieli post-hoc: ** p < 0.005, CS (white bar) v/s AS (red bar), * p < 0.05; AS v/s Asphyxia-DFX-MSC-S (cyan bar); * p < 0.05, AS v/s Asphyxia-TNFα+IFN-γ-MSC-S (green bar), N = 7–9 samples per group.

Similar articles

Cited by

References

    1. Douglas-Escobar M., Weiss M.D. Hypoxic-Ischemic Encephalopathy. JAMA Pediatr. 2015;169:397. doi: 10.1001/jamapediatrics.2014.3269. - DOI - PubMed
    1. Antonucci R., Porcella A., Pilloni M.D. Perinatal asphyxia in the term newborn. J. Pediatr. Neonatal Individ. Med. 2014;3:e030269. doi: 10.7363/030269. - DOI
    1. Campbell H., Eddama O., Azzopardi D., Edwards A.D., Strohm B., Rivero-Arias O. Hypothermia for perinatal asphyxia: Trial-based quality of life at 6–7 years. Arch. Dis. Child. 2018;103:654–659. doi: 10.1136/archdischild-2017-313733. - DOI - PMC - PubMed
    1. Millar L.J., Shi L., Hoerder-Suabedissen A., Molnár Z. Neonatal Hypoxia Ischaemia: Mechanisms, Models, and Therapeutic Challenges. Front. Cell. Neurosci. 2017;11:78. doi: 10.3389/fncel.2017.00078. - DOI - PMC - PubMed
    1. Morales P., Fiedler J.L., Andrés S., Berrios C., Huaiquín P., Bustamante D., Cardenas S., Parra E., Herrera-Marschitz M. Plasticity of hippocampus following perinatal asphyxia: Effects on postnatal apoptosis and neurogenesis. J. Neurosci. Res. 2008;86:2650–2662. doi: 10.1002/jnr.21715. - DOI - PubMed

MeSH terms