. 2020 Oct 21;21(20):7802.
doi: 10.3390/ijms21207802.

NLRP3 as Putative Marker of Ipilimumab-Induced Cardiotoxicity in the Presence of Hyperglycemia in Estrogen-Responsive and Triple-Negative Breast Cancer Cells

Affiliations

NLRP3 as Putative Marker of Ipilimumab-Induced Cardiotoxicity in the Presence of Hyperglycemia in Estrogen-Responsive and Triple-Negative Breast Cancer Cells

Vincenzo Quagliariello et al. Int J Mol Sci. .

Abstract

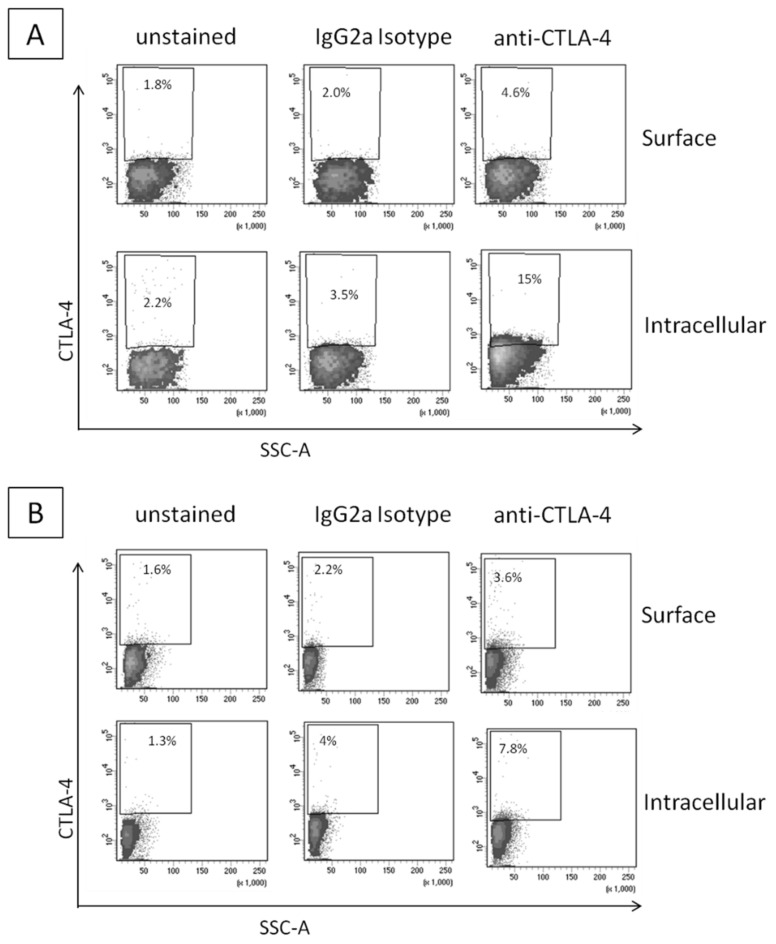
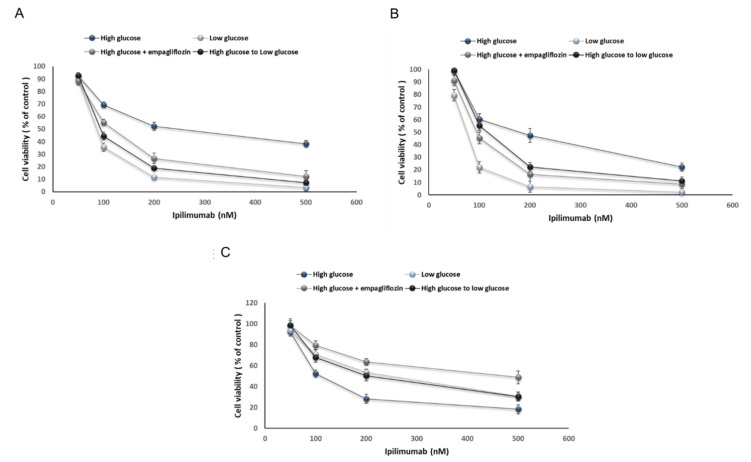
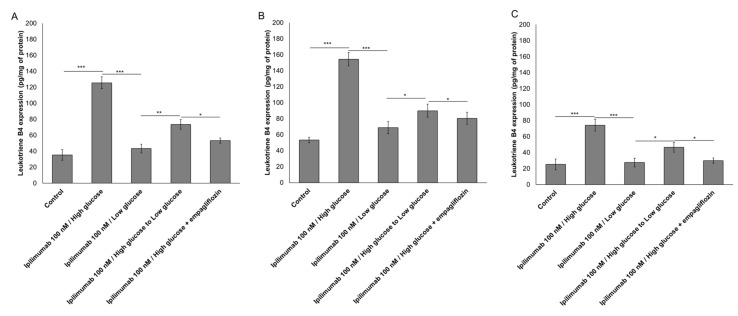
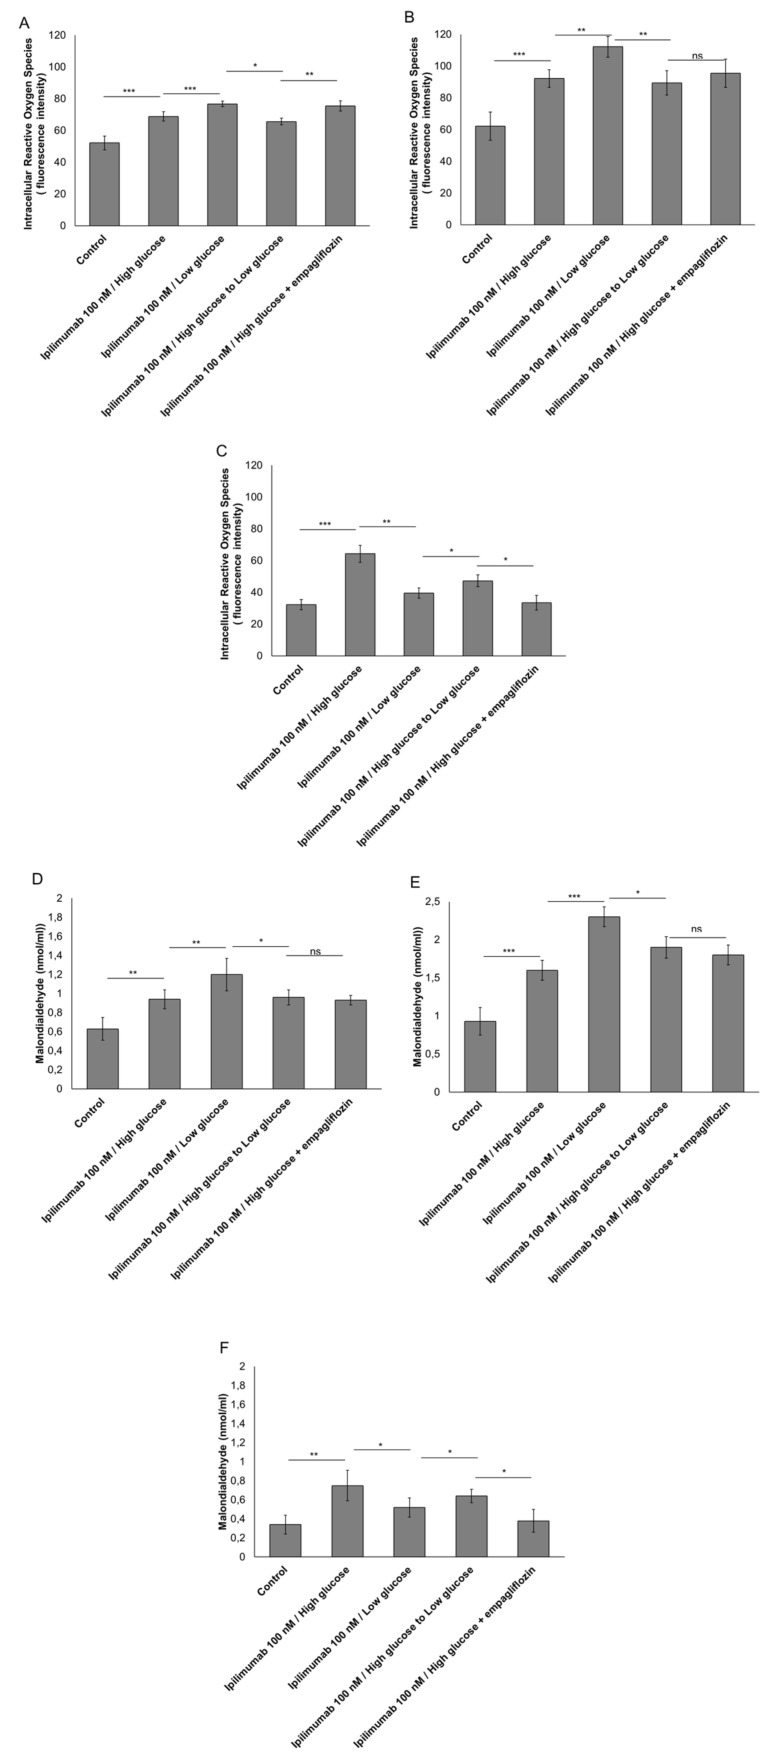
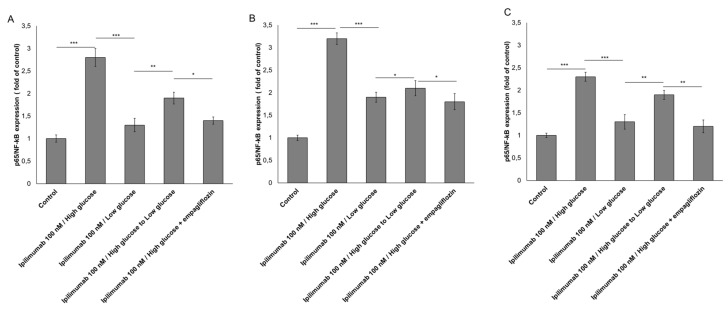
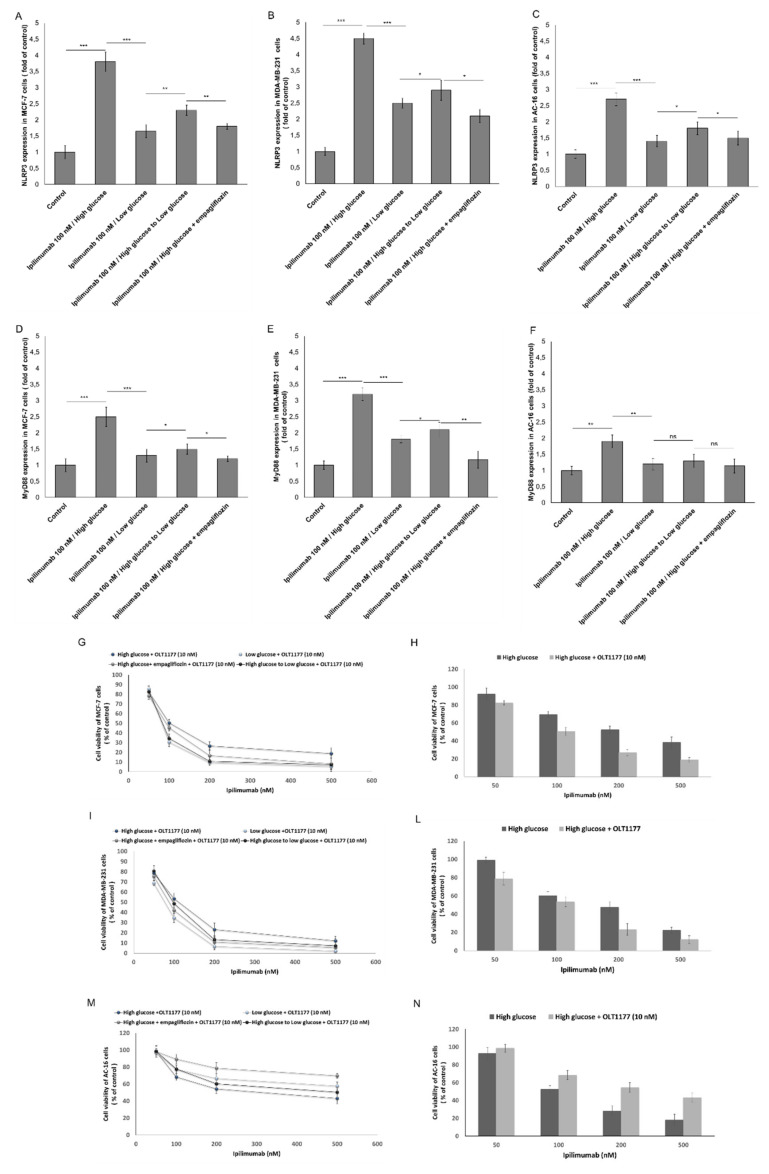
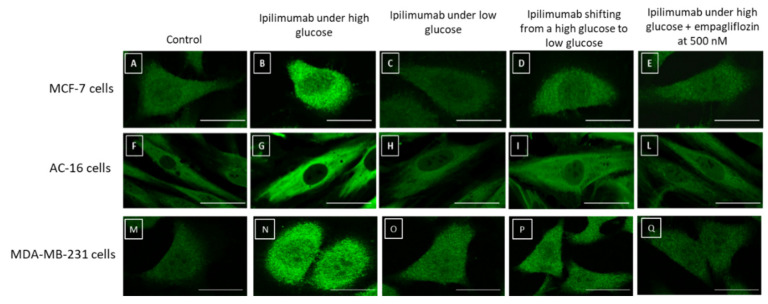
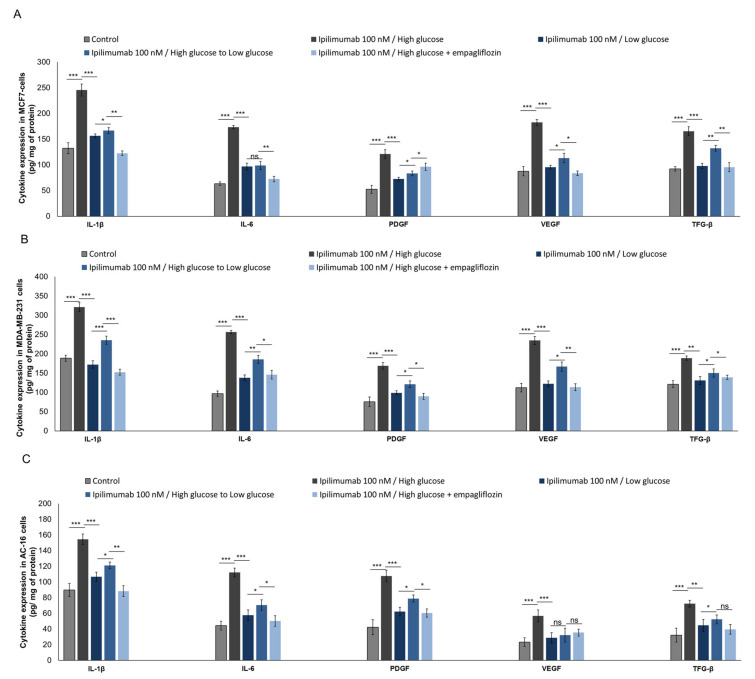
Hyperglycemia, obesity and metabolic syndrome are negative prognostic factors in breast cancer patients. Immune checkpoint inhibitors (ICIs) have revolutionized cancer treatment, achieving unprecedented efficacy in multiple malignancies. However, ICIs are associated with immune-related adverse events involving cardiotoxicity. We aimed to study if hyperglycemia could affect ipilimumab-induced anticancer efficacy and enhance its cardiotoxicity. Human cardiomyocytes and estrogen-responsive and triple-negative breast cancer cells (MCF-7 and MDA-MB-231 cell lines) were exposed to ipilimumab under high glucose (25 mM); low glucose (5.5 mM); high glucose and co-administration of SGLT-2 inhibitor (empagliflozin); shifting from high glucose to low glucose. Study of cell viability and the expression of new putative biomarkers of cardiotoxicity and resistance to ICIs (NLRP3, MyD88, cytokines) were quantified through ELISA (Cayman Chemical) methods. Hyperglycemia during treatment with ipilimumab increased cardiotoxicity and reduced mortality of breast cancer cells in a manner that is sensitive to NLRP3. Notably, treatment with ipilimumab and empagliflozin under high glucose or shifting from high glucose to low glucose reduced significantly the magnitude of the effects, increasing responsiveness to ipilimumab and reducing cardiotoxicity. To our knowledge, this is the first evidence that hyperglycemia exacerbates ipilimumab-induced cardiotoxicity and decreases its anticancer efficacy in MCF-7 and MDA-MB-231 cells. This study sets the stage for further tests on other breast cancer cell lines and primary cardiomyocytes and for preclinical trials in mice aimed to decrease glucose through nutritional interventions or administration of gliflozines during treatment with ipilimumab.

Keywords: breast cancer; cardioncology; cardiotoxicity; cytokines; hyperglycemia; nivolumab.


Conflict of interest statement

The authors declare no conflict of interest.

Figures

Figure 1
Figure 1
Flow-cytometric analysis of CTLA-4 in human breast cancer cells MDA-MB-231 (A) and MCF-7 (B). MDA-MB-231 and MCF-7 were stained on their surface or intracellularly with the designated antibodies. IgG2a Isotype corresponds to the staining with a negative class-matched control antibody. Results are expressed as percentage of stained cells.
Figure 2
Figure 2
Cell viability of MCF-7 (A) and MDA-MB-231 (B) cells after 72 h of incubation with ipilimumab under different condition (high glucose; low glucose; high glucose + empagliflozin at 500 nM; switch high glucose to low glucose); (C) Cell viability of AC16 cells after 72 h of incubation with ipilimumab under different condition (high glucose; low glucose; high glucose + empagliflozin at 500 nM; shifting from a high glucose to low glucose). Error bars depict means ± SD (n = 3). Statistical analysis was performed using paired t-test.
Figure 3
Figure 3
Leukotrienes type B4 production by MCF-7 (A) and MDA-MB-231 (B) cells, treated with ipilimumab mAb for 24 h, in the presence of human peripheral blood mononuclear cells (hPBMCs) under different condition (high glucose; low glucose; high glucose + empagliflozin at 50 nm; shifting from a high glucose to low glucose). Untreated or treated cells with an unrelated control IgG (control) were used as negative controls; (C) Leukotrienes type B4 production by AC-16 cells, treated with ipilimumab mAb for 24 h, in the presence of hPBMCs under different condition (high glucose; low glucose; high glucose + empagliflozin at 500 nM; shifting from a high glucose to low glucose). Untreated or treated cells with an unrelated control IgG (control) were used as negative controls. Error bars depict means ± SD (n = 3). Statistical analysis was performed using paired t-test. *** p < 0.001.** p < 0.01.* p < 0.05.
Figure 4
Figure 4
Intracellular Reactive Oxygen Species (ROS) and Malondialdeyde (MDA) quantification in MCF-7 cells (A,D) and MDA-MB-231 (B,E) cells treated with ipilimumab mAb in the presence of hPBMCs under different condition (high glucose; low glucose; high glucose + empagliflozin at 50 nm; shifting from a high glucose to low glucose). Untreated or treated cells with an unrelated control IgG (control) were used as negative controls; (C,F) Intracellular Reactive Oxygen Species (ROS) and Malondialdeyde (MDA) quantification in AC-16 cells, treated with ipilimumab mAb for 24 h, in the presence of hPBMCs under different conditions (high glucose; low glucose; high glucose + empagliflozin at 500 nM; shifting from a high glucose to low glucose). Untreated or treated cells with an unrelated control IgG (control) were used as negative controls. Error bars depict means ± SD (n = 3). Statistical analysis was performed using paired t-test. *** p < 0.001. ** p < 0.01. * p < 0.05.
Figure 5
Figure 5
p65/NF-kB expression(fold of control) expression in MCF-7 (A), MDA-MB-231 (B) and AC-16 (C) cells, treated with ipilimumab mAb in the presence of hPBMCs under different condition (high glucose; low glucose; high glucose + empagliflozin at 500 nM; shifting from a high glucose to low glucose). Untreated or treated cells with an unrelated control IgG (control) were used as negative controls. Error bars depict means ± SD (n = 3). Statistical analysis was performed using paired t-test. *** p < 0.001. ** p < 0.01. * p < 0.05.
Figure 6
Figure 6
NLRP3 (fold of control) expression in MCF-7 (A), MDA-MB-231 (B), and AC-16 cells (C), treated with ipilimumab mAb in the presence of hPBMCs under different condition (high glucose; low glucose; high glucose + empagliflozin at 500 nM; shifting from a high glucose to low glucose). MyD88 (fold of control) expression in MCF-7 (D), MDA-MB-231 (E), and AC-16 cells (F), treated with ipilimumab in the presence of hPBMCs under different condition (high glucose; low glucose; high glucose + empagliflozin at 50 nm; shifting from a high glucose to low glucose). Cell viability of MCF-7 (G,H), MDA-MB-231 (I,L), and AC-16 cells (M,N) under high glucose (with or without empagliflozin), low glucose, shifting from high glucose to low glucose and always exposed to ipilimumab and NLRP3 selective inhibitor OLT-1177. For all experiments, untreated or treated cells with an unrelated control IgG (control) were used as negative controls. Error bars depict means ± SD (n = 3). Statistical analysis was performed using paired t-test. *** p < 0.001. ** p < 0.01. * p < 0.05.
Figure 7
Figure 7
NLRP3 straining (green signals) in MCF-7 (AE), AC-16 (FI,L), and MDA-MB-231 cells (MQ) treated with ipilimumab under high glucose (B,G,N); low glucose (C,H,O); shifting from a high glucose to low glucose (D,I,P), and high glucose + empagliflozin at 500 nM (E,L,Q). Untreated cells with an unrelated control IgG (control) were used as negative controls (A,F,M). Scale bar: 50 µm.
Figure 8
Figure 8
Expression of IL-1, IL-6, PDGF, VEGF, and TGF in MCF-7 (A), MDA-MB-231 (B), and AC-16 cells (C). Cells were treated with ipilimumab mAb for 24 h, in the presence of hPBMCs under different condition (high glucose; low glucose; shifting from a high glucose to low glucose; high glucose + empagliflozin at 500 nm). Error bars depict means ± SD (n = 3). Statistical analysis was performed using paired t-test. *** p < 0.001. ** p < 0.01. * p < 0.05.

References

    1. The Lancet Oncology Immunotherapy: Hype and hope. Lancet Oncol. 2018;19:845. doi: 10.1016/S1470-2045(18)30317-6. - DOI - PubMed
    1. Haslam A., Prasad V. Estimation of the Percentage of US Patients With Cancer Who Are Eligible for and Respond to Checkpoint Inhibitor Immunotherapy Drugs. JAMA Netw. Open. 2019;2:e192535. doi: 10.1001/jamanetworkopen.2019.2535. - DOI - PMC - PubMed
    1. Salmaninejad A., Valilou S.F., Shabgah A.G., Aslani S., Alimardani M., Pasdar A., Sahebkar A. PD-1/PD-L1 pathway: Basic biology and role in cancer immunotherapy. J. Cell. Physiol. 2019;234:16824–16837. doi: 10.1002/jcp.28358. - DOI - PubMed
    1. Seidel J.A., Otsuka A., Kabashima K. Anti-PD-1 and Anti-CTLA-4 Therapies in Cancer: Mechanisms of Action, Efficacy, and Limitations. Front. Oncol. 2018;8:86. doi: 10.3389/fonc.2018.00086. - DOI - PMC - PubMed
    1. Larkin J., Chiarion-Sileni V., Gonzalez R., Grob J.J., Rutkowski P., Lao C.D., Cowey C.L., Schadendorf D., Wagstaff J., Dummer R., et al. Five-Year Survival with Combined Nivolumab and Ipilimumab in Advanced Melanoma. N. Engl. J. Med. 2019;381:1535–1546. doi: 10.1056/NEJMoa1910836. - DOI - PubMed

MeSH terms

LinkOut - more resources