. 2020 Oct 23;18(1):167.
doi: 10.1186/s12964-020-00653-3.

Lactate-induced MRP1 expression contributes to metabolism-based etoposide resistance in non-small cell lung cancer cells

Affiliations

Lactate-induced MRP1 expression contributes to metabolism-based etoposide resistance in non-small cell lung cancer cells

Qi Dong et al. Cell Commun Signal. .

Abstract

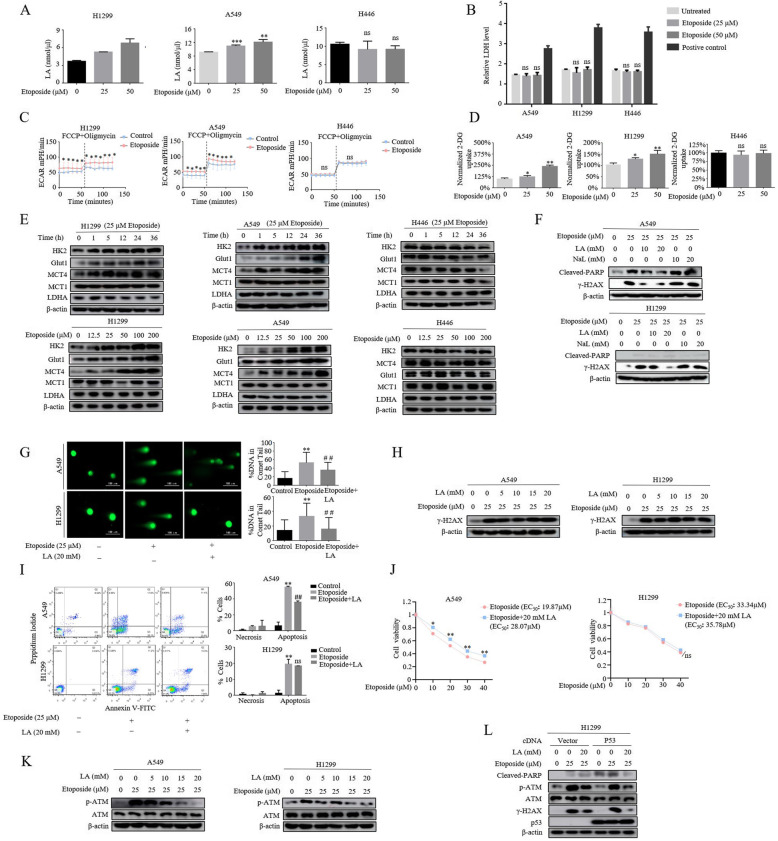
Background: Metabolic reprogramming contributes significantly to tumor development and is tightly linked to drug resistance. The chemotherapeutic agent etoposide (VP-16) has been used clinically in the treatment of lung cancer but possess different sensitivity and efficacy towards SCLC and NSCLC. Here, we assessed the impact of etoposide on glycolytic metabolism in SCLC and NSCLC cell lines and investigated the role of metabolic rewiring in mediating etoposide resistance.

Methods: glycolytic differences of drug-treated cancer cells were determined by extracellular acidification rate (ECAR), glucose consumption, lactate production and western blot. DNA damage was evaluated by the comet assay and western blot. Chemoresistant cancer cells were analyzed by viability, apoptosis and western blot. Chromatin immunoprecipitation (ChIP) was used for analysis of DNA-protein interaction.

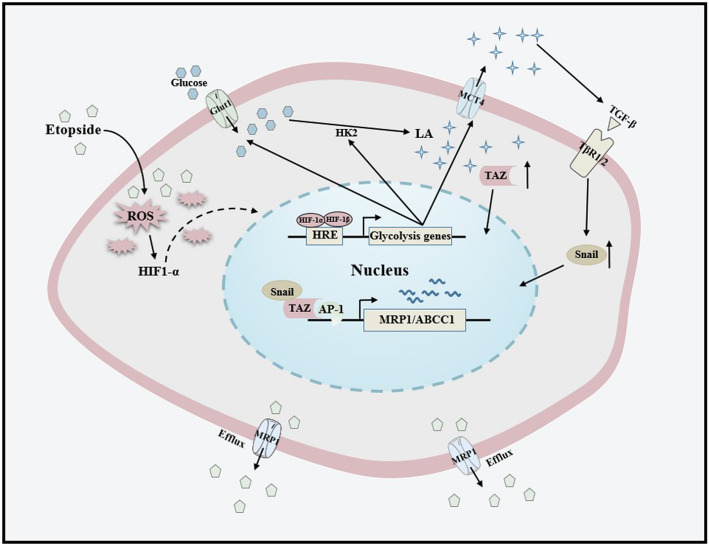
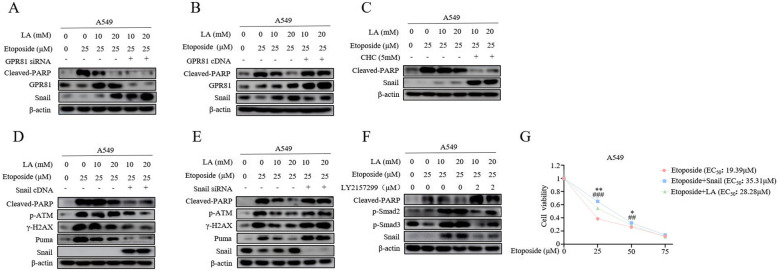
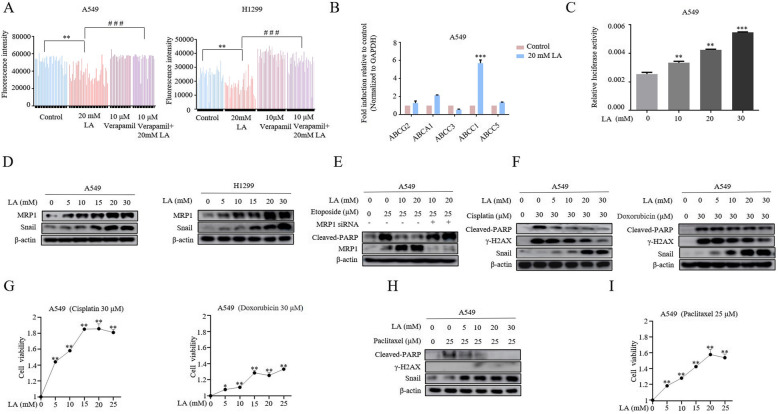
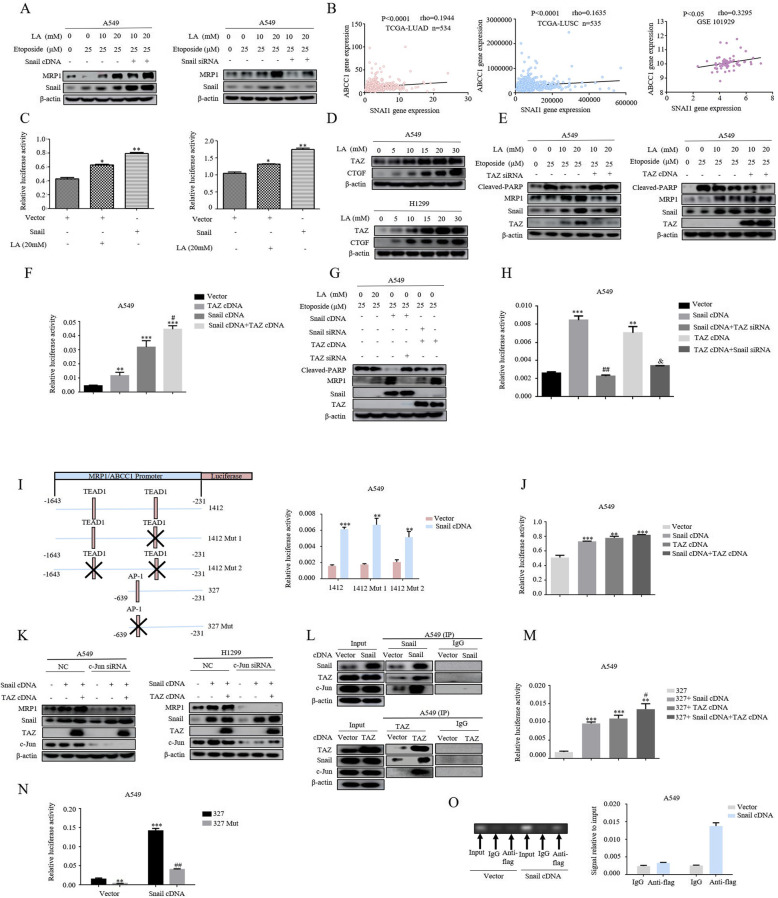
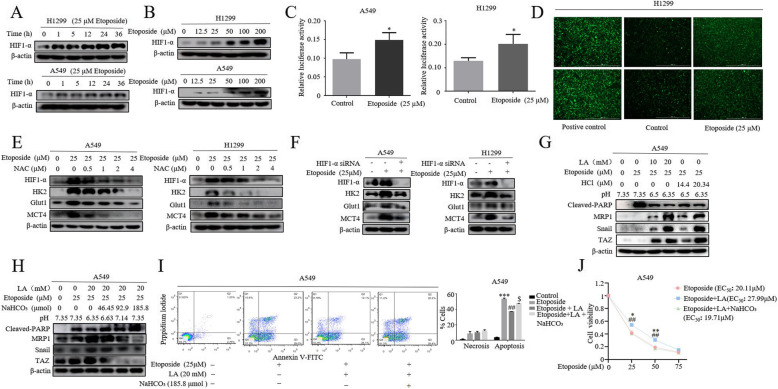
Results: Here we showed that exposure to chemotherapeutic drug etoposide induces an exacerbation of ROS production which activates HIF-1α-mediated the metabolic reprogramming toward increased glycolysis and lactate production in non-small cell lung cancer (NSCLC). We identified lactic acidosis as the key that confers multidrug resistance through upregulation of multidrug resistance-associated protein 1 (MRP1, encoded by ABCC1), a member of ATP-binding cassette (ABC) transporter family. Mechanistically, lactic acid coordinates TGF-β1/Snail and TAZ/AP-1 pathway to induce formation of Snail/TAZ/AP-1 complex at the MRP1/ABCC1 promoter. Induction of MRP1 expression inhibits genotoxic and apoptotic effects of chemotherapeutic drugs by increasing drug efflux. Furthermore, titration of lactic acid with NaHCO3 was sufficient to overcome resistance.

Conclusions: The chemotherapeutic drug etoposide induces the shift toward aerobic glycolysis in the NSCLC rather than SCLC cell lines. The increased lactic acid in extracellular environment plays important role in etoposide resistance through upregulation of MRP expression. These data provide first evidence for the increased lactate production, upon drug treatment, contributes to adaptive resistance in NSCLC and reveal potential vulnerabilities of lactate metabolism and/or pathway suitable for therapeutic targeting. Video Abstract The chemotherapeutic drug etoposide induces metabolic reprogramming towards glycolysis in the NSCLC cells. The secreted lactic acid coordinates TGF-β1/Snail and TAZ/AP-1 pathway to activate the expression of MRP1/ABCC1 protein, thus contributing to chemoresistance in NSCLC.

Keywords: Chemoresistance; Etoposide; Lactic acid; MRP1; Metabolic reprogramming.


Conflict of interest statement

The authors declare that they have no competing interests.

Figures

None
The chemotherapeutic drug etoposide induces metabolic reprogramming towards glycolysis in the NSCLC cells. The secreted lactic acid coordinates TGF-β1/Snail and TAZ/AP-1 pathway to activate the expression of MRP1/ABCC1 protein, thus contributing to chemoresistance in NSCLC.
Fig. 1
Fig. 1
Induction of lactate metabolism inhibits genotoxic and apoptotic effects of etoposide in NSCLC. a Treatment of cells with etoposide for 5 h resulted in an increase in lactate secretion (*p<0.05, **P<0.01, ***p<0.001 for difference from untreated control by ANOVA for multiple comparison, ns means no statistical difference). b The cells were treated with different concentrations of etoposide or 1% Triton X-100 as positive control for 5 h. Culture medium was collected for determination of released lactate dehydrogenase (LDH) reflecting the membrane rapture. No significant difference of LDH release was detected after etoposide treatment (difference from untreated control by ANOVA for multiple comparison, ns means no statistical difference). c The extracellular acidification rate (ECAR) was measured in cells exposed to 25 μM etoposide for 5 h. The concentrations of oligomycin, FCCP were 10 μM and the bar is representative of mean ± S.D. of three independent experiments (*p<0.05, student t-test). d Measurement of 2-DG uptake in cells after exposed etoposide for 5 h. (*p<0.05, **P<0.01, for difference from untreated control by ANOVA for multiple comparison, ns means no statistical difference). e Western blot analysis was performed to examine glycolysis enzymes, HK2, MCT4, LDHA, MCT1 and Glut1, in different histological lung cancer cell lines A549, H1299 and H446 treated for indicated time (upper panel, 25 μM) or for various concentrations (lower panel) of etoposide. f The cells were first stimulated either with LA (lactic acid) or NaL (sodium lactate) for 3 h followed by further treatment with 25 μM etoposide for additional 36 h and then lysed for western blot analysis using antibodies against Cleaved-PARP and γH2AX. It is lactic acid, but not its sodium salt, suppressed the levels of γH2AX in both A549 and H1299 cell lines. g Comet assay reveal that 20 mM LA (lactic acid) inhibited DNA damage induced by etoposide. The quantification was present in right panel. The bars represent the mean ± S.D. of triplicates (**p<0.01 for difference from control cells, ##p<0.01 for difference from etoposide-treated cells by ANOVA with Dunnett’s correction for multiple comparisons). h A549 and H1299 were incubated first with etoposide for 5 h and then subjected to LA (lactic acid) exposure in the presence of etoposide for additional 36 h. The results revealed that etoposide induced γ-H2AX was not inhibited by lagging treatment with LA. i A549 and H1299 cells were pre-treated with LA (20 mM) for 3 h before etoposide treatment for 36 h. Flow cytometric analysis of cell death showed that lactate significantly reduced etoposide-induced apoptosis in A549 but not in H1299 cells. The quantification was present in right panel. The bars represent the mean ± S.D. of triplicates (**p<0.01 for difference from control cells, ##p<0.01 for difference from etoposide-treated cells by ANOVA with Dunnett’s correction for multiple comparisons, ns means no statistical difference). j Cell viability assay showed that LA significantly increased A549 rather than H1299 cell viability. In A549 cells, the EC50 (concentration for 50% of maximal effect) of etoposide was 19.87 μM, the cell survival was increased in the presence of LA with EC50 of 28.07 μM. However, the LA stimulation had not effect of EC50 values in H1299 cells. (*p<0.05, for difference from untreated control by ANOVA with Dunnett’s correction for multiple comparisons). k Cells were treated with different concentrations of LA for 3 h in the absence and presence of 25 μM etoposide. ATM and p-ATM expression were examined by western blot. l 24 h after transfection with wild-type p53 plasmids, cells were treated with etoposide in the absence and presence of 20 mM LA. The expression levels of Cleaved-PARP, γ-H2AX, ATM, p-ATM were analyzed by western blot
Fig. 2
Fig. 2
Induction of Snail mediates lactate-induced chemoresistance. a and b 24 h after transfection with either GPR81 siRNA (a) or GPR81 cDNA (b), cells were stimulated first with LA (10 mM, 20 mM) for 3 h and then with 25 μM etoposide for additional 36 h. The blots have been probed with antibodies against Cleaved-PARP, GPR81, Snail. c The cells were pre-treated with MCT1 inhibitor, a-cyano-4-hydroxycin-namate (CHC) or DMSO as control followed by further combined treatment of LA and etoposide. In contrast to Snail levels, western blot demonstrates a significant decrease in levels of Cleaved-PARP in CHC-treated group. d and e Western blot analysis of Cleaved-PARP, p-ATM, ATM, Snail, Puma in A549 and H1299 cells at day 3 after infection with Snail cDNA (d) or Snail siRNA (e) and then further treated with LA and etoposide described in the legend to Fig. 1e. f The cells were pre-treated with TGF-β inhibitor, LY2157299, and then with the same treatment as Fig. 2c. g The A549 cells were first transfected with Snail cDNA plasmid. At 48 h post-transfection, cells were treated with etoposide in the presence and absence of LA followed by MTT assay. Corresponding EC50values for etoposide, Etoposide+Snail and Etoposide+LA are 19.39 μM, 35.31 μM and 28.28 μM respectively. (*p<0.05, **p<0.01 for difference of overexpressed Snail from etoposide-treated cells, #p<0.05 for difference of LA-treated from etoposide-treated cells by ANOVA with Dunnett’s correction for multiple comparisons, ns means no statistical difference)
Fig. 3
Fig. 3
Lactate confers a potent chemoresistance through upregulation of MRP1. a Hoechst 33342 efflux assays of cells treated with 20 mM LA in the presence and absence of ABC transporter inhibitor 10 μM Verapamil using BioTek citation 5 (BioTek, Winooski, VT). Representative histogram plots are shown of non-treated cells (control), 20 mM LA, 10 μM Verapamil and combined treatment of lactate and Verapamil. The result clearly showed that lactate significantly promoted the efflux of Hoechst 33342 in A549 and H1299 cells (**P<0.01, ***p<0.001 for difference from untreated control, ###p<0.001 for difference from LA-treated cells by ANOVA with Dunnett’s correction for multiple comparisons). b Quantitative real-time PCR was performed for analysis of mRNA expression levels of several members of ABC transporter family. Values represent the relative increase of MRP1 mRNA normalized to GAPDH. (***p<0.001 for difference from untreated control by ANOVA for multiple comparison). c A549 cells were co-transfected with MRP1 promoter reporter construct and control Renilla luciferase reporter plasmid and treated with indicated lactate concentrations after 48 h. Luciferase activity was determined and normalized using the dual luciferase reporter system (**P<0.01, ***p<0.001 for difference from untreated control by ANOVA for multiple comparison). d Western blot demonstrates increased MRP1 expression following 3 h of LA (0, 5, 10, 15, 20 and 30 mM) stimulation in both A549 and H1299 cells. e 48 h after transfection of A549 either with MRP1 siRNAs or control siRNA, and then cells were stimulated first with LA for 3 h and further etoposide for additional 36 h before western blotting. The results showed that the apoptosis marker Cleaved-PARP was significantly induced after knockdown of MRP1. f A549 cells were stimulation with different doses of LA for 3 h and then further exposed to indicated drugs for additional 36 h, western blot results show that LA can significantly reduce Cisplatin, Doxorubicin-induced levels of Cleaved-PARP and γ-H2AX. g Cell viability assays show that LA can significantly increase A549 cells survival in the presence of cisplatin (30 mM) and doxorubicin (30 mM). h The cells were treated as described in Fig. 3f, western blot results show that LA can significantly reduce Taxol-induced levels of Cleaved-PARP, but not that of γ-H2AX. i Cell viability assays show that lactate can significantly increase A549 cells survival in the presence of Taxol (25 mM)
Fig. 4
Fig. 4
Formation of Snail/TAZ/AP-1 complex induced by lactate is required for MRP1 expression. a Transfection of A549 with either Snail cDNA or Snail siRNAs or their respective controls for 48 h, and then were treated first with LA for 3 h and then etoposide for additional 36 h before western blotting. b The correlations between SNAI1 and MRP1 expression from three data sets (TCGA-LUAD, TCGA-LUSC, GEO101929). The Spearman’s rank correlation coefficient (rho) and the P values were calculated. c A549 and H1299 cells were co-transfected with a 8xGTIIC-luc plasmid containing eight synthetic responsive elements of TEAD and Snail cDNA. Then luciferase activity was measured in the presence and absence of LA treatment and normalized using the dual luciferase reporter system. The bars represent the mean ± S.D. of triplicates. (*p<0.05, **P<0.01, for difference from untreated control by ANOVA for multiple comparison, ns means no statistical difference). d Western blot demonstrates increased TAZ and CTGF expression following 3 h of lactate (0, 5, 10, 15, 20 and 30 mM) stimulation in A549 and H1299 cells. e Transfection of A549 with either TAZ siRNA or TAZ cDNA or their respective controls for 48 h, and then were treated first with LA for 3 h and then etoposide for additional 36 h before western blotting. The results showed that MRP1 was significantly reduced after knockdown of TAZ and increased upon overexpression of TAZ. f Cells were co-transfected with MRP1 promoter reporter construct with a Snail cDNA construct, TAZ cDNA construct and combination of Snail cDNA construct and TAZ cDNA construct for 48 h before luciferase activity was determined and normalized. Data are represented as mean ± S.D. (*p < 0.05, **p < 0.01, ***p < 0.001, for difference from cells transfected with control vector, #p<0.05 for difference from Snail cDNA-transfected cells by ANOVA with Dunnett’s correction for multiple comparisons). g Western blot analysis of MRP1 expression after co-transfection of cells with Snail cDNA or siRNA or TAZ cDNA or siRNA for 48 h upon treatment described in Fig. 4e. h Cells were co-transfected with MRP1/ABCC1 promoter reporter construct with a wild-type Snail cDNA or TAZ cDNA or the combined Snail cDNA and TAZ siRNA or the combination of TAZ cDNA and Snail siRNA for 48 h before luciferase activity was determined and normalized. Data are represented as mean ± S.D. (*p < 0.05, ***p < 0.001, for difference from the untreated cells; ####p<0.001 for difference from cells transfected with Snail cDNA; &p < 0.05 for difference from cells transfected with TAZ cDNA by ANOVA with Dunnett’s correction for multiple comparisons). i A schematic representation of the MRP1/ABBC1 promoter region showing potential TEAD1 and AP-1 binding sites (left panel). Cells were co-transfected with one of these designated constructs (constructs 1412, construct 1412 Mut1 with one mutated TEAD1 binding site,1412 Mut2 with mutated two TEAD1 binding sites) and with a wild-type Snail cDNA construct for 48 h, and then luciferase activity was measured and normalized (right panel). The bars represent the mean ± S.D. of triplicates (**p < 0.01, ***p < 0.001, for difference from cells transfected empty vector by ANOVA with Dunnett’s correction for multiple comparisons). j The cells were co-transfected with the AP-1-luc plasmids containing the synthetic response element of AP-1(Jun:Jun; Jun:Fos) and the Snail cDNA or TAZ cDNA plasmids. Luciferase activity was then measured and normalized using a dual luciferase reporter system. Bars represent the mean ± S.D. Triplicate (**p < 0.01, ***p < 0.001, for difference from the cells transfected with control vector by ANOVA with Dunnett’s correction for multiple comparisons). k A549 and H1299 were co-transfected with c-JUN siRNA and Snail or TAZ cDNA constructs for 48 h. The blots have been probed with indicated antibodies. l A549 cells were transfected either with Snail cDNA or TAZ cDNA for 48 h. Cell lysates were subjected to immunoprecipitation with anti-Snail (upper panel) or with anti-TAZ (lower panel), immunoprecipitates were run in Western blots for Snail, TAZ and c-Jun. m Cells were co-transfected with MRP1 promoter reporter construct 327 with the Snail cDNA or TAZ cDNA plasmids for 48 h before luciferase activity was determined and normalized. Data are represented as mean ± S.D. (***p < 0.001, for difference from the cells transfected with control vector; #p < 0.05for difference from cells transfected with Snail cDNA by ANOVA with Dunnett’s correction for multiple comparisons). n Cells were co-transfected with one of two designated constructs (construct 327, 327 Mut with the mutated AP-1 binding site) and Snail cDNA plasmids for 48 h, and then luciferase activity was measured and normalized. The bars represent the mean ± S.D. of triplicates (**p < 0.01, ***p < 0.001, for difference from the cells transfected with construct 327 cells, ##p<0.01 for difference from 327Mut-transfected cells by ANOVA with Dunnett’s correction for multiple comparisons). o A549 cells were transfected with Flag-tagged Snail cDNA for 72 h. ChIP assays were performed using anti-FLAG antibody. The Standard PCR products were run and scanned (left panel). The histogram was presented as quantification of the PCR results (right panel)
Fig. 5
Fig. 5
HIF-1α is a key regulator of drug-induced metabolic reprogramming. a and b Western blot demonstrated the time-course (a) and dose-dependent (b) induction of HIF1-α by etoposide. c A549 and H1299 cells were transfected with a HRE-luc plasmid containing five synthetic responsive elements of HIF1-α for 24 h and then treated with etoposide for 5 h. Then luciferase activity was immediately measured and normalized using the dual luciferase reporter system. The bars represent the mean ± S.D. of triplicates (*p < 0.05 for difference from untreated cells by ANOVA for multiple comparison). d A549 Cells were treated with etoposide for 5 h before determination of ROS. e A549 and H1299 cells were pretreated with increasing concentrations of N-acetylcysteine (NAC) for 30 min before 25 μM etoposide was added. Western blot was conducted 5 h later to determine levels of HIF-1α, HK2, MCT4, Glut1. f A549 cells were transfected with HIF-1α siRNA for 24 h and further treated with 25 μM etoposide for 36 h. Western blot was performed to examine the expression of HK2, MCT4, Glut1. g The cells were first stimulated either with different concentrations of LA or different degree of acidification by adding HCl into medium for 3 h followed by further treatment with 25 μM etoposide for additional 36 h and then lysed for western blot analysis of MRP1, cleaved-PARP and Snail expression. h Gradual titration of NaHCO3 to LA-rich medium dramatically sensitize A549 cells to etoposide treatment as indicated by Cleaved-PARP levels. i Cell apoptosis assay. Addition of NaHCO3 rescued the etoposide-induced apoptosis inhibited by lactate treatment by Annexin-PI dual staining. The quantification was presented in right panel (**p < 0.01, ***p < 0.001, for difference from the untreated cells, ##p<0.01 for difference from etoposide-transfected cells, $$p < 0.01 for difference from the combined etoposide and LA treated cells by ANOVA with Dunnett’s correction for multiple comparisons) j Cell viability assay showed titration of lactic acid with NaNCO3 rescued the etoposide-induced inhibition of cell viability. Corresponding EC50 values for etoposide, Etoposide+LA and Etoposide+LA + NaNCO3 are 20.11 μM, 27.99 μM and 19.71 μM respectively

Similar articles

Cited by

References

    1. Shea M, Costa DB, Rangachari D. Management of advanced non-small cell lung cancers with known mutations or rearrangements: latest evidence and treatment approaches. Ther Adv Respir Dis. 2016;10(2):113–129. doi: 10.1177/1753465815617871. - DOI - PMC - PubMed
    1. Sundar R, et al. Nivolumab in NSCLC: latest evidence and clinical potential. Ther Adv Med Oncol. 2015;7(2):85–96. doi: 10.1177/1758834014567470. - DOI - PMC - PubMed
    1. Topalian SL, et al. Mechanism-driven biomarkers to guide immune checkpoint blockade in cancer therapy. Nat Rev Cancer. 2016;16(5):275–287. doi: 10.1038/nrc.2016.36. - DOI - PMC - PubMed
    1. Daskalow K, et al. Role of hypoxia-inducible transcription factor 1alpha for progression and chemosensitivity of murine hepatocellular carcinoma. J Mol Med (Berl) 2010;88(8):817–827. doi: 10.1007/s00109-010-0623-4. - DOI - PubMed
    1. Sullivan R, Graham CH. Hypoxia prevents etoposide-induced DNA damage in cancer cells through a mechanism involving hypoxia-inducible factor 1. Mol Cancer Ther. 2009;8(6):1702–1713. doi: 10.1158/1535-7163.MCT-08-1090. - DOI - PubMed

Publication types

MeSH terms

Substances