. 2020 Nov 24;86(24):e02038-20.
doi: 10.1128/AEM.02038-20. Print 2020 Nov 24.

Phenotypic and Transcriptomic Analyses of Seven Clinical Stenotrophomonas maltophilia Isolates Identify a Small Set of Shared and Commonly Regulated Genes Involved in the Biofilm Lifestyle

Affiliations

Phenotypic and Transcriptomic Analyses of Seven Clinical Stenotrophomonas maltophilia Isolates Identify a Small Set of Shared and Commonly Regulated Genes Involved in the Biofilm Lifestyle

Ifey Alio et al. Appl Environ Microbiol. .

Erratum in

Abstract

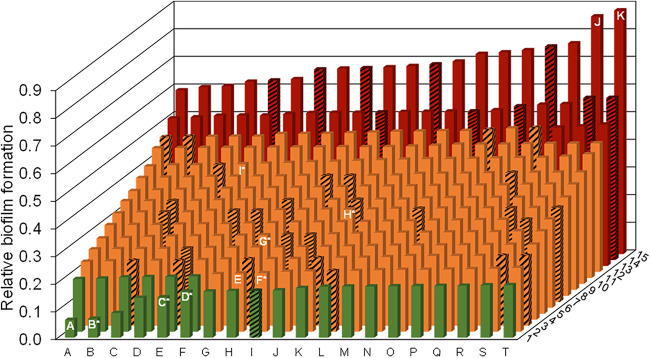
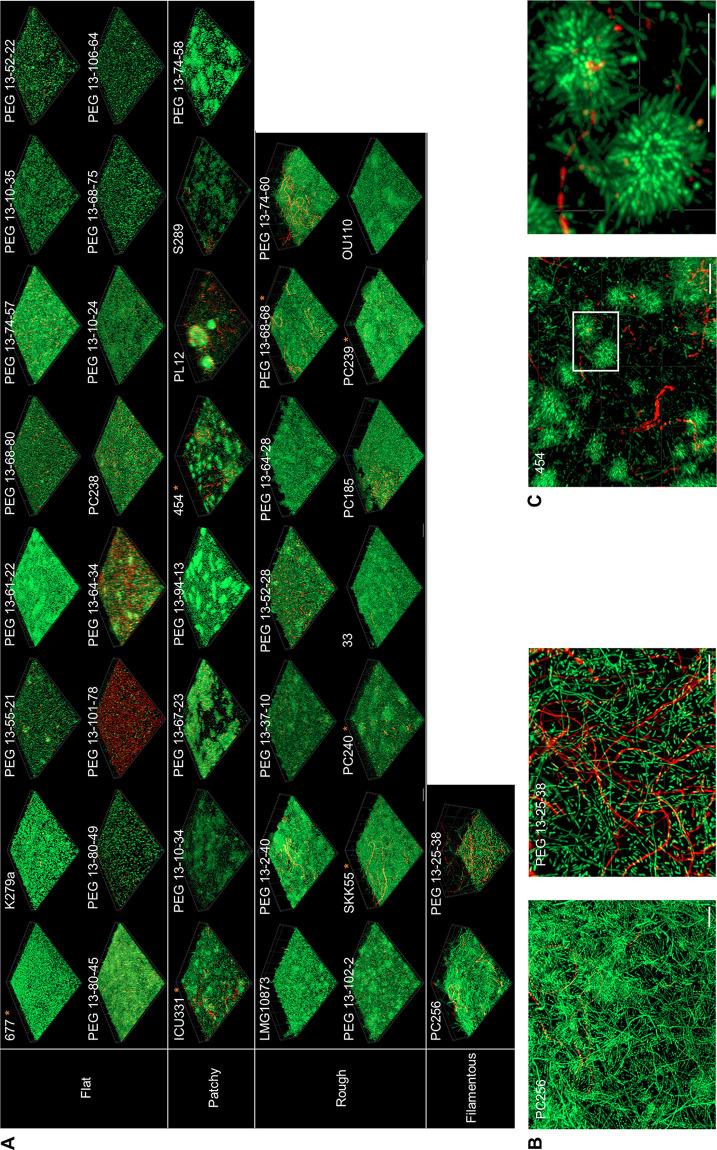
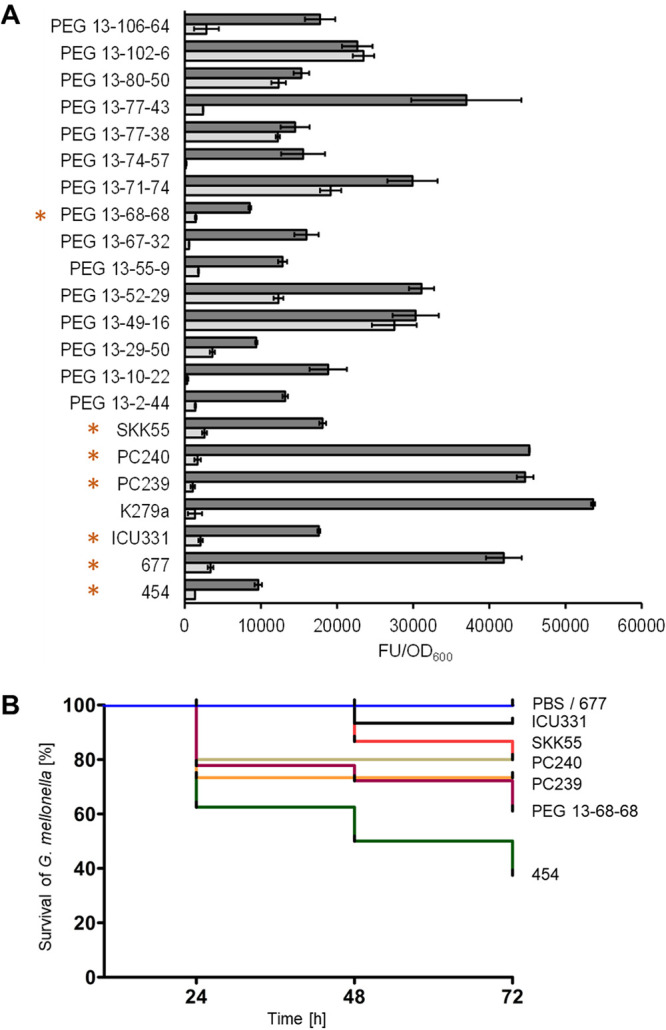
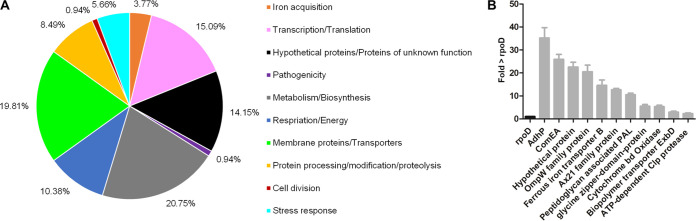
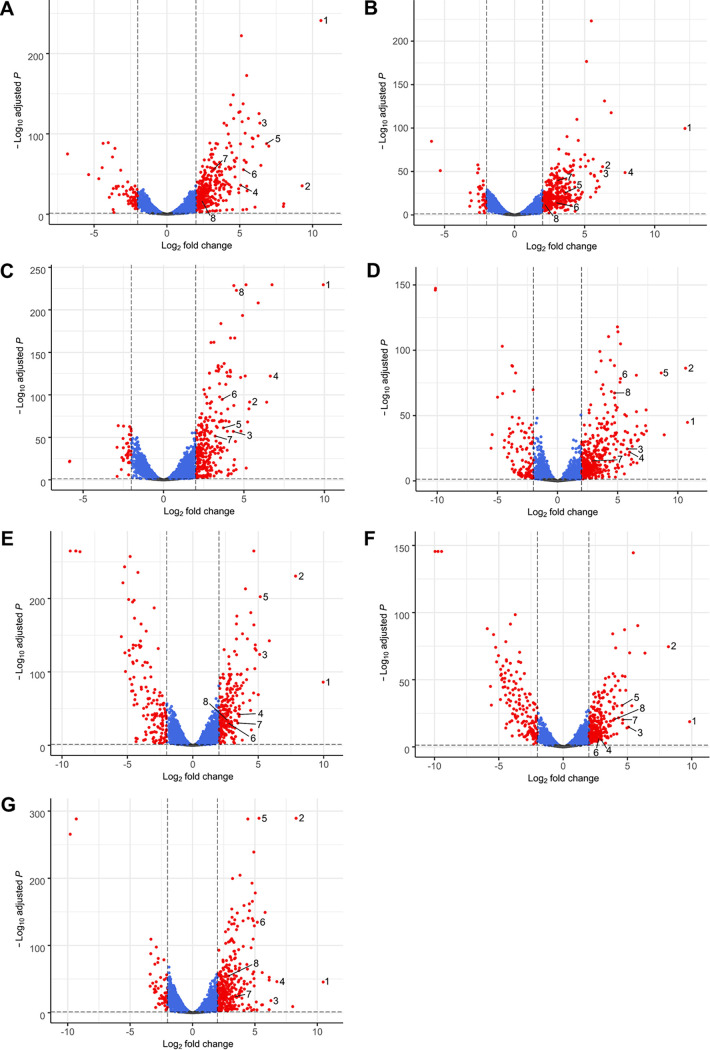
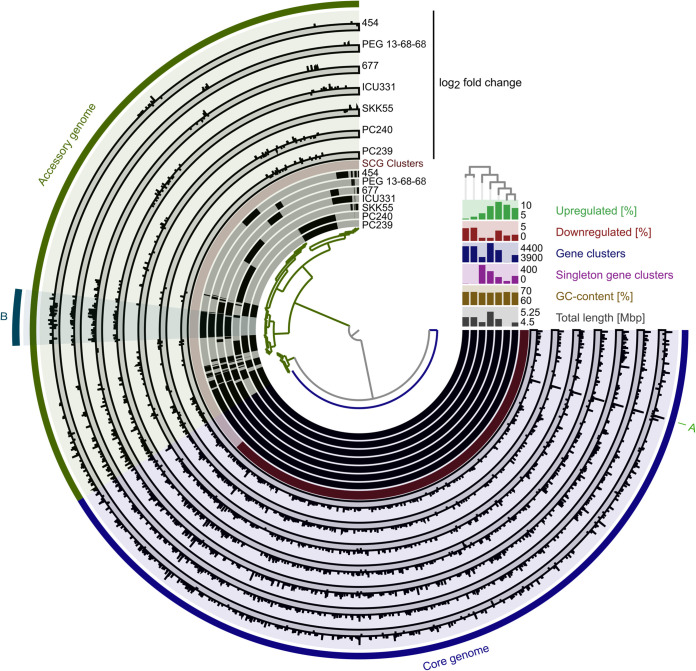
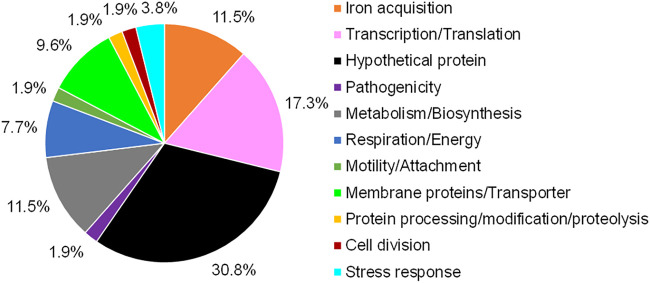
Stenotrophomonas maltophilia is one of the most frequently isolated multidrug-resistant nosocomial opportunistic pathogens. It contributes to disease progression in cystic fibrosis (CF) patients and is frequently isolated from wounds, infected tissues, and catheter surfaces. On these diverse surfaces S. maltophilia lives in single-species or multispecies biofilms. Since very little is known about common processes in biofilms of different S. maltophilia isolates, we analyzed the biofilm profiles of 300 clinical and environmental isolates from Europe of the recently identified main lineages Sgn3, Sgn4, and Sm2 to Sm18. The analysis of the biofilm architecture of 40 clinical isolates revealed the presence of multicellular structures and high phenotypic variability at a strain-specific level. Further, transcriptome analyses of biofilm cells of seven clinical isolates identified a set of 106 shared strongly expressed genes and 33 strain-specifically expressed genes. Surprisingly, the transcriptome profiles of biofilm versus planktonic cells revealed that just 9.43% ± 1.36% of all genes were differentially regulated. This implies that just a small set of shared and commonly regulated genes is involved in the biofilm lifestyle. Strikingly, iron uptake appears to be a key factor involved in this metabolic shift. Further, metabolic analyses implied that S. maltophilia employs a mostly fermentative growth mode under biofilm conditions. The transcriptome data of this study together with the phenotypic and metabolic analyses represent so far the largest data set on S. maltophilia biofilm versus planktonic cells. This study will lay the foundation for the identification of strategies for fighting S. maltophilia biofilms in clinical and industrial settings.IMPORTANCE Microorganisms living in a biofilm are much more tolerant to antibiotics and antimicrobial substances than planktonic cells are. Thus, the treatment of infections caused by microorganisms living in biofilms is extremely difficult. Nosocomial infections (among others) caused by S. maltophilia, particularly lung infection among CF patients, have increased in prevalence in recent years. The intrinsic multidrug resistance of S. maltophilia and the increased tolerance to antimicrobial agents of its biofilm cells make the treatment of S. maltophilia infection difficult. The significance of our research is based on understanding the common mechanisms involved in biofilm formation of different S. maltophilia isolates, understanding the diversity of biofilm architectures among strains of this species, and identifying the differently regulated processes in biofilm versus planktonic cells. These results will lay the foundation for the treatment of S. maltophilia biofilms.

Keywords: Stenotrophomonas; biofilms; transcriptome.


Figures

FIG 1
FIG 1
High strain-specific variation with respect to biofilm formation of 300 clinical and environmental isolates of S. maltophilia. Biofilm forming abilities were analyzed in microtiter plates using the crystal violet stain method. Clinical isolates were grown at 37°C (solid bars) and environmental isolates at 28°C (striped bars) for 24 h. Clinical strains PEG 13-85-49 (A), 454* (B), ICU331* (C), SKK55* (D), K279a (E), 677* (F), PC239* (G), PC240* (H), PEG 13–68-68* (I), PEG 13-2-40 (J), and PEG 13-106-64 (K) are highlighted. The last two formed the strongest biofilms. B to D and F to I were included in the transcriptome and other analyses. K279a (E) was included as a control strain. The relative biofilm formation for 6 technical replicates is illustrated. Strains are positioned from low to strong biofilm formers. OD values of relative biofilm formation ranged from 0.064 to 0.88. Isolates with a relative biofilm OD of ≤0.2 were classified as weak biofilm formers (green), and all isolates with a relative biofilm OD of ≥0.5 were classified as strong biofilm formers (red). All isolates with a relative biofilm OD between 0.2 and 0.5 were classified as moderate biofilm formers (orange). Standard deviations ranged from 0.003 to 0.098. Strains employed in transcriptome and virulence analyses are indicated with asterisks. Coordinates of all isolates together with their metadata are listed in Table S1.
FIG 2
FIG 2
High-level architectural heterogeneity in 40 different clinical S. maltophilia isolates. Biofilm cells were grown under flow or static conditions for 72 h. After a LIVE/DEAD staining, the biofilm architectures were recorded using CLSM. Red, dead cells; green, living cells. (A) The isolates were grouped as forming flat, rough, patchy, and filamentous biofilms based on their overall architectures. Strain identifiers are indicated on the top left corner for each isolate. Strains used in additional transcriptome data are marked with an asterisk. Images represent an area of 100 μm by 100 μm of the respective biofilm. For each of the 40 isolates, at least 3 areas were analyzed. (B) Multicellular and filamentous forms of the isolates PC256 and PEG 13-25-38 are shown via a top view on the biofilm architecture. Scale bar represents 10 μm. (C) Isolate 454 forms rosette-like multicellular clusters of cells. In the right panel, a 4-fold magnification of the boxed area of the left panel is depicted. Scale bar represents 10 μm.
FIG 3
FIG 3
Protease activity and virulence degree vary at a strain-specific level. (A) The extracellular protease activities in biofilm (dark gray) and planktonic (light gray) cultures of 22 clinical isolates were determined in microtiter plates using the EnzCheck protease assay kit. Error bars indicate standard deviations of 3 independent biological replicates. Strains employed in transcriptome and virulence analyses are indicated by an asterisk. (B) The degrees of virulence of S. maltophilia SKK55 (red), 454 (green), ICU331 (black), 677 (gray), PC240 (ochre), PC239 (orange), and PEG 13-68-68 (purple) were tested by recording the survival of Galleria mellonella. PBS (blue) was used as a control. Mortality events were recorded at 24, 48, and 72 h postinfection. FU, fluorescence units.
FIG 4
FIG 4
Global transcriptome analysis of seven biofilm-grown S. maltophilia isolates, SKK55, 454, ICU331, 677, PC240, PC239, and PEG 13-68-68. (A) Functional distribution of the 106 commonly expressed genes (regulated and not regulated) among the top 250 strongly expressed genes in the biofilms of the seven clinical isolates (Table 2). Expression data were extracted from global RNA-seq analyses, and the top 250 strongly expressed genes are listed in Table S4. (B) Mean fold change in relation to the NPKM value of the housekeeping gene rpoD. Error bars indicates standard deviations and are based on three independent biological replicates.
FIG 5
FIG 5
Differentially expressed genes between biofilm and planktonic cells of clinical S. maltophilia isolates. Shown are volcano plots of differentially expressed genes between biofilm and planktonic cells of S. maltophilia 454 (A), ICU331 (B), SKK55 (C), 677 (D), PC239 (E), PC240 (F), and PEG 13-68-68 (G). The 8 strongest commonly upregulated genes in all isolates are indicated by numbers as follows: 1, hypothetical protein (NIPOLPBK_02286); 2, PAS sensor domain-containing protein (NIPOLPBK_03584); 3, TonB-dependent receptor (NIPOLPBK_02287); 4, hemin uptake protein HemP (NIPOLPBK_01535); 5, sulfite reductase flavoprotein alpha subunit (NIPOLPBK_03585); 6, TetR/AcrR family transcriptional regulator (NIPOLPBK_02786); 7, cytochrome b (NIPOLPBK_03926); and 8, flagellin (NIPOLPBK_03906). Locus tags were derived from the 454 genome entry CP060027 and homologues retrieved from the corresponding genomes of the other isolates (see Table 1 for GenBank accession numbers). Genes without significant regulation (Padj > 0.05 [gray]), genes with Padj of <0.05 (blue), and significantly up- or downregulated genes (Padj < 0.05; log2 fold change of greater than 2 or less than −2 [red]) are illustrated. For isolate 454, 338 genes were upregulated of a total gene count of 4,269 genes, while 67 genes were downregulated. Of a total of 4,716 genes, 398 genes were upregulated and 37 genes were downregulated in ICU331. For SKK55, 284 genes were upregulated and 34 genes were downregulated of a total of 4,296 genes. In 677, 421 of 4,433 genes were upregulated, while 116 were downregulated. For PC239, 240 genes were upregulated and 148 genes were downregulated of a total of 4,564 genes. Of a total of 4,564 genes, 262 genes were upregulated and 153 genes were downregulated in PC240. For PEG 13-68-68, 359 genes were upregulated and 57 genes were downregulated of a total of 4,094 genes. Normalized gene read counts were used to build volcano plots.
FIG 6
FIG 6
Pangenome and differential gene expression analysis of seven clinical S. maltophilia isolates. Comparative Anvi’o pangenome analysis of seven clinical S. maltophilia isolates combined with differential gene expression of biofilm versus planktonic cells of these isolates was conducted. The dendrogram in the center represents the relationship between 5,881 gene clusters (GCs) involving 30,168 gene calls. The seven inner layers represent individual genomes, which are compared to each other. In the layers, black indicates the presence of gene clusters and gray their absence. The genomes are organized regarding the presence/absence of GCs as indicated by the phylogenetic tree in the top right. The red layer represents the single gene copy (SCG) clusters, in which dark red indicates the presence and light red the absence of SCG clusters. The next seven layers represents the log2 fold change of gene clusters differently regulated in biofilm versus planktonic cells of individual isolates. The dark gray sublayer indicates the downregulated gene clusters and the light gray ones the upregulated gene clusters in biofilm cells, respectively. The core (blue) and accessory genomes (green) are indicated in the next layer. In the outermost layer, some interesting regions are highlighted (A and B). (A) Hypothetical protein (NIPOLPBK_02286 in strain 454). (B) Among others, several nitrate assimilation-related genes. The right-hand side section reveals the genome length, the GC content, the number of gene clusters present in just one genome, the total gene cluster number, and the proportions of up- and downregulated genes for each isolate.
FIG 7
FIG 7
Functional distribution of commonly upregulated genes in biofilm cells of seven clinical S. maltophilia isolates. Isolates used for the transcriptome analysis were the clinical isolates SKK55, ICU331, 454, 677 PEG 13-68-68, PC239, and PC240. Fifty-two commonly upregulated genes (Table 5) were identified by a Venn analysis and classified by the function of their gene products.

References

    1. Brooke JS, Di Bonaventura G, Berg G, Martinez JL. 2017. Editorial: a multidisciplinary look at Stenotrophomonas maltophilia: an emerging multi-drug-resistant global opportunistic pathogen. Front Microbiol 8:1511. doi: 10.3389/fmicb.2017.01511. - DOI - PMC - PubMed
    1. Denton M, Kerr KG. 1998. Microbiological and clinical aspects of infection associated with Stenotrophomonas maltophilia. Clin Microbiol Rev 11:57–80. doi: 10.1128/CMR.11.1.57. - DOI - PMC - PubMed
    1. Adegoke AA, Stenstrom TA, Okoh AI. 2017. Stenotrophomonas maltophilia as an emerging ubiquitous pathogen: looking beyond contemporary antibiotic therapy. Front Microbiol 8:2276. doi: 10.3389/fmicb.2017.02276. - DOI - PMC - PubMed
    1. Goss CH, Mayer-Hamblett N, Aitken ML, Rubenfeld GD, Ramsey BW. 2004. Association between Stenotrophomonas maltophilia and lung function in cystic fibrosis. Thorax 59:955–959. doi: 10.1136/thx.2003.017707. - DOI - PMC - PubMed
    1. Coutinho HD, Falcao-Silva VS, Goncalves GF. 2008. Pulmonary bacterial pathogens in cystic fibrosis patients and antibiotic therapy: a tool for the health workers. Int Arch Med 1:24. doi: 10.1186/1755-7682-1-24. - DOI - PMC - PubMed

Publication types