. 2020 Oct 23;6(43):eaba0942.
doi: 10.1126/sciadv.aba0942. Print 2020 Oct.

Ångstrom-scale silver particle-embedded carbomer gel promotes wound healing by inhibiting bacterial colonization and inflammation

Affiliations

Ångstrom-scale silver particle-embedded carbomer gel promotes wound healing by inhibiting bacterial colonization and inflammation

Chun-Yuan Chen et al. Sci Adv. .

Abstract

Poor wound healing after diabetes or extensive burn remains a challenging problem. Recently, we presented a physical approach to fabricate ultrasmall silver particles from Ångstrom scale to nanoscale and determined the antitumor efficacy of Ångstrom-scale silver particles (AgÅPs) in the smallest size range. Here we used the medium-sized AgÅPs (65.9 ± 31.6 Å) to prepare carbomer gel incorporated with these larger AgÅPs (L-AgÅPs-gel) and demonstrated the potent broad-spectrum antibacterial activity of L-AgÅPs-gel without obvious toxicity on wound healing-related cells. Induction of reactive oxygen species contributed to L-AgÅPs-gel-induced bacterial death. Topical application of L-AgÅPs-gel to mouse skin triggered much stronger effects than the commercial silver nanoparticles (AgNPs)-gel to prevent bacterial colonization, reduce inflammation, and accelerate diabetic and burn wound healing. L-AgÅPs were distributed locally in skin without inducing systemic toxicities. This study suggests that L-AgÅPs-gel represents an effective and safe antibacterial and anti-inflammatory material for wound therapy.


Figures

Fig. 1
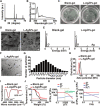
Fig. 1. Characterization of L-AgÅPs and L-AgÅPs-gel.
(A) XRD spectrum of L-AgÅPs. a.u., arbitrary units. (B) UV-vis-NIR spectrum of L-AgÅPs. (C) Digital photos of blank-gel and L-AgÅPs-gel. (D) SEM images of blank-gel and L-AgÅPs-gel. Scale bar, 10 μm. (E) EDS spectra of blank-gel and L-AgÅPs-gel. (F) TEM image of L-AgÅPs-gel. Scale bar, 20 nm. (G) Size distribution of L-AgÅPs (65.9 ± 31.6 Å; n = 306) in carbomer gel calculated from TEM images. (H) Zeta potentials of blank-gel and L-AgÅPs-gel tested by DLS. (I) FTIR spectra of blank-gel and L-AgÅPs-gel. (J) Thermogravimetric curves of blank-gel and L-AgÅPs-gel. (K and L) Rheological characterization of L-AgÅPs-gel by amplitude sweep test (K) and frequency sweep test (L).LVR, linear viscoelastic region. Photo credit: Hao Yin, Central South University.
Fig. 2
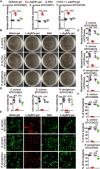
Fig. 2. Antibacterial efficacy of L-AgÅPs-gel in vitro.
(A) Zones of inhibition surrounding the blank-gel–, L-AgÅPs-gel–, or AgNPs-gel–infused paper disks against S. aureus ATCC25923, S. aureus ATCC29213, and P. aeruginosa ATCC27853 on agar plates. (B) Quantification of the average diameters of inhibition zones. n = 3 per group. 1 – β = 1. (C) Digital photos of bacterial colonies grown on agar plates in different treatment groups. (D) Quantification of the numbers of bacterial colonies in (C). n = 3 per group. 1 − β = 1. CFU, colony-forming units. (E and F) Calcein-AM/PI staining images of the above bacteria receiving different treatments for 3 hours (E) and quantification of the ratios of live bacteria [calcein-AM+PI; (F)]. Scale bar, 10 μm. n = 3 per group. 1 − β = 1. (G) Cell viability analysis of bacteria in presence of blank-gel, L-AgÅPs-gel, or AgNPs-gel for 3 hours by alamar blue assay. n = 3 per group. 1 − β = 1. (H) Absorbance of the crystal violet–stained biofilms formed by bacteria treated with blank-gel, L-AgÅPs-gel, or AgNPs-gel for 36 hours. n = 3 per group. 1 − β = 1. (I) Absorbance of the crystal violet–stained survived biofilms exposed to blank-gel, L-AgÅPs-gel, or AgNPs-gel for 36 hours. n = 3 per group. 1 − β = 1. (J) TEM images of ultrathin sections of different bacteria receiving different treatments for 3 hours. Scale bar, 500 nm. *P < 0.05, **P < 0.01, and ***P < 0.001. Photo credit: Chun-Yuan Chen and Hao Yin, Central South University.
Fig. 3
Fig. 3. ROS generation contributes to L-AgÅPs-gel–induced bacterial death.
(A) Intracellular ROS measured by DCFH-DA staining using a fluorescence microplate reader in S. aureus ATCC25923, S. aureus ATCC29213, and P. aeruginosa ATCC27853 treated with blank-gel, L-AgÅPs-gel, NAC, or NAC + L-AgÅPs-gel for 3 hours. n = 3 per group. 1 − β = 1. (B) Digital photos of bacterial colonies on agar plates in blank-gel, L-AgÅPs-gel, NAC, and NAC + L-AgÅPs-gel groups. (C) Bacterial colonies on agar plates were calculated. n = 3 per group. 1 − β = 1. (D) Cell viability of bacteria in different treatment groups measured by alamar blue assay. n = 4 per group. 1 − β = 1. (E and F) Calcein-AM/PI staining images of the above bacteria in different treatment groups (E) and quantification of the ratios of live bacteria [calcein-AM+PI; (F)]. Scale bar, 10 μm. n = 3 per group. 1 − β = 1. **P < 0.01 and ***P < 0.001. Photo credit: Chun-Yuan Chen and Hao Yin, Central South University.
Fig. 4
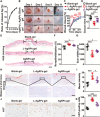
Fig. 4. L-AgÅPs-gel accelerates the healing of skin diabetic wounds.
(A) Release curve of silver from L-AgÅPs-gel packaged in a biomimetic membrane. (B) Gross view of diabetic wounds from female mice treated with blank-gel, L-AgÅPs-gel, or AgNPs-gel at the indicated time points. Scale bar, 2 mm. (C) The rate of wound closure. n = 10 per group. 1 − β = 1. D1, day 1. (D) The time for complete closure of diabetic wounds. n = 10 per group. (E) H&E staining of diabetic wounds. Double-headed arrows indicate the scars. Scale bar, 500 μm. (F and G) Quantification of the re-epithelialization rates (F) and scar widths (G). n = 5 per group. 1 − β = 0.99. (H and I) Masson’s trichrome staining images of diabetic wounds (H) and quantification of the average intensity for Masson-stained areas (I). Scale bar, 100 μm (top) and 50 μm (bottom). n = 5 per group. 1 − β = 0.99. (J and K) Immunohistochemical staining for ki67 in diabetic wounds (J) and quantification of the numbers of ki67-positive cells (K). Scale bar, 50 μm. n = 5 per group. 1 − β = 1. For (C), *P < 0.05 versus blank-gel group, #P < 0.05 versus AgNPs-gel group. *P < 0.05, **P < 0.01, and ***/###P < 0.001. Photo credit: Chun-Yuan Chen and Hao Yin, Central South University.
Fig. 5
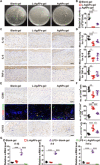
Fig. 5. L-AgÅPs-gel reduces bacterial colonization in diabetic wounds and inhibits inflammation in vivo and in vitro.
(A and B) Homogenates of diabetic wounds treated with blank-gel, L-AgÅPs-gel, or AgNPs-gel were spread onto agar plates and bacterial colonies grown on agar plates were photographed (A) and counted (B). n = 3 per group. 1 − β = 0.99. (C and D) Immunohistochemical staining images of proinflammatory factors including IL-1β, IL-6, and TNF-α in diabetic wounds (C) and quantification of the mean intensities for the areas positive for these proinflammatory factors (D). Scale bar, 50 μm. n = 5 per group. 1 − β = 0.99 (for IL-1β), 0.84 (for IL-6), or 0.96 (for TNF-α). (E) Immunohistochemical or immunofluorescence staining images of M1 (CD86+, brown) and M2 (CD68+CD206+, yellow; CD163+, brown) macrophage markers in diabetic wounds. Scale bar, 50 μm. (F) Quantification of the numbers of CD86+, CD68+CD206+, and CD163+ cells. n = 5 per group. 1 − β = 0.98 (for CD86), 1 (for CD68/CD206), or 0.99 (for CD163). (G) qRT-PCR analysis of Il-1β, Il-6, and Tnf-α in RAW264.7 macrophages receiving different treatments. n = 3 per group. 1 − β = 1. *P < 0.05, **P < 0.01, ***P < 0.001. Photo credit: Hao Yin and Chun-Yuan Chen, Central South University.
Fig. 6
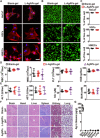
Fig. 6. Biocompatibility, safety, and tissue distribution of L-AgÅPs-gel.
(A) TRITC phalloidin staining of the actin cytoskeleton architecture in normal cells treated with blank-gel or L-AgÅPs-gel for 12 hours. Scale bar, 20 μm. (B) Calcein-AM/PI staining images of HaCaT, HSFs, and HMECs treated with blank-gel or L-AgÅPs-gel for 12 hours. Scale bar, 100 μm. (C) Quantification of the ratios of live cells (calcein-AM+PI) in (B). n = 3 per group. 1 − β = 0.16 (for HaCaT), 0.42 (for HSFs), or 0.22 (for HMECs). (D) Total numbers of red blood cells (RBC), white blood cells (WBC), and platelets (PLT) and total levels of hemoglobin (HGB) in diabetic mice treated with blank-gel, L-AgÅPs-gel or AgNPs-gel for 11 days. n = 5 per group. 1 − β = 0.49 (for RBC), 0.08 (for WBC), 0.05 (for PLT), or 0.19 (for HGB). (E) The serum levels of liver and kidney functional indicators in mice with diabetic wounds. SCr: serum creatinine. n = 4 to 5 per group. 1 − β = 0.08 (for ALT), 0.07 (for AST), 0.19 (for SCr), or 0.25 (for BUN). (F) H&E staining images of brain, heart, liver, spleen, kidney, and lung sections from mice with diabetic wounds. Scale bar, 50 μm. (G) ICP-MS analysis of silver contents in skin wound, brain, heart, liver, spleen, kidney, and lung from mice with diabetic wounds. n = 4 per group.

References

    1. Dainichi T., Kitoh A., Otsuka A., Nakajima S., Nomura T., Kaplan D. H., Kabashima K., The epithelial immune microenvironment (EIME) in atopic dermatitis and psoriasis. Nat. Immunol. 19, 1286–1298 (2018). - PubMed
    1. Blacklow S. O., Li J., Freedman B. R., Zeidi M., Chen C., Mooney D. J., Bioinspired mechanically active adhesive dressings to accelerate wound closure. Sci. Adv. 5, eaaw3963 (2019). - PMC - PubMed
    1. Eming S. A., Martin P., Tomic-Canic M., Wound repair and regeneration: Mechanisms, signaling, and translation. Sci. Transl. Med. 6, 265sr266 (2014). - PMC - PubMed
    1. Kalan L. R., Brennan M. B., The role of the microbiome in nonhealing diabetic wounds. Ann. N. Y. Acad. Sci. 1435, 79–92 (2019). - PubMed
    1. Arifuzzaman M., Mobley Y. R., Choi H. W., Bist P., Salinas C. A., Brown Z. D., Chen S. L., Staats H. F., Abraham S. N., MRGPR-mediated activation of local mast cells clears cutaneous bacterial infection and protects against reinfection. Sci. Adv. 5, eaav0216 (2019). - PMC - PubMed

Publication types

LinkOut - more resources