. 2020 Nov 12;223(Pt 21):jeb222133.
doi: 10.1242/jeb.222133.

Social dynamics obscure the effect of temperature on air breathing in Corydoras catfish

Affiliations

Social dynamics obscure the effect of temperature on air breathing in Corydoras catfish

Mar Pineda et al. J Exp Biol. .

Abstract

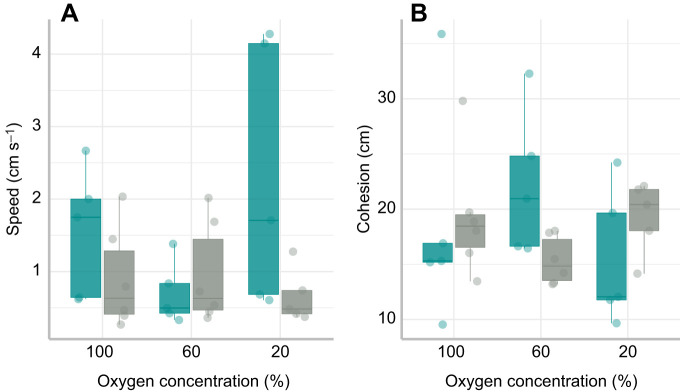
In some fishes, the ability to breathe air has evolved to overcome constraints in hypoxic environments but comes at a cost of increased predation. To reduce this risk, some species perform group air breathing. Temperature may also affect the frequency of air breathing in fishes, but this topic has received relatively little research attention. This study examined how acclimation temperature and acute exposure to hypoxia affected the air-breathing behaviour of a social catfish, the bronze corydoras Corydoras aeneus, and aimed to determine whether individual oxygen demand influenced the behaviour of entire groups. Groups of seven fish were observed in an arena to measure air-breathing frequency of individuals and consequent group air-breathing behaviour, under three oxygen concentrations (100%, 60% and 20% air saturation) and two acclimation temperatures (25 and 30°C). Intermittent flow respirometry was used to estimate oxygen demand of individuals. Increasingly severe hypoxia increased air breathing at the individual and group levels. Although there were minimal differences in air-breathing frequency among individuals in response to an increase in temperature, the effect of temperature that did exist manifested as an increase in group air-breathing frequency at 30°C. Groups that were more socially cohesive during routine activity took more breaths but, in most cases, air breathing among individuals was not temporally clustered. There was no association between an individual's oxygen demand and its air-breathing frequency in a group. For C.aeneus, although air-breathing frequency is influenced by hypoxia, behavioural variation among groups could explain the small overall effect of temperature on group air-breathing frequency.

Keywords: Air-breathing fish; Environmental stress; Metabolic rate; Oxygen; Social behaviour.


Conflict of interest statement

Competing interestsThe authors declare no competing or financial interests.

Figures

Fig. 1.
Fig. 1.
The relationship between log standard metabolic rate and log body mass in Corydoras aeneus. Each data point represents standard metabolic rate (mg O2 h−1) against body mass (g) for an individual fish, acclimated at 25°C (blue) and 30°C (grey). The shading around the regression lines represent 95% confidence intervals.
Fig. 2.
Fig. 2.
Clustering of air-breathing events calculated using a coefficient of dispersion at different oxygen concentrations and acclimation temperatures. Blue bars: 25°C; grey bars: 30°C. Each data point represents the coefficient of dispersion for a trial where any value above 1 indicates that air-breathing events were temporally clustered. The threshold for clustering is shown by the dotted line; data above that line are characteristic of synchronous air-breathing.
Fig. 3.
Fig. 3.
Factors affecting air-breathing frequency in groups. (A) Effect of oxygen concentration on air-breathing frequency (ABF) at 25°C (blue) and 30°C (grey). Each data point represents the total ABF for one group of seven fish (N=6 groups). (B) Effect of cohesion on ABF; ‘cohesion’ refers to how close individuals were to each other within trials, with lower values indicating more cohesion. Each data point represents the total number of air breaths made by a group, and the shading around the regression line represents a 95% confidence interval. The horizontal line within each boxplot represents the median, the upper and lower limits of the boxplot represent the 75th and 25th percentiles, respectively, and the length of the whiskers represents the range of the data.
Fig. 4.
Fig. 4.
The effect of oxygen concentration on air-breathing frequency for individual fish at 25 and 30°C. Blue bars: 25°C; grey bars: 30°C. Each data point represents the total air-breathing frequency for one fish (N=42). The horizontal line within each boxplot represents the median, the upper and lower limits of the boxplot represent the 75th and 25th percentiles, respectively, and the length of the whiskers represents the range of the data.
Fig. 5.
Fig. 5.
Factors affecting activity and cohesion in groups. (A) Effect of oxygen concentration on activity (using speed as a proxy) at 25°C (blue) and 30°C (grey). Each data point represents the total speed for one group of seven fish (N=6 groups). (B) Effect of oxygen concentration on cohesion at 25°C (blue) and 30°C (grey). Each data point represents the cohesion for one group of seven fish (N=6 groups), where smaller cohesion values indicate that individuals within a group were closer together, thus were more cohesive. The horizontal line within each boxplot represents the median, the upper and lower limits of the boxplot represent the 75th and 25th percentiles, respectively, and the length of the whiskers represents the range of the data.

Similar articles

Cited by

References

    1. Ballard W. B. and Robel R. J. (2012). Reproductive importance of dominant male greater prairie chickens. The Auk 91, 75-85. 10.2307/4084663 - DOI
    1. Biro P. A., Abrahams M. V., Post J. R. and Parkinson E. A. (2004). Predators select against high growth rates and risk-taking behaviour in domestic trout populations. Proc. R. Soc. B 271, 2233-2237. 10.1098/rspb.2004.2861 - DOI - PMC - PubMed
    1. Breitburg D., Levin L. A., Oschlies A., Grégoire M., Chavez F. P., Conley D. J. and Zhang J. (2018). Declining oxygen in the global ocean and coastal waters. Science 359, eaam7240 10.1126/science.aam7240 - DOI - PubMed
    1. Chabot D., Steffensen J. F. and Farrell A. P. (2016). The determination of standard metabolic rate in fishes. J. Fish Biol. 88, 81-121. 10.1111/jfb.12845 - DOI - PubMed
    1. Chapman L. J. and Chapman C. A. (1994). Observations of synchronous air breathing in Clarias liocephalus. COPEIA, 1, 246-249. 10.2307/1446696 - DOI

Publication types