Observational Study
. 2020 Oct 23;5(52):eabc1884.
doi: 10.1126/sciimmunol.abc1884.

Itaconate controls the severity of pulmonary fibrosis

Affiliations
Observational Study

Itaconate controls the severity of pulmonary fibrosis

Patricia P Ogger et al. Sci Immunol. .

Abstract

Idiopathic pulmonary fibrosis (IPF) is a fatal lung disease in which airway macrophages (AMs) play a key role. Itaconate has emerged as a mediator of macrophage function, but its role during fibrosis is unknown. Here, we reveal that itaconate is an endogenous antifibrotic factor in the lung. Itaconate levels are reduced in bronchoalveolar lavage, and itaconate-synthesizing cis-aconitate decarboxylase expression (ACOD1) is reduced in AMs from patients with IPF compared with controls. In the murine bleomycin model of pulmonary fibrosis, Acod1−/− mice develop persistent fibrosis, unlike wild-type (WT) littermates. Profibrotic gene expression is increased in Acod1−/− tissue-resident AMs compared with WT, and adoptive transfer of WT monocyte-recruited AMs rescued mice from disease phenotype. Culture of lung fibroblasts with itaconate decreased proliferation and wound healing capacity, and inhaled itaconate was protective in mice in vivo. Collectively, these data identify itaconate as critical for controlling the severity of lung fibrosis, and targeting this pathway may be a viable therapeutic strategy.


Conflict of interest statement

Declaration of interests

Unrelated to the current work, TMM has, via his institution, received industry-academic funding from GlaxoSmithKline R&D and UCB and has received consultancy or speakers fees from Apellis, Astra Zeneca, Bayer, Blade Therapeutics, Boehringer Ingelheim, Bristol-Myers Squibb, Galapagos, GlaxoSmithKline R&D, Indalo, Novartis, Pliant, ProMetic, Respivnat, Roche, Samumed and UCB. PLM received, unrelated to the submitted work, speaker and advisory board fees from Boehringer Ingelheim and Hoffmann-La Roche, via his institution. The authors declare no further conflicts of interest.

Figures

Figure 1
Figure 1. The ACOD1/itaconate axis is decreased in IPF and Acod1-/- mice have worsened phenotype upon bleomycin exposure
(A) Gene expression analysis of ACOD1 in CD206+ sorted AMs from human control (n = 10) and IPF (n = 27) donors. Actb was used as housekeeping gene. (B) Targeted GC-MS analysis of itaconate in bronchoalveolar lavage (BAL) of human control (n = 10) and IPF (n = 47) donors, normalised to total protein (ng/μg protein). (C) Schematic of dosing regimen. WT or Acod1-/- mice were dosed oropharyngeal with 0.05U bleomycin or PBS control at day 0 and harvested at day 7, day 21 or day 42 post bleomycin. (D) Gene expression analysis of Acod1 in lung homogenates of PBS or Bleo dosed mice at day 7, day 21 and day 42 post bleomycin administration; n = 3-8 per group, pooled from two independent experiments. (E) Targeted GC-MS analysis of itaconate in BAL of PBS or Bleo dosed mice at day 7, day 21 and day 42 post bleomycin administration; n = 3-8 per group, pooled from two independent experiments. (F-H) Total BAL cells (F), numbers of BAL AMs (G) and BAL neutrophils (H) in PBS or Bleo dosed WT and Acod1 -/- mice at day 42; n = 3-8 per group, pooled from two independent experiments. (I) Resistance, elastance and compliance at baseline measured by FlexiVent in PBS or Bleo dosed WT and Acod1 -/- mice at day 42 (PBS n = 4 – 7, Bleo n = 10 -12), pooled from two independent experiments and representative of n=3 individual experiments. Data presented as mean ± S.D. Statistical significance tested by Mann-Whitney U test or One-Way ANOVA + Sidak’s multiple comparison test , *P < 0.05, ** P < 0.01, *** P < 0.005, **** P < 0.001.
Figure 2
Figure 2. Acod1 -/- mice have worsened fibrotic phenotype at late time point
(A) Gene expression analysis of Col1α1 Col3α1, Col4α1 and Fn1 in lung homogenate of PBS or Bleo dosed WT and Acod1 -/- mice at day 21 (n = 3-8 per group). Actb was used as housekeeping gene. Pooled from two independent experiments. (B) Fold change hydroxyproline increase in bleomycin compared to PBS in WT and Acod1 -/-mice at day 42 post bleomycin (n = 4-5 per group), representative of three experiments. (C-D) Ashcroft score (C) and representative images (D) of lung slices of PBS or Bleo dosed mice at day 42 post bleomycin stained with Sirius Red, scored blinded by 3-5 individuals. (E) MFI of MitoSOX red superoxide stain in lungs of PBS or Bleo WT and Acod1 -/- mice at day 42 post Bleo (n = 7-12 per group), pooled from two independent experiments and representative of n = 3 individual experiments. Data presented as mean ± S.D. Statistical significance tested by Mann-Whitney U test or One-Way ANOVA + Sidak’s multiple comparison test , *P < 0.05, ** P < 0.01.
Figure 3
Figure 3. Itaconate controls tissue resident AM metabolism
(A) Analysis of the oxygen consumption rate (OCR) of PBS tissue resident-AM (Tr-AM) (n = 3), Bleo Tr-AM (n = 4) and Bleo monocyte recruited-AM (Mo-AM, n = 5) during mitochondrial stress test, assessed after injection of Oligomycin, FCCP and Rotenone/Antimycin A; representative of three independent experiments. (B) Energy map of indicating overall energy state of PBS Tr-AM, Bleo Tr-AM and Bleo Mo-AM; four energy states are shown: quiescent, energetic, aerobic and glycolytic. Same n numbers as in A. (C) Gene expression analysis of Acod1 in BAL PBS Tr-AM, Bleo Tr-AM and Bleo Mo-AM at day 1, day 7 and day 21 (n = 4-7 per group) post bleomycin. Actb was used as housekeeping control. Pooled from three independent experiments. (D) Analysis of the OCR of Bleo WT Mo-AM (n=5) and Acod1 -/- Mo-AM (n=5) during mitochondrial stress test, assessed as in A; data from two experiments pooled. (E) Maximal respiration during mitochondrial stress test (D), defined as the maximal oxygen consumption rate after addition of FCCP. (F) Spare respiratory capacity (SRC) during mitochondrial stress test (D), defined as subtraction of basal from maximal OCR. (G) Basal extracellular acidification rate (ECAR) as surrogate for glycolysis during mitochondrial stress test (D). (H) Analysis of the OCR of Bleo WT Tr-AM (n = 4) and Acod1 -/- Tr-AM (n = 4) during mitochondrial stress test, assessed as in A; data from two experiments pooled. (I) Maximal respiration during mitochondrial stress test (G), calculated as in (E). (J) SRC during mitochondrial stress test (G), defined as in (F). (K) Basal extracellular acidification rate (ECAR) as surrogate for glycolysis during mitochondrial stress test (H). Tr-AM and Mo-AM were sorted at day 7 post bleomycin. Data presented as mean ± S.D. Significance tested by One-Way ANOVA + Sidak’s multiple comparison test, *P < 0.05, ** P < 0.01, *** P < 0.001. Each data point represents 2 - 3 mice pooled.
Figure 4
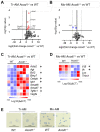
Figure 4. Acod1-deficient tissue resident AMs are more pro-fibrotic post bleomycin
(A – B) Volcano plots showing differentially expressed genes in WT vs Acod1 -/- Tr-AM (A) and Mo-AM (B), 7 days post bleomycin exposure (n = 3 – 4 per group). Genes significantly (p < 0.05) up-regulated in WT vs Acod1 -/- highlighted in red, while genes significantly downregulated are shown in blue. (C–D) Heat map representation of murine fibrosis gene array of FACS sorted Mo-AM (C) and Tr-AM (D) from WT and Acod1 -/- mice. Data shown as log10 of ΔΔCT WT vs Acod1 -/-. (E) Representative images of FACS sorted Tr-AM and Mo-AM WT and Acod1 -/- mice after cytospin and Diff-Quick staining. Significance tested by Two-tailed T-test *P < 0.05.
Figure 5
Figure 5. Adoptive transfer of WT Mo-AMs improves pulmonary fibrosis and rescues tissue resident AM phenotype in Acod1-/- mice post bleomycin
(A) Schematic of dosing regimen and adoptive transfer. WT or Acod1 -/- mice were dosed oropharyngeal with 0.05U bleomycin at day 0, Mo-AMs were FACS sorted at day 7 post bleomycin and transferred into Acod1 -/- mice via the oropharyngeal route. Mice were then harvested after further 14 days, at day 21 post initial bleomycin exposure. (B–C) Ashcroft score (D) and representative images (E) of lung slices of Acod1 -/- mice adoptively transferred with WT or Acod1 -/- Mo-AMs; day 21 post bleomycin stained with Sirius Red, scored blinded by 3-5 individuals. (D) Gene expression analysis of Co1a1, Col3a1, Col4a1 and Fn1 in lung homogenate of Acod1 -/- mice adoptively transferred with WT or Acod1 -/- Mo-AMs (n = 3 – 6 per group); day 21 post bleomycin, Actb was used as housekeeping gene. (E-H) Fraction of CD11b+/MHC II+ and CD11b-/MHC II- Tr-AM (E-F) and Mo-AM (G-H) in BAL of Acod1 -/- mice adoptively transferred with WT or Acod1 -/- Mo-AMs; day 21 post bleomycin. Data presented as mean ± S.D. Significance tested by Mann Whitney U test, *P < 0.05.
Figure 6
Figure 6. Exogenous itaconate limits human lung fibroblast wound healing
(A) Analysis of the OCR of healthy or IPF primary human lung fibroblasts stimulated for 24h with either RPMI medium (con) or 10mM itaconate (IA) during mitochondrial stress test, assessed after injection of Oligomycin, FCCP and Rotenone/Antimycin A (all groups n = 3). (B) Energy map of (A) showing four energy states during mitochondrial stress test: quiescent, energetic, aerobic and glycolytic. Same n numbers as in A. (C) Maximal respiration and spare respiratory capacity (SRC) during mitochondrial stress test (A). Maximal respiration defined as the maximal oxygen consumption rate after addition of FCCP; SRC defined as subtraction of basal from maximal OCR. (D) Proliferation rate of healthy (n = 3) human primary lung fibroblasts stimulated with 10mM itaconate or vehicle control measured using the JULI Stage system. (E) Wound healing capacity of healthy (n = 3) human primary lung fibroblasts stimulated with 10mM itaconate or vehicle control measured using the JuLI Stage system. Two-tailed, unpaired t-test of area under the curve. (F) Gene expression analysis of FN1 and IL-1β in healthy human primary lung fibroblasts stimulated for 24h with 10mM itaconate or vehicle control. IA = itaconate. Data presented as mean ± S.D. Significance was tested by One Way ANOVA + Sidak’s multiple comparison test (A – C), Mann Whitney U test of arear under the curve (D – E) or one-sample t-test against value of 1.0 (F). *P < 0.05, ** P < 0.01.
Figure 7
Figure 7. Inhaled itaconate is anti-fibrotic
(A) Schematic of dosing regime using 8-10 week old C57Bl/6 mice. 0.05U Bleomycin or PBS control and 0.25mg/kg itaconate or PBS control was administered oropharyngeal at indicated time points and mice were harvested at day 21 post bleomycin. (B - C) Ashcroft score and representative images (C) of lung slices stained with Sirius Red, scored blinded by 3-5 individuals. (D) Gene expression analysis of Col1α1, Col3α1, Col4α1 and Fn1 in lung homogenate; Actb was used as housekeeping control. Pooled from two independent experiments. (E) Resistance, elastance and compliance at baseline measured by FlexiVent in PBS and bleomycin dosed mice treated with 0.25mg/kg itaconate or vehicle control. Pooled from two independent experiments. Data presented as mean ± S.D.; n = 7 – 11 per group. Significance was tested by by One-Way ANOVA + Sidak’s multiple comparison test * P < 0.05.

References

    1. Allden SJ, Ogger PP, Ghai P, McErlean P, Hewitt R, Toshner R, Walker SA, Saunders P, Kingston S, Molyneaux PL, et al. The Transferrin Receptor CD71 Delineates Functionally Distinct Airway Macrophage Subsets during Idiopathic Pulmonary Fibrosis. Am J Respir Crit Care Med. 2019;200:209–219. - PMC - PubMed
    1. Atabai K, Jame S, Azhar N, Kuo A, Lam M, McKleroy W, DeHart G, Rahman S, Xia DD, Melton AC, et al. Mfge8 diminishes the severity of tissue fibrosis in mice by binding and targeting collagen for uptake by macrophages. J Clin Invest. 2009;119:3713–3722. - PMC - PubMed
    1. Basler T, Jeckstadt S, Valentin-Weigand P, Goethe R. Mycobacterium paratuberculosis, Mycobacterium smegmatis and lipopolysaccharide induce different transcriptional and post-transcriptional regulation of the IRG1 gene in murine macrophages. J Leukoc Biol. 2006;79:628–638. - PubMed
    1. Bharat A, Bhorade SM, Morales-Nebreda L, McQuattie-Pimentel AC, Soberanes S, Ridge K, et al. Flow cytometry reveals similarities between lung macrophages in humans and mice. Am J Respir Crit Care Med. 2016;54(1):147–149. - PMC - PubMed
    1. Byrne AJ, Powell JE, O’Sullivan BJ, Ogger PP, Hoffland A, Cook J, et al. Dynamics of human monocytes and airway macrophages during healthy aging and after transplant. The Journal of Experimental Medicine. 2020;217(3) - PMC - PubMed

Publication types

MeSH terms