. 2020 Nov 25;40(48):9224-9235.
doi: 10.1523/JNEUROSCI.0686-20.2020. Epub 2020 Oct 23.

Differential Short-Term Plasticity of PV and SST Neurons Accounts for Adaptation and Facilitation of Cortical Neurons to Auditory Tones

Affiliations

Differential Short-Term Plasticity of PV and SST Neurons Accounts for Adaptation and Facilitation of Cortical Neurons to Auditory Tones

Michael J Seay et al. J Neurosci. .

Abstract

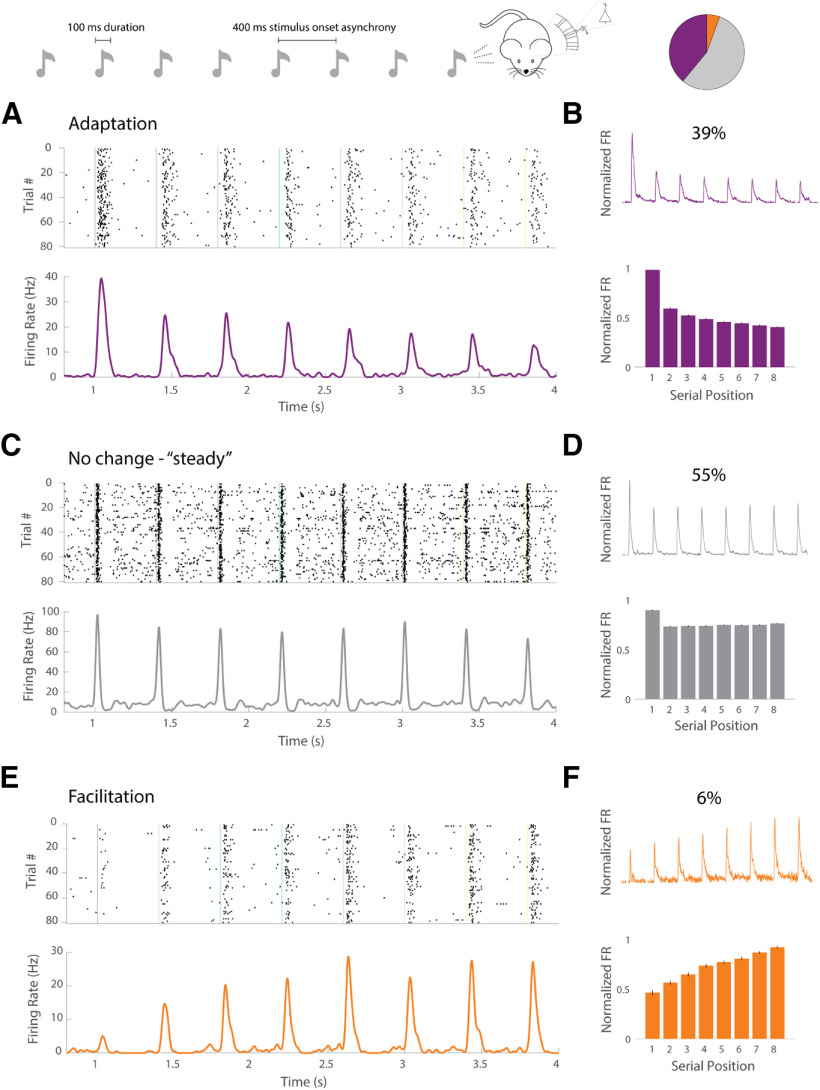
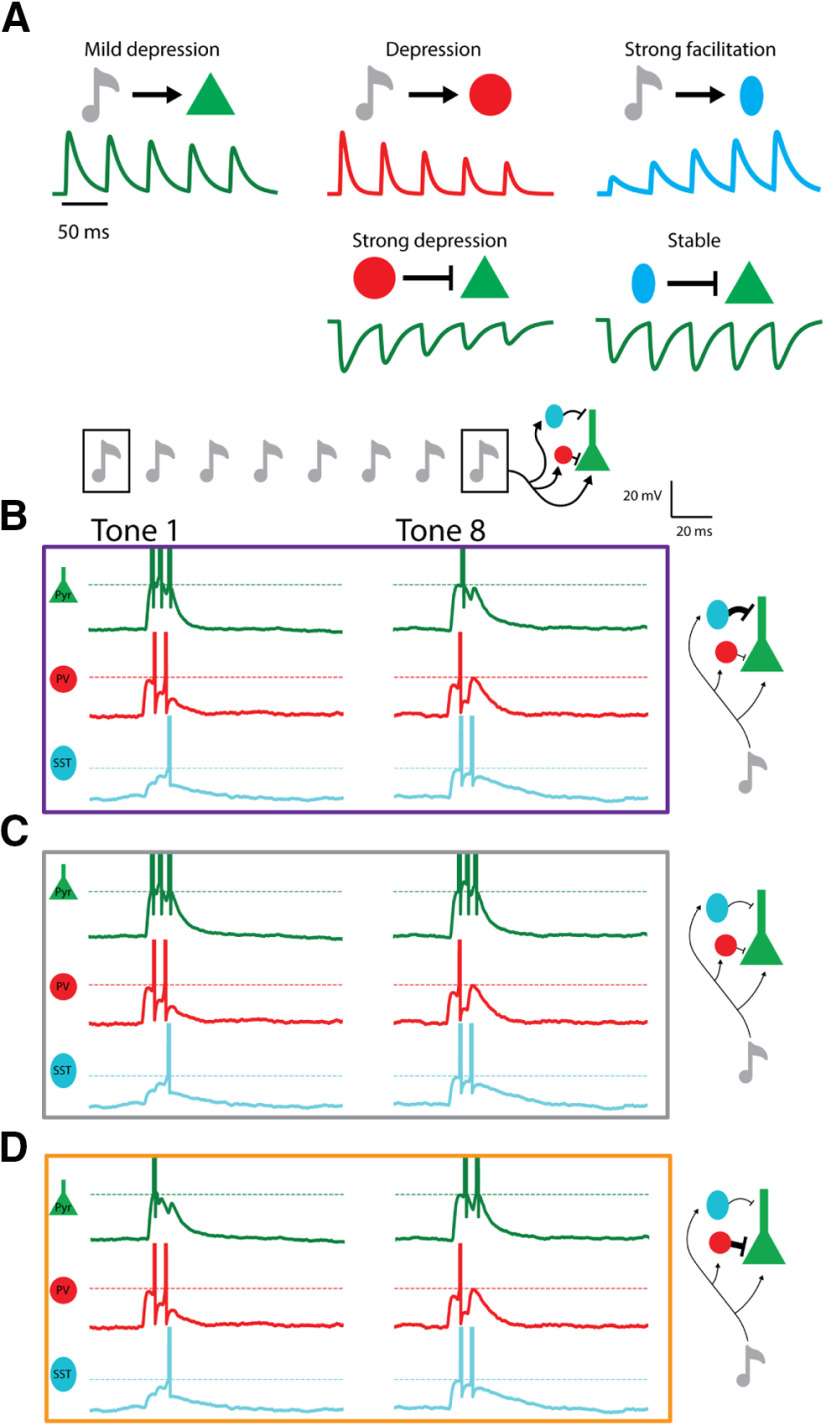
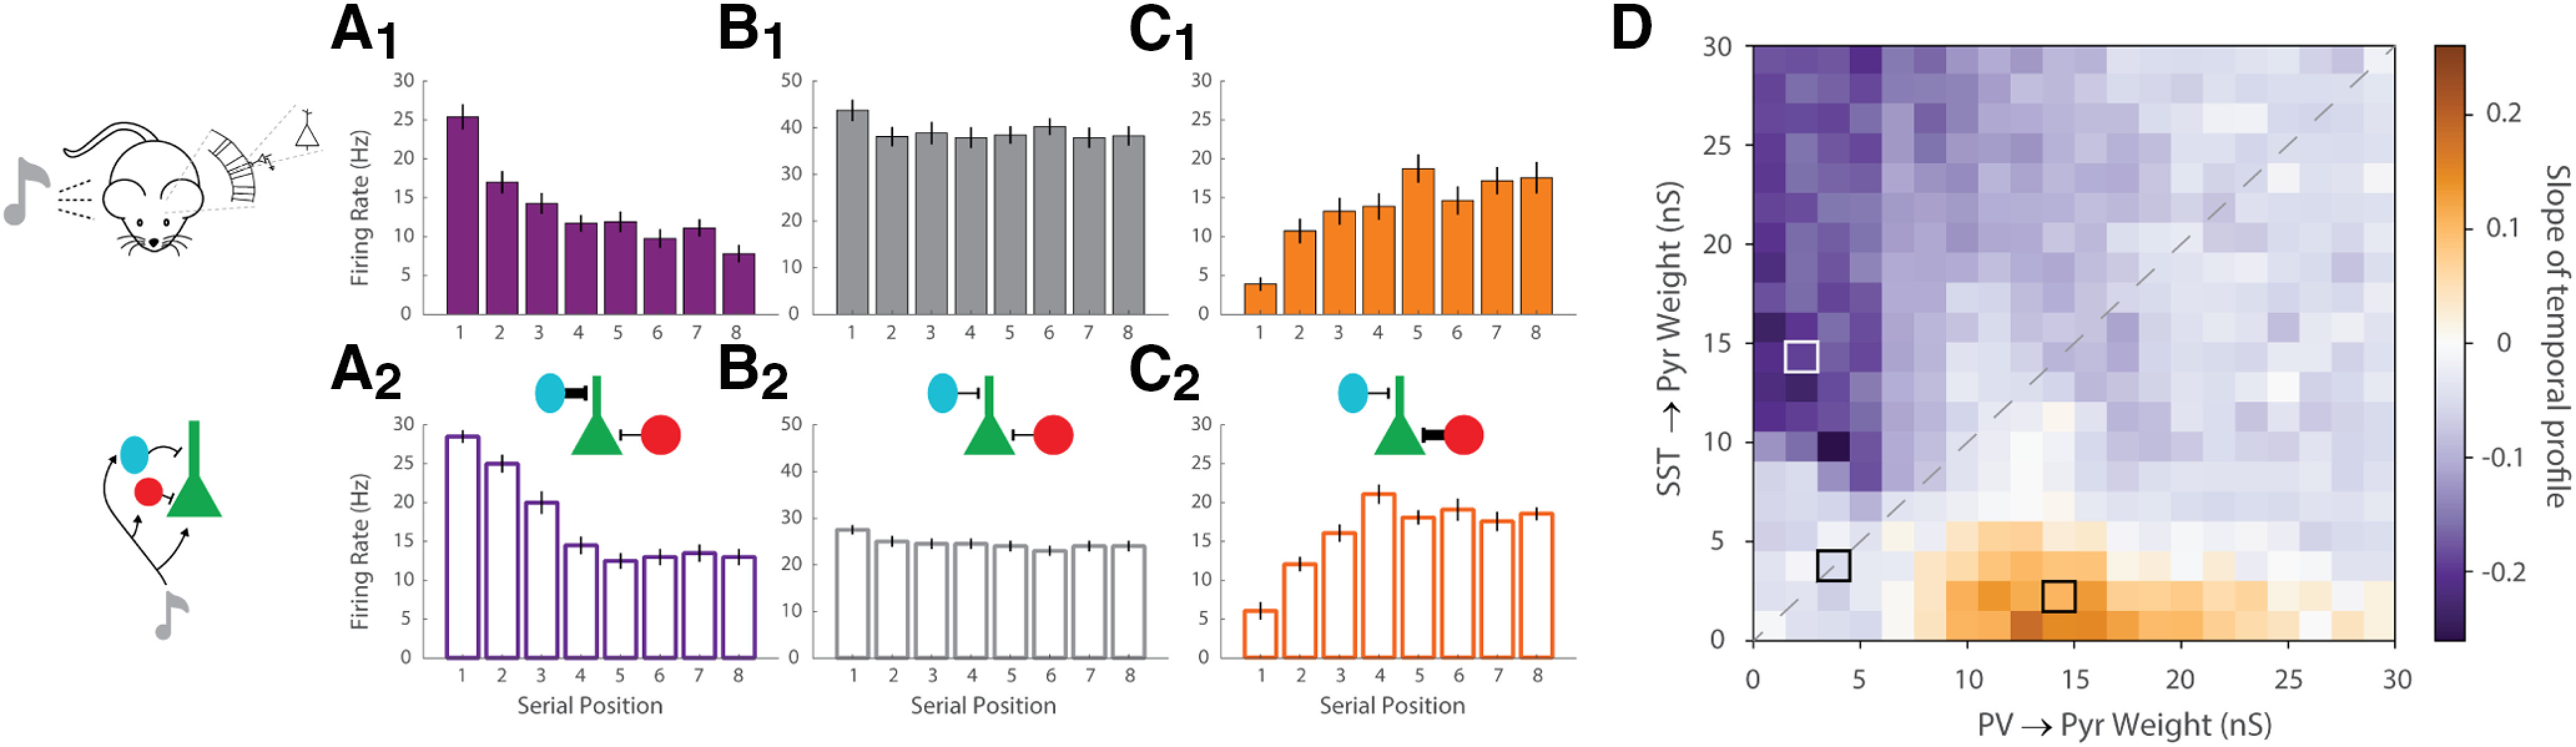
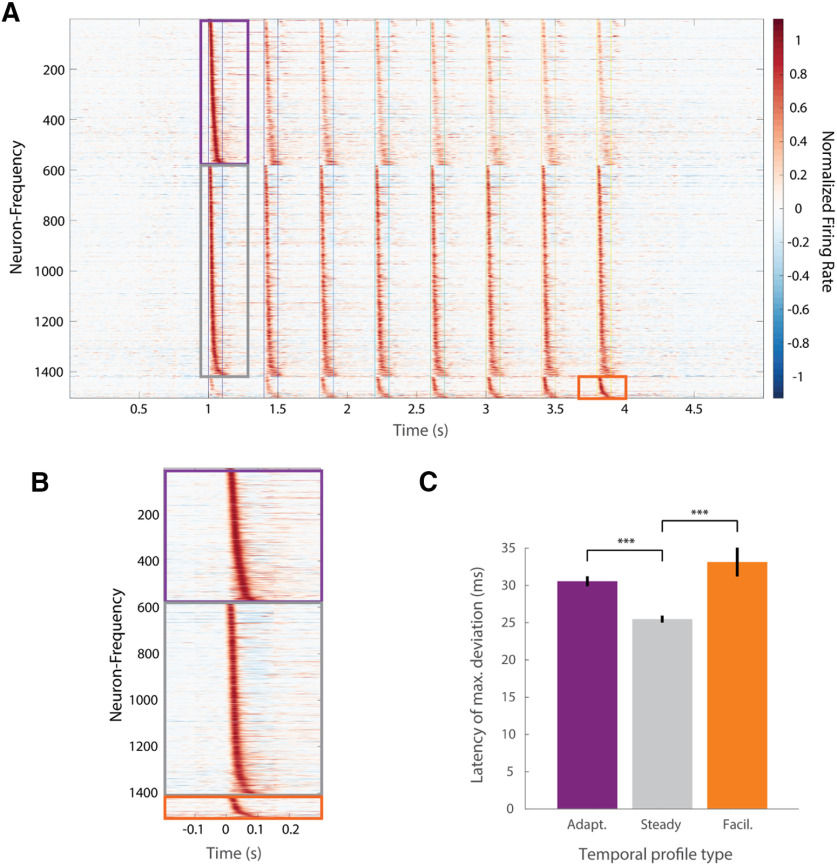
Cortical responses to sensory stimuli are strongly modulated by temporal context. One of the best studied examples of such modulation is sensory adaptation. We first show that in response to repeated tones pyramidal (Pyr) neurons in male mouse auditory cortex (A1) exhibit facilitating and stable responses, in addition to adapting responses. To examine the potential mechanisms underlying these distinct temporal profiles, we developed a reduced spiking model of sensory cortical circuits that incorporated the signature short-term synaptic plasticity (STP) profiles of the inhibitory parvalbumin (PV) and somatostatin (SST) interneurons. The model accounted for all three temporal response profiles as the result of dynamic changes in excitatory/inhibitory balance produced by STP, primarily through shifts in the relative latency of Pyr and inhibitory neurons. Transition between the three response profiles was possible by changing the strength of the inhibitory PV→Pyr and SST→Pyr synapses. The model predicted that a unit's latency would be related to its temporal profile. Consistent with this prediction, the latency of stable units was significantly shorter than that of adapting and facilitating units. Furthermore, because of the history-dependence of STP the model generated a paradoxical prediction: that inactivation of inhibitory neurons during one tone would decrease the response of A1 neurons to a subsequent tone. Indeed, we observed that optogenetic inactivation of PV neurons during one tone counterintuitively decreased the spiking of Pyr neurons to a subsequent tone 400 ms later. These results provide evidence that STP is critical to temporal context-dependent responses in the sensory cortex.SIGNIFICANCE STATEMENT Our perception of speech and music depends strongly on temporal context, i.e., the significance of a stimulus depends on the preceding stimuli. Complementary neural mechanisms are needed to sometimes ignore repetitive stimuli (e.g., the tic of a clock) or detect meaningful repetition (e.g., consecutive tones in Morse code). We modeled a neural circuit that accounts for diverse experimentally-observed response profiles in auditory cortex (A1) neurons, based on known forms of short-term synaptic plasticity (STP). Whether the simulated circuit reduced, maintained, or enhanced its response to repeated tones depended on the relative dominance of two different types of inhibitory cells. The model made novel predictions that were experimentally validated. Results define an important role for STP in temporal context-dependent perception.

Keywords: adaptation; auditory cortex; parvalbumin; short-term synaptic plasticity; somatostatin; temporal.


Figures

Figure 1.
Figure 1.
Single units in A1 exhibit diverse temporal profiles of evoked responses to sequences of repeated tones, including adaptation, no change, and facilitation. In the experiment, a train of eight consecutive repetitions of the same 100-ms pure tone stimulus was presented at a rate of 2.5 Hz. The pie chart at top right shows the proportions of neuron-frequency pairs that exhibited adaptation (purple), stable (gray), or facilitation (orange). A, Spike raster (upper) and PSTH (lower) for a neuron-frequency pair that exhibits classical adaptation, in which sensory responses to the same physical stimulus decrease with repetition on short timescales. B, 39% of neuron-frequencies with significant evoked activity were adapting. Population average normalized PSTH (upper) and bar plot of average normalized firing rate within 10–70 ms following tone onset by serial position (lower). C, Spike raster (upper) and PSTH (lower) for a neuron-frequency pair that exhibits no change or a stable firing rate over repetition. D, 55% of neuron-frequencies with significant evoked activity exhibited no change in firing rate over repetition. E, Spike raster (upper) and PSTH (lower) for a neuron-frequency pair that exhibits facilitation, in which sensory responses to the same physical stimulus increase with repetition on short timescales. F, 6% of neuron-frequencies with significant evoked activity were facilitating.
Figure 2.
Figure 2.
Spiking model of feedforward cortical microcircuit with empirically-based STP. A, Three distinct units were modeled to resemble cortical Pyr (green), fast-spiking PV-expressing interneurons (PV, red), and low-threshold-spiking SST-expressing interneurons (SST, cyan). The change in synaptic currents caused by repeated presynaptic spikes was governed by STP derived from experimental observations. B, Single-unit membrane voltages from a model simulation of the experiment considered here (Natan et al., 2017). Because the SST→Pyr synapse is strong, Pyr unit spiking is suppressed during the eighth tone. C, Single-unit membrane voltages when both the PV→Pyr and SST→Pyr synapses are relatively weak and balanced. Pyr unit spiking is relatively unaffected. D, Single-unit membrane voltages when the PV→Pyr synapse is strong. Pyr unit spiking is strongly suppressed during the first tone but only weakly suppressed during the eighth tone, resulting in facilitation.
Figure 3.
Figure 3.
Model circuit with dual inhibition provided by PV and SOM units reproduced the experimentally observed adaptation (A), steady responses (B), and facilitation (C) by only changing relative strength of PV/SST inhibition (while maintaining STP dynamics fixed). These three temporal profiles reflect three of the weight sets across a systematic parametric analysis of the PV→Pyr and SST→Pyr weights (D). In A–C, the upper filled bar plot displays the average tone-evoked firing rate from 10 to 70 ms for an exemplary experimentally-observed neuron-frequency pair across a minimum of 40 trials, while the bottom, unfilled bar plot displays the average tone-evoked firing rate of the Pyr unit in the model across 20 trials with independent noise when synaptic weights were set as indicated by the inset diagrams and the outlined weight combinations shown in D. All error lines indicate the SEM. A1, Exemple of an experimentally observed adapting response. A2, Simulated adapting Pyr unit. Bars indicate the mean firing rate evoked by a simulated sequence of “tones” based on their serial position. In this simulation, the SST→Pyr synapse was relatively strong, as indicated by the inset circuit diagram. B1, Experimental example of a steady neuron. B2, Simulated steady Pyr unit: both the PV→Pyr and SST→Pyr synapses were relatively weak and balanced, as indicated by the inset circuit diagram. C1, Experimental example of a facilitating Pyr neuron. C2, Simulated facilitating Pyr unit: the PV→Pyr synapse was relatively strong, as indicated by the inset circuit diagram. D, Color-coded heatmap of the slope of the Pyr firing rate across serial positions (i.e., the temporal profile) as the weights PV→Pyr and SST→Pyr synapses were parametrically varied. More intensely purple squares reflect adaptation, while more intensely orange squares reflect facilitation.
Figure 4.
Figure 4.
Temporal profiles are shaped by STP-driven changes in spike latency. A1, Decreasing firing rate in Pyr unit in a circuit in the adaptation regime across consecutive tones. A2, Relationship between firing rate in A1 and first spike latency of SST. Note that the color or each point corresponds to the serial position in A1. B1, Increasing firing rate in Pyr unit in a circuit in the facilitating regime across consecutive tones. Note the relatively narrow range of PV latency changes compared with SST. B2, Relationship between firing rate in A1 and first spike latency of PV. C, Starting from the model results in the adaptation weight regime, we recorded the average tone-evoked latency of SST spikes during the second tone. Then, we re-ran the simulation while artificially replacing the SST unit spiking on tones 3–8 to be the same as the average on tone 2. D, When SST unit spiking was frozen at its latency during tone 2, adaptation was eliminated despite no change in the firing rate of the SST unit.
Figure 5.
Figure 5.
Evoked spike timing differs between temporal profile groups, according to model predictions. A, Image plot of each neuron-frequency pair's PSTH, clustered by temporal profile (adapting, steady, facilitating) and sorted within each temporal profile by the latency of maximal evoked firing. Each row represents a single unit's average PSTH, expressed as the normalized deviation from baseline firing rate. Within adapting and steady temporal profiles, units are sorted by latency of maximum deviation to the first tone. Within the facilitating temporal profile, units are sorted by latency of maximum deviation to the eighth tone. B, The same data in A re-plotted (see outlines) to show the distribution of average spike timing across trials for the time regions surrounding the peak response of that temporal profile. C, Bar plot comparing the mean tone-evoked latencies within each temporal profile. Error lines indicate the SEM. There was a significant difference in response latency among the three classes (χ2(2,1483) = 42.5, p < 0.001). Both the adapting and facilitating classes of neuron-frequency pairs had significantly longer mean response latencies than the stable class (adapting vs stable, Z = 6.18, ***p < 0.001; facilitating vs stable, Z = 3.25, ***p < 0.001), but the adapting and facilitating classes were not different from each other (adapting vs facilitating, Z = −0.28, p = 0.29).
Figure 6.
Figure 6.
Simulated optogenetic inactivation of inhibitory units correctly predicts that PV interneuron inactivation during the first tone causes a decrease in the tone-evoked firing rate during the second tone only for steady and facilitating units. A, Example of an experimentally recorded Pyr neuron in which inactivation of PV interneurons during the first tone decreased the firing rate evoked by the second tone. In the spike raster (upper), the green rectangle indicates trials and window of optical stimulation. The superimposed line plots below display PSTHs (lower) separately for trials with and without optical stimulation during the first tone. B, Effect of simulated PV inhibition on Pyr unit firing rates in adapting (purple), steady (gray), or facilitating (orange) regimes. Bars indicate the mean firing rate evoked by the second in a simulated pair of tones with and without simulated optogenetic inactivation of the PV unit during the first tone. Means were taken across 20 trials. Significant differences were found for the steady and facilitating weight regimes. C, Simulated SST inhibition on Pyr unit firing rate. SST inhibition during the first tone did not significantly alter Pyr firing in any of the three regimes (p > 0.05). D, Experimentally observed effects of PV inhibition on Pyr firing to the subsequent tone, across all three temporal profile classes. Shaded regions indicate the SEM. Significant differences were found only for the steady and facilitating neuron-frequency pairs. E, Mean normalized evoked firing rates of adapting (purple), steady (gray), or facilitating (orange) neuron-frequency pairs in response to SST inhibition. Consistent with the model predictions of the model no significant differences were observed in either class of temporal profiles (p > 0.05). *p < 0.05, **p < 0.01, and ***p < 0.001.

References

    1. Abbott LF, Regehr WG (2004) Synaptic computation. Nature 431:796–803. 10.1038/nature03010 - DOI - PubMed
    1. Ahissar E, Sosnik R, Bagdasarian K, Haidarliu S (2001) Temporal frequency of whisker movement. II. Laminar organization of cortical representations. J Neurophysiol 86:354–367. 10.1152/jn.2001.86.1.354 - DOI - PubMed
    1. Atallah BV, Bruns W, Carandini M, Scanziani M (2012) Parvalbumin-expressing interneurons linearly transform cortical responses to visual stimuli. Neuron 73:159–170. 10.1016/j.neuron.2011.12.013 - DOI - PMC - PubMed
    1. Beierlein M, Gibson JR, Connors BW (2003) Two dynamically distinct inhibitory networks in layer 4 of the neocortex. J Neurophysiol 90:2987–3000. 10.1152/jn.00283.2003 - DOI - PubMed
    1. Brosch M, Schreiner CE (1997) Time course of forward masking tuning curves in cat primary auditory cortex. J Neurophysiol 77:923–943. 10.1152/jn.1997.77.2.923 - DOI - PubMed

Publication types