. 2020 Nov 10;117(45):28442-28451.
doi: 10.1073/pnas.1922033117. Epub 2020 Oct 23.

Simple transformations capture auditory input to cortex

Affiliations

Simple transformations capture auditory input to cortex

Monzilur Rahman et al. Proc Natl Acad Sci U S A. .

Abstract

Sounds are processed by the ear and central auditory pathway. These processing steps are biologically complex, and many aspects of the transformation from sound waveforms to cortical response remain unclear. To understand this transformation, we combined models of the auditory periphery with various encoding models to predict auditory cortical responses to natural sounds. The cochlear models ranged from detailed biophysical simulations of the cochlea and auditory nerve to simple spectrogram-like approximations of the information processing in these structures. For three different stimulus sets, we tested the capacity of these models to predict the time course of single-unit neural responses recorded in ferret primary auditory cortex. We found that simple models based on a log-spaced spectrogram with approximately logarithmic compression perform similarly to the best-performing biophysically detailed models of the auditory periphery, and more consistently well over diverse natural and synthetic sounds. Furthermore, we demonstrated that including approximations of the three categories of auditory nerve fiber in these simple models can substantially improve prediction, particularly when combined with a network encoding model. Our findings imply that the properties of the auditory periphery and central pathway may together result in a simpler than expected functional transformation from ear to cortex. Thus, much of the detailed biological complexity seen in the auditory periphery does not appear to be important for understanding the cortical representation of sound.

Keywords: Marr’s levels of analysis; auditory cortex; encoding models of neural responses; models of the auditory periphery; predicting responses to natural sounds.


Conflict of interest statement

The authors declare no competing interest.

Figures

Fig. 1.
Fig. 1.
Cochleagram produced by each cochlear model for identical inputs. (A) Each column is a different stimulus: a click, 1-kHz pure tone, 10-kHz pure tone, white noise, a natural sound—a 100-ms clip of human speech—and a 5-s clip of the same natural sound (Left to Right). (B) Each row is a different cochlear model.
Fig. 2.
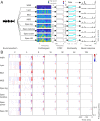
Fig. 2.
Estimating spectrotemporal receptive fields. (A) The encoding scheme: preprocessing by cochlear models to produce a cochleagram (in this case, with 16 frequency channels) followed by the linear–nonlinear encoding model. The parameters of the linear stage (the weight matrix) are commonly referred to as the spectrotemporal receptive field of the neuron. Note how the choice of cochlear model influences estimation of the parameters of both the L and N stages of the encoding scheme and, in turn, prediction of neural responses by the model. (B) The STRF of an example neuron from natural sound dataset 1, estimated by using different cochlear models. Each row is for a cochlear model and each column is the number of frequency channels.
Fig. 3.
Fig. 3.
Performance of different cochlear models in predicting neural responses of NS1. (A) WSR model. (B) Lyon model. (C) BEZ model. (D) MSS model. (E) Spec-log model. (F) Spec-log1plus model. (G) Spec-power model. (H) Spec-Hill model. Each gray dot represents the CCnorm between a neuron’s recorded response and the prediction by the model; the larger black dot represents the mean value across neurons and the error bars are SEM. (I) Comparison of all models. Color coding of the lines matches the other panels.
Fig. 4.
Fig. 4.
Multifiber and multithreshold cochlear models. (A) Cochleagram of a natural sound clip produced by the MSS model (Left) and the spec-Hill model (Right). (B) Cochleagram of the same natural sound clip produced by the multifiber MSS model (Left) and the multithreshold spec-Hill model (Right). (C) Mean CCnorm for predicting the responses of all 73 cortical neurons in NS1 for the multifiber/threshold models and their single-fiber/threshold equivalents. (D) STRFs of an example neuron from NS1, when estimated using the multifiber and multithreshold models. HSR, high spontaneous rate; MSR, medium spontaneous rate; LSR, low spontaneous rate; LTH, low threshold; MTH, medium threshold; HTH, high threshold.
Fig. 5.
Fig. 5.
Performance of different cochlear models across datasets and encoding models. (A and B) Mean CCnorm between the LN encoding model prediction and actual data for all neurons in natural sound dataset 2 (awake ferrets) for single-fiber models (A) and for multifiber models (B). (C and D) Mean CCnorm between the LN encoding model prediction and actual data for all neurons in the DRC dataset (anesthetized ferrets) for single-fiber models (C) and for multifiber models (D). (E and F) Mean CCnorm between the prediction of the NRF model and actual data for all neurons in NS1 (anesthetized ferrets) for single-fiber models (E) and for multifiber models (F). (G and H) Mean CCnorm between the prediction of the NRF model and actual data for all neurons in NS2 for single-fiber models (G) and for multifiber models (H). (I and J) Mean CCnorm between the prediction of the NRF model and actual data for all neurons in the DRC dataset for single-fiber models (I) and for multifiber models (J).

References

    1. Marr D., Poggio T., “From understanding computation to understanding neural circuitry” (Tech. Rep. AIM-357, Artificial Intelligence Laboratory, Massachusetts Institute of Technology, 1976).
    1. Lyon R. F., “A computational model of filtering, detection, and compression in the cochlea in ICASSP ’82” in IEEE International Conference on Acoustics, Speech, and Signal Processing, (Institute of Electrical and Electronics Engineers, 1982), pp. 1282–1285.
    1. Wang K., Shamma S., Self-normalization and noise-robustness in early auditory representations. IEEE Trans. Speech Audio Process. 2, 421–435 (1994).
    1. Wang K., Shamma S. A., Auditory analysis of spectro-temporal information in acoustic signals. IEEE Eng. Med. Biol. Mag. 14, 186–194 (1995).
    1. Chi T., Ru P., Shamma S. A., Multiresolution spectrotemporal analysis of complex sounds. J. Acoust. Soc. Am. 118, 887–906 (2005). - PubMed

Publication types

LinkOut - more resources