. 2020 Oct 23;11(1):5364.
doi: 10.1038/s41467-020-19157-2.

Seasonal modulation of phytoplankton biomass in the Southern Ocean

Affiliations

Seasonal modulation of phytoplankton biomass in the Southern Ocean

Lionel A Arteaga et al. Nat Commun. .

Abstract

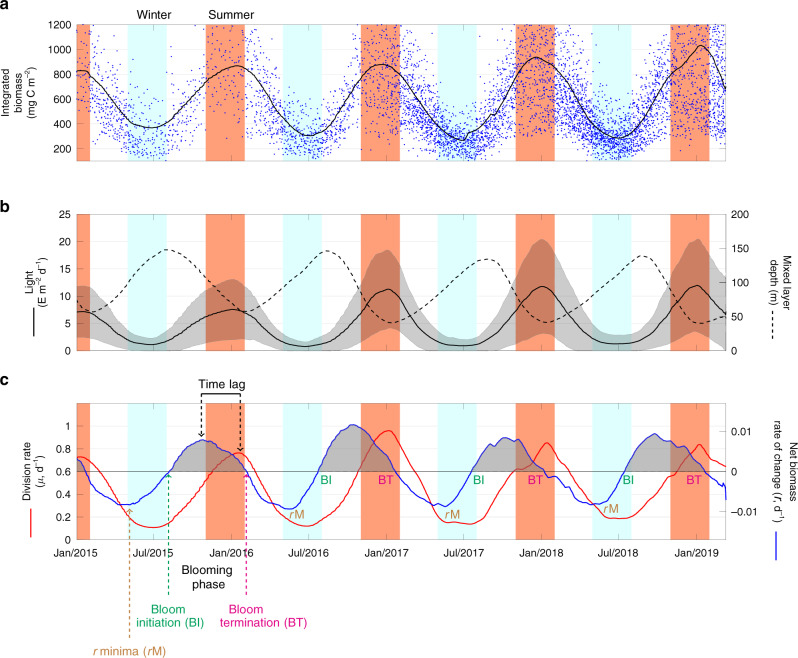
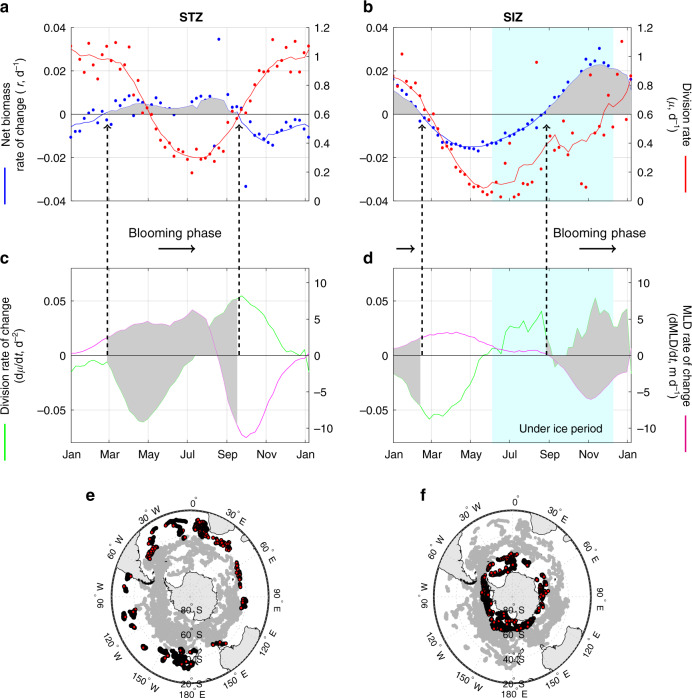
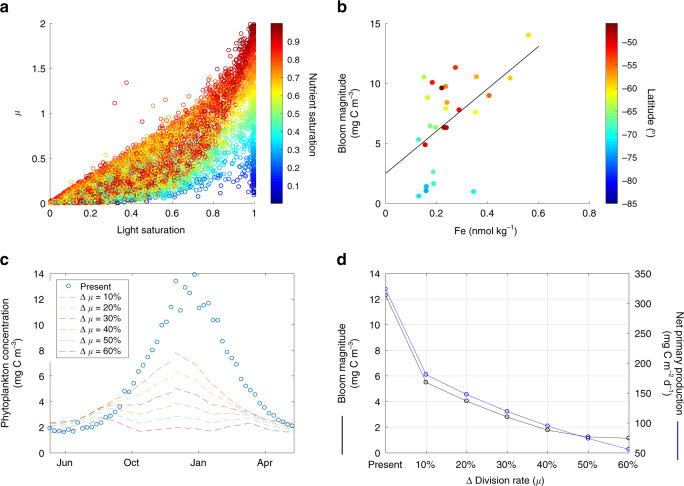
Over the last ten years, satellite and geographically constrained in situ observations largely focused on the northern hemisphere have suggested that annual phytoplankton biomass cycles cannot be fully understood from environmental properties controlling phytoplankton division rates (e.g., nutrients and light), as they omit the role of ecological and environmental loss processes (e.g., grazing, viruses, sinking). Here, we use multi-year observations from a very large array of robotic drifting floats in the Southern Ocean to determine key factors governing phytoplankton biomass dynamics over the annual cycle. Our analysis reveals seasonal phytoplankton accumulation ('blooming') events occurring during periods of declining modeled division rates, an observation that highlights the importance of loss processes in dictating the evolution of the seasonal cycle in biomass. In the open Southern Ocean, the spring bloom magnitude is found to be greatest in areas with high dissolved iron concentrations, consistent with iron being a well-established primary limiting nutrient in this region. Under ice observations show that biomass starts increasing in early winter, well before sea ice begins to retreat. The average theoretical sensitivity of the Southern Ocean to potential changes in seasonal nutrient and light availability suggests that a 10% change in phytoplankton division rate may be associated with a 50% reduction in mean bloom magnitude and annual primary productivity, assuming simple changes in the seasonal magnitude of phytoplankton division rates. Overall, our results highlight the importance of quantifying and accounting for both division and loss processes when modeling future changes in phytoplankton biomass cycles.


Conflict of interest statement

The authors declare no competing interests.

Figures

Fig. 1
Fig. 1. Annual cycles of phytoplankton biomass in the Southern Ocean.
a Annual cycles of phytoplankton carbon integrated from surface to the depth of the mixed layer or euphotic depth (whichever is deeper). Blue dots: Individual float observations. Continuous black line: Average time series of phytoplankton carbon from individual float-based observations for the Southern Ocean. b Black continuous line: Average time series of the mean light level in the surface mixed layer in the Southern Ocean computed as photosynthetically active radiation (PAR) (shaded area represents the standard deviation). Black dashed line: Average time series of the depth of the surface mixed layer. c Red continuous line: Average time series of phytoplankton division rates (μ). Blue continuous line: Average time series of phytoplankton net biomass rate of change rate (r). The phytoplankton blooming phase is defined as the time period where r > 0 (gray shaded area in (c)), constrained between the time of `Bloom initiation' (BI) and `Bloom termination' (BT) of each annual cycle. The `r minima' (rM) point, indicates the moment in which autumn biomass starts to decline at a lower rate prior to the onset of the bloom. Seasonally, a clear `Time lag' exists between μ and r where the highest net biomass rates of change are observed ~3 months before the peak in division rates. Light blue and red shaded panels indicate austral winter (May–August) and summer (November–February) months, respectively. Averaged time series (ac) are based on individual float-based observations for the Southern Ocean. See “Methods” for details on the smoothing of time series.
Fig. 2
Fig. 2. Climatological bloom cycles in the Subantarctic and Polar Antarctic Zone (SAZ and PAZ).
a, b The annual cycle of net phytoplankton biomass rate of change (r, blue line) and division rates (μ, red line) for the SAZ and PAZ. Individual points are weekly averaged observations and continuous line is the result of a smoothing temporal filter (Methods). c, d Averaged time series of the temporal derivative of μ (dμ/dt, green line) and of the mixed layer depth (MLD) (dMLD/dt, magenta line). The blooming phase (r > 0) is highlighted by the gray shaded periods. e, f Bottom maps: Location of float profiles in the SAZ and PAZ.
Fig. 3
Fig. 3. Climatological bloom cycles in the Subtropical and Seasonal Ice Zone (STZ and SIZ).
a, b The annual cycle of net phytoplankton biomass rate of change (r, blue line) and division rates (μ, red line) for the STZ and SIZ. Individual points are weekly averaged observations and the continuous line is the result of a smoothing temporal filter (Methods). c, d Averaged time series of the temporal derivative of μ (dμ/dt, green line) and of the mixed layer depth (MLD) (dMLD/dt, magenta line). The blooming phase (r >  0) is highlighted by the gray shaded periods. The light blue shaded section indicates the period where 50% or more profiles were under ice. e, f Bottom maps: Location of float profiles in the STZ and SIZ.
Fig. 4
Fig. 4. Light and iron controls on phytoplankton blooms and future projections of biomass and productivity.
a Relationship between the mean mixed layer phytoplankton division rate (μ) and light and nutrient saturation indices diagnosed by the phytoplankton growth model. b Relationship between bloom magnitude and the surface iron concentration in the Southern Ocean. The continuous black line is obtained from a least-squares linear regression model with a coefficient of determination (R2) of 0.26 and a p-value = 0.006) (p-value corresponds to an F-test which evaluates whether the linear model fits significantly better than a degenerate model consisting of only a constant term and slope = 0). c Variations in seasonal phytoplankton concentration in the Southern Ocean resulting from a relative decrease (increase) in μ during summer (winter) with respect to the present division rate. d The decrease in mean phytoplankton bloom magnitude (black line and symbols) and annual mean vertically integrated net primary production (NPP, blue line and symbols) in the Southern Ocean as a consequence of relative changes in μ.

References

    1. Parekh, P., Dutkiewicz, S., Follows, M. J. & Ito, T. Atmospheric carbon dioxide in a less dusty world. Geophys. Res. Lett. 33, L03610 (2006).
    1. Longhurst, A. R. In Ecological Geography of the Sea (Second Edition) (ed Longhurst, A. R.) 19– 34 (Academic Press, Burlington, 2007).
    1. Sverdrup HU. On conditions for the vernal blooming of phytoplankton. J. du Cons. Int. pour l’ Exploration de. la Mer. 1953;18:287–295. doi: 10.1093/icesjms/18.3.287. - DOI
    1. Gran HH, Braarud T. A quantitative study of the phytoplankton in the Bay of Fundy and the Gulf of Maine (including observations on hydrography, chemistry and turbidity) J. Biol. Board Can. 1935;1:279–467. doi: 10.1139/f35-012. - DOI
    1. Gran HH. Phytoplankton. methods and problems. J. du Cons. Int. Pour l’Exoploration de. la Mer. 1932;7:343–358. doi: 10.1093/icesjms/7.3.343-a. - DOI

Publication types