. 2020 Oct 23;11(1):5370.
doi: 10.1038/s41467-020-19227-5.

Gene expression and functional deficits underlie TREM2-knockout microglia responses in human models of Alzheimer's disease

Affiliations

Gene expression and functional deficits underlie TREM2-knockout microglia responses in human models of Alzheimer's disease

Amanda McQuade et al. Nat Commun. .

Erratum in

Abstract

The discovery of TREM2 as a myeloid-specific Alzheimer's disease (AD) risk gene has accelerated research into the role of microglia in AD. While TREM2 mouse models have provided critical insight, the normal and disease-associated functions of TREM2 in human microglia remain unclear. To examine this question, we profile microglia differentiated from isogenic, CRISPR-modified TREM2-knockout induced pluripotent stem cell (iPSC) lines. By combining transcriptomic and functional analyses with a chimeric AD mouse model, we find that TREM2 deletion reduces microglial survival, impairs phagocytosis of key substrates including APOE, and inhibits SDF-1α/CXCR4-mediated chemotaxis, culminating in an impaired response to beta-amyloid plaques in vivo. Single-cell sequencing of xenotransplanted human microglia further highlights a loss of disease-associated microglial (DAM) responses in human TREM2 knockout microglia that we validate by flow cytometry and immunohistochemistry. Taken together, these studies reveal both conserved and novel aspects of human TREM2 biology that likely play critical roles in the development and progression of AD.


Conflict of interest statement

M.B.J. is a co-inventor of patent WO/2018/160496 related to differentiation of human pluripotent stem cells into microglia. All other authors declare no competing interests.

Figures
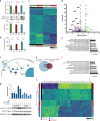
Fig. 1
Fig. 1. TREM2 knockout and stimulation elicit transcriptional changes in iPS-derived microglia.
a Confirmation of isogenic TREM2 knockout lines by western blot (n = 3 or 4 lanes for each of 3 lines; t-test **p < 0.01, Line 1 p = 0.0024, Line 2 p = 0.0098, Line 3 p = 0.0094), homogeneous time resolved fluorescence (HTRF; n = 3 independent wells for each of 3 lines; t-test ****p < 0.0001), and b sTREM2 secretion by HTRF; n = 3 independent wells for each of 3 t-test ****p < 0.0001). Different colors represent individual patient lines. Lighter shades represent KO lines. Data are represented as mean values ± SEM. c Heatmap of DEG for TREM2 WT versus KO (n = 2 independent lines; n = 3/line). Scale represents median-centered VST transformed counts from DESeq2. d Volcano plot showing DEG for TREM2 WT versus KO in 2 independent lines (green—increased expression in KO; purple—decreased expression in KO). e Geneset enrichment analysis of WT vs KO (EnrichR; adj p < 0.05 determined by EnrichR algorithm). Genes in these families were mainly increased in WT cells. f Schematic of TREM2 antibody stimulation paradigm. g Western blot showing phosphorylation of SYK in WT (dark blue) and KO (light blue) microglia within 5–15 min of exposure to the polyclonal TREM2 antibody (AF1828) or control IgG. (20 μg/mL n = 2 independent samples). Data are represented as mean. h Venn diagram of differentially expressed genes in WT vs KO microglia (444 DEGs) compared to WT microglia 24 h after treatment with IgG versus anti-TREM2 antibody (144 DEGs). Venn diagram reveals 72 reciprocally changed DEGs. i Geneset enrichment analysis of reciprocally changed genes (EnrichR; adj p < 0.05 determined by EnrichR algorithm). j Heatmap of the resulting 72 reciprocally changed genes. Scale represents median-centered counts (TPM).
Fig. 2
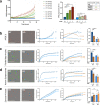
Fig. 2. TREM2 knockout microglia exhibit increased caspase activation at baseline and after cytokine starvation.
a Caspase 3/7 levels imaged over 3 days in culture with complete medium (blue), no TGFB1 (gray), no IL-34, no MCSF (orange)or no IL-34, no MCSF, no TGFB1 (red). Images captured on Incucyte S3 live-cell imager. Darker shades represent TREM2 WT. Data are represented as mean values ± SEM. b Quantification of caspase 3/7 after 0 h in culture. (t-test ****p < 0.0001). Data are represented as mean values ± SEM. c Quantification of caspase 3/7 after 72 h in culture. (ANOVA, Tukey post hoc test. WT vs KO complete medium: p = 0.0052, WT vs KO -TGFB1: p = 0.0035, WT vs KO -IL34/MCSF: p = 0.0014, WT vs KO -IL34/MCSF/TGFB1: p = 0.045, ns: p > 0.9999). For all panels, n = 4 images in four independent wells. Data are represented as mean values ± SEM. Experiment was reproduced with two independent lines.
Fig. 3
Fig. 3. TREM2 knockout decreases phagocytosis of disease-relevant stimuli.
a Isogenic TREM2 WT and KO microglia were exposed to recombinant APOE 2 (green), APOE 3 (yellow), APOE4 (red), or a vehicle control (blue). Images were taken every hour for 24 h with IncuCyte S3 live imaging system. Scale bar: 200 μm. Statistical differences were quantified at 24 h (right, n = 3 independent wells with 4 images per well. Table (right) shows difference between WT and KO lines for each APOE genotype replicated in 2 isogenic backgrounds; two-way ANOVA, Tukey post hoc test, multiple comparisons. WT(veh) vs WT(APOE2): p = 0.0052, WT (APOE2) vs KO (APOE2): p = 0.0075, ****p < 0.0001, ns: p > 0.8.) Data are represented as mean values ± SEM. Microglia were exposed to b recombinant APOE3 (red), c fibrillar fluorescent beta-amyloid (green), d pHrodo-labeled human synaptosomes (green), or e pHrodo-labeled Zymosan A (red). Left shows representative images at 24 h. Inner graphs show untreated cells and the relative effects of TREM2 deletion alone on phagocytosis, or with addition of a SYK inhibitor (5 μM R406). Statistical differences were quantified at 24 h (right). For all panels, n = 3–4 independent wells with 4 images per well; two-way ANOVA, Tukey post hoc test, multiple comparisons. b ***p = 0.0002, ****p < 0.0001, ns p = 0.998 c *p = 0.0393, ****p < 0.0001 d ***p = 0.0008, ****p < 0.0001, ns p = 0.7912 e WT vs WT + R406 p = 0.301, KO vs KO + R406 p = 0.320, WT vs KO p = 0.344. Data are represented as mean values ± SEM. Experiments were replicated in three isogenic lines with equivalent results.
Fig. 4
Fig. 4. Deletion of TREM2 reduces the association of microglia with amyloid plaques and impairs migration toward amyloid and AD model cultures.
a GFP-expressing TREM2 WT (top) or KO (bottom) microglia xenotransplanted into 5x-MITRG mice and aged 6 mo. were examined to assess the proximity between beta-amyloid plaques (red, Amylo-glo) and microglia (green). Scale bar low power: 40 μm; high power: 20 μm. Percent of each genotype within 50 μm of a plaque and raw distance to closest plaque was quantified (t-test ****p < 0.0001, n = 9 individual mice, 4 images per mouse). Darker blue represents TREM2 WT. Data are represented as mean values ± SEM. Experiment was run with two individual patient backgrounds. b In vitro migration of microglia toward soluble recombinant beta-amyloid. Images show microglia plated in outer chambers and allowed to migrate for 4 days through microfluidic channels toward beta-amyloid (Aβ1–40 and Aβ1–42) within the inner chamber (delineated by the dashed circle). Scale bar: 500 μm. (n = 3 independent devices, unpaired t-test *p = 0.0114; WT vs WT + Aβ1–40 and Aβ1–42 p = 0.0076). Data are represented as mean values ± SEM. c WT and TREM2 knockout microglial migration toward 3-week old Aβ-producing human neural and astrocyte mixed cultures or toward 9-week old wild type cultures. Scale bar: 500 μm. (n = 3 independent devices unpaired t-test **p < 0.001; WT vs KO p = 0.0078; WT vs WT(AD) vs WT (healthy) p = 0.0063). Data are represented as mean values ± SEM. Experiments from b,c were reproduced with equivalent results in two independent lines. d Scratch wound assay imaged and quantified 24 h post scratch with IncuCyte WoundMaker revealed no significant differences in general motility (n = 3 independent wells with 4 images per well, t-test p = 0.102). Yellow line demarcates original scratch. Data are represented as mean values  ± SEM. Experiment was reproduced in three independent lines. Scale bar: 200 μm.
Fig. 5
Fig. 5. TREM2 knockout microglia are deficient in CXCR4 which is required for migration.
a Expression of CXCR4 (green), IBA-1 (red) in in vitro TREM2 isogenic lines. CXCR4 signal was normalized to DAPI (blue) intensity. Scale bar: 40 μm. In quantification, darker shades represent TREM2 WT. (n = 4 independent wells, 4 images per well, Experiment replicated in three independent lines; unpaired t-test p = 0.0015). Data are represented as mean values ± SEM. b Flow cytometry of CXCR4:APC (gated on fluorescence minus one (FMO) control (gray)) and quantification of mean fluorescence intensity (MFI) (n = 3 independent samples (100,000 events each), unpaired t-test p = 0.0017). Data are represented as mean values ± SEM. Gating strategy in Source data file. Reproduced with all three isogenic sets with similar results. c Overlay of maximum intensity projection images over time of Fluo-4 (green) and Fura-Red (red) loaded WT and TREM2 KO cells after activation with SDF-1α (left panel, Scale bar: 20 μm). Time-lapse run showing average cytosolic Ca2+ response to 250 ng/mL SDF-1α measured by ratiometric Fluo-4 and Fura-Red signal (middle panel, Data are mean ± SEM; n = 51–61 cells). Summary of single cell baseline and maximal SDF-1α induced Ca2+ elevation in WT and KO microglia (right panel, Data are mean ± SEM, n = 111–120 cells, 2 experiments). Y-axis denotes either peak baseline or peak SDF-1α response subtracted from the average baseline for each cell (****p < 0.0001, n.s not significant, as measured by One-way ANOVA; Post-hoc Tukey’s multiple comparisons test). d WT microglia were allowed to migrate to 9-week old healthy or beta-amyloid producing (AD) neural/glial cultures plated within the central chamber (white dashed circle). Microglia pseudocolored gray. AMD3100 was used at 10 ng/mL. Scale bar: 50 μm (unpaired t-test, p = 0.003) Experiment was reproduced in two lines (total n = 5). Data are represented as mean values ± SEM.
Fig. 6
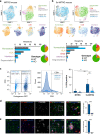
Fig. 6. Deletion of TREM2 suppresses the development of disease-associated microglia (DAMs) in vivo.
UMAP plots from WT and TREM2 knockout microglia transplanted into a a MITRG or b 5x-MITRG mouse. Top left shows the TREM2 genotype of each cell in the plot (gray = WT, blue = TREM2 KO) and the adjacent UMAP shows the clustering of human microglia sub-populations in non-diseased mice. Pie charts highlight the relative distribution of each TREM2 genotype within each cluster. The lower four UMAP plots demonstrate the relative expression of known homeostatic (green), human leukocyte antigen (HLA, yellow), interferon (pink), and DAM (red) markers. Homeostatic: CX3CR1, P2RY12, P2RY13, TMEM119, SALL1. HLA: HLA-DRA, HLA-DRB1, HLA-DRB5, HLA-DPA1, HLA-DPB1, HLA-DMA, HLA-DQA1, HLA-DQA2, HLA-DQB1, CD74. Interferon: IFIT1, IFIT2, ISG15, IFI6, IFITM3, MX1, MX2, STAT1. DAM: CD9, TREM2, SPP1, ITGAX, CD83, APOC1, LGALS3. Bar graphs show relative cluster percentages for each cell type. c Flow cytometry of co-transplanted TREM2 WT and KO microglia. Left dot plot shows GFP positive WT microglia (and GFP negative KO microglia) expression of CD9. Middle plot shows the same data as a histogram pre-split on RFP/GFP expression. As in (a), expected % CD9+ cells is around 5–10%. Right plot shows the quantification of all animals n = 6 independent 5x-MITRG mice and 4 MITRG mice. (two way ANOVA with Tukey post hoc test, *p = 0.018; **p = 0.0099, ns p = 0.916). Data are represented as mean values±SEM. Gating strategy in Source data file. d Histological analysis of human microglia within the 5x-MITRG mouse confirms TREM2 WT microglia (RFP+) express higher levels of the activation markers d HLA-DRB1 (gray) and e CD9 than TREM2 knockout microglia (GFP+). Reverse permutation of WT/KO shown in Supplementary Fig. 6. Scale bar low power: 40μm high power: 10μm (n=9 individual mice per genotype with 4 images per mouse. unpaired t-test two-tailed ****p < 0.0001). Transplants were completed with one isogenic set. Data are represented as mean values±SEM.

References

    1. Jansen, I. E. et al. Genome-wide meta-analysis identifies new loci and functional pathways influencing Alzheimer’s disease risk. Nat. Genet. 10.1038/s41588-018-0311-9 (2019). - PMC - PubMed
    1. Lambert JC, et al. Meta-analysis of 74,046 individuals identifies 11 new susceptibility loci for Alzheimer’s disease. Nat. Genet. 2013;45:1452–1458. doi: 10.1038/ng.2802. - DOI - PMC - PubMed
    1. McQuade A, Blurton-Jones M. Microglia in Alzheimer’s disease: Exploring how genetics and phenotype influence risk. J. Mol. Biol. 2019;431:1805–1817. doi: 10.1016/j.jmb.2019.01.045. - DOI - PMC - PubMed
    1. Jonsson T, et al. Variant of TREM2 associated with the risk of Alzheimer’s disease. N. Engl. J. Med. 2013;368:107–116. doi: 10.1056/NEJMoa1211103. - DOI - PMC - PubMed
    1. Shi, Y. & Holtzman, D. M. Interplay between innate immunity and Alzheimer disease: APOE and TREM2 in the spotlight. Nat. Rev. Immunol.10.1038/s41577-018-0051-1 (2018). - PMC - PubMed

Publication types

MeSH terms