

Interactions between the microbiome and mating influence the female's transcriptional profile in Drosophila melanogaster
- PMID: 33097776
- PMCID: PMC7584617
- DOI: 10.1038/s41598-020-75156-9
Interactions between the microbiome and mating influence the female's transcriptional profile in Drosophila melanogaster
Abstract
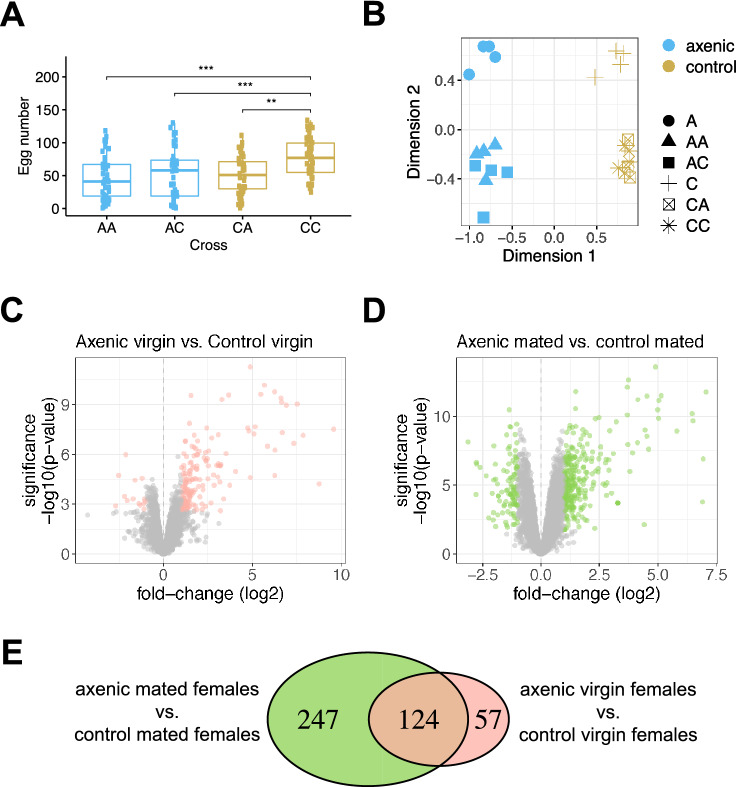
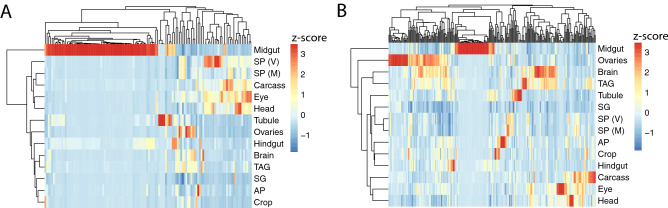
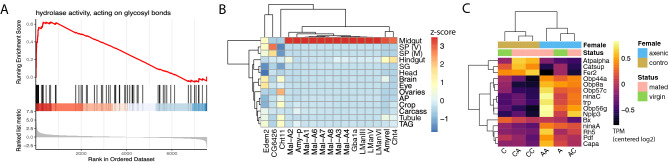
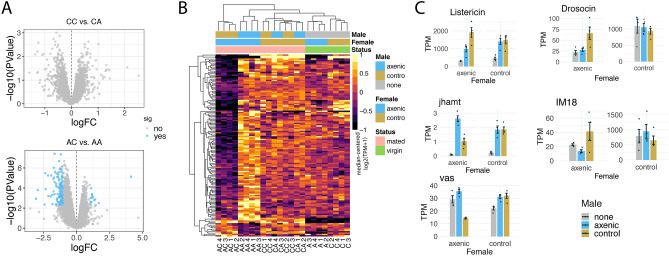
Drosophila melanogaster females undergo a variety of post-mating changes that influence their activity, feeding behavior, metabolism, egg production and gene expression. These changes are induced either by mating itself or by sperm or seminal fluid proteins. In addition, studies have shown that axenic females-those lacking a microbiome-have altered fecundity compared to females with a microbiome, and that the microbiome of the female's mate can influence reproductive success. However, the extent to which post-mating changes in transcript abundance are affected by microbiome state is not well-characterized. Here we investigated fecundity and the post-mating transcript abundance profile of axenic or control females after mating with either axenic or control males. We observed interactions between the female's microbiome and her mating status: transcripts of genes involved in reproduction and genes with neuronal functions were differentially abundant depending on the females' microbiome status, but only in mated females. In addition, immunity genes showed varied responses to either the microbiome, mating, or a combination of those two factors. We further observed that the male's microbiome status influences the fecundity of both control and axenic females, while only influencing the transcriptional profile of axenic females. Our results indicate that the microbiome plays a vital role in the post-mating switch of the female's transcriptome.
Conflict of interest statement
The authors declare no competing interests.
Figures
Similar articles
-
Drosophila seminal sex peptide associates with rival as well as own sperm, providing SP function in polyandrous females.Elife. 2020 Jul 16;9:e58322. doi: 10.7554/eLife.58322. Elife. 2020. PMID: 32672537 Free PMC article.
-
Transcriptional programs are activated and microRNAs are repressed within minutes after mating in the Drosophila melanogaster female reproductive tract.BMC Genomics. 2023 Jun 27;24(1):356. doi: 10.1186/s12864-023-09397-z. BMC Genomics. 2023. PMID: 37370014 Free PMC article.
-
The seminal odorant binding protein Obp56g is required for mating plug formation and male fertility in Drosophila melanogaster.bioRxiv [Preprint]. 2023 Feb 7:2023.02.03.526941. doi: 10.1101/2023.02.03.526941. bioRxiv. 2023. Update in: Elife. 2023 Dec 21;12:e86409. doi: 10.7554/eLife.86409. PMID: 36798169 Free PMC article. Updated. Preprint.
-
She's got nerve: roles of octopamine in insect female reproduction.J Neurogenet. 2021 Sep;35(3):132-153. doi: 10.1080/01677063.2020.1868457. Epub 2021 Apr 28. J Neurogenet. 2021. PMID: 33909537 Free PMC article. Review.
-
Facultative adjustment of the offspring sex ratio and male attractiveness: a systematic review and meta-analysis.Biol Rev Camb Philos Soc. 2017 Feb;92(1):108-134. doi: 10.1111/brv.12220. Epub 2015 Sep 25. Biol Rev Camb Philos Soc. 2017. PMID: 26405787
Cited by
-
Neurobiology of Pathogen Avoidance and Mate Choice: Current and Future Directions.Animals (Basel). 2024 Jan 17;14(2):296. doi: 10.3390/ani14020296. Animals (Basel). 2024. PMID: 38254465 Free PMC article. Review.
-
Seminal fluid proteins induce transcriptome changes in the Aedes aegypti female lower reproductive tract.BMC Genomics. 2021 Dec 15;22(1):896. doi: 10.1186/s12864-021-08201-0. BMC Genomics. 2021. PMID: 34906087 Free PMC article.
-
Drosophila Model for Studying Gut Microbiota in Behaviors and Neurodegenerative Diseases.Biomedicines. 2022 Mar 3;10(3):596. doi: 10.3390/biomedicines10030596. Biomedicines. 2022. PMID: 35327401 Free PMC article. Review.
-
Beneficial commensal bacteria promote Drosophila growth by downregulating the expression of peptidoglycan recognition proteins.iScience. 2022 May 5;25(6):104357. doi: 10.1016/j.isci.2022.104357. eCollection 2022 Jun 17. iScience. 2022. PMID: 35601912 Free PMC article.
-
Differences in Gut Microbiome Composition Between Sympatric Wild and Allopatric Laboratory Populations of Omnivorous Cockroaches.Front Microbiol. 2021 Jul 28;12:703785. doi: 10.3389/fmicb.2021.703785. eCollection 2021. Front Microbiol. 2021. PMID: 34394050 Free PMC article.
References
Publication types
MeSH terms
Grants and funding
LinkOut - more resources
Full Text Sources
Molecular Biology Databases
