. 2020 Oct 23;10(1):18166.
doi: 10.1038/s41598-020-75321-0.

Adipocyte lipolysis drives acute stress-induced insulin resistance

Affiliations

Adipocyte lipolysis drives acute stress-induced insulin resistance

Vidisha Raje et al. Sci Rep. .

Abstract

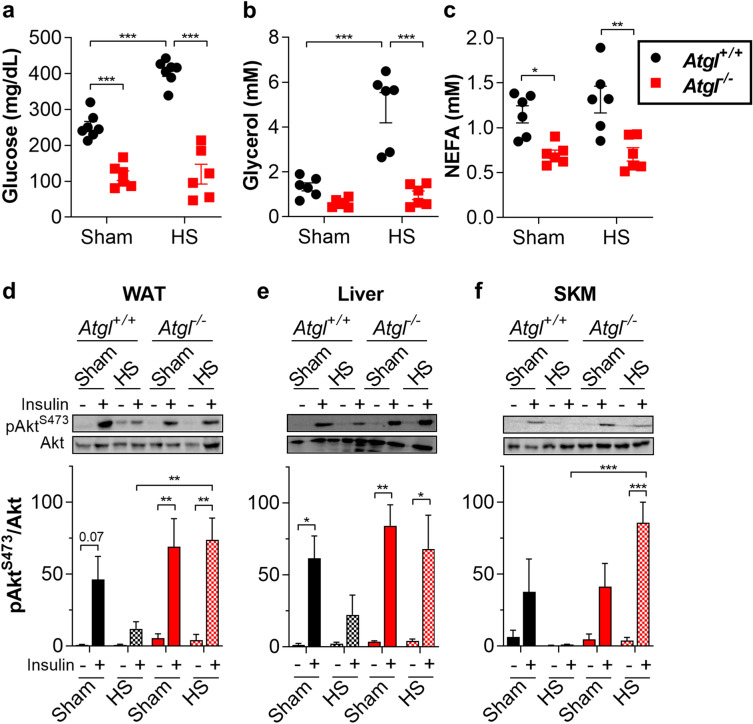
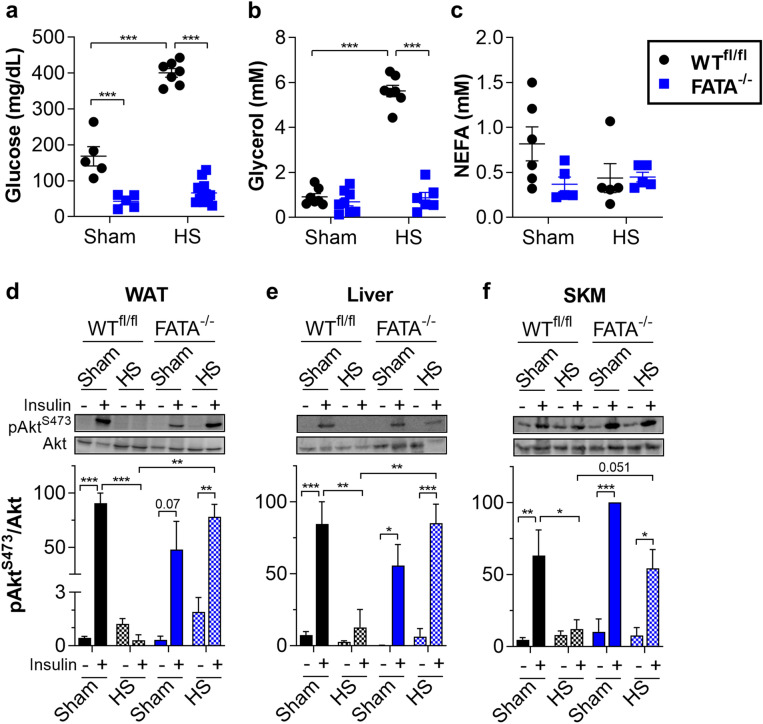
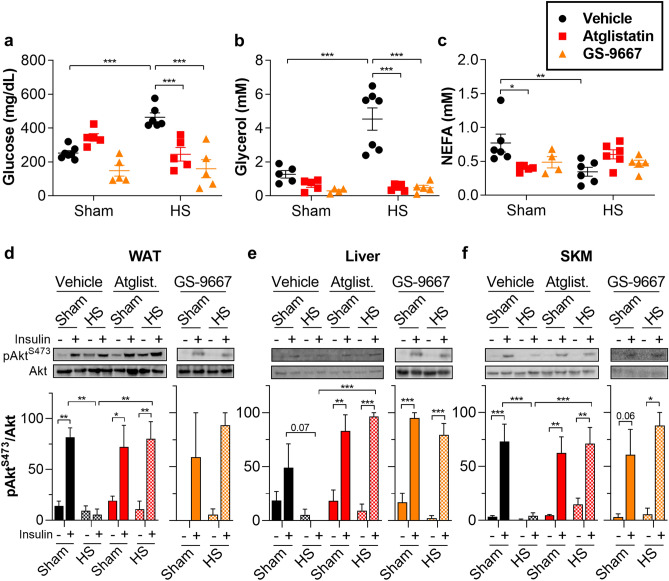
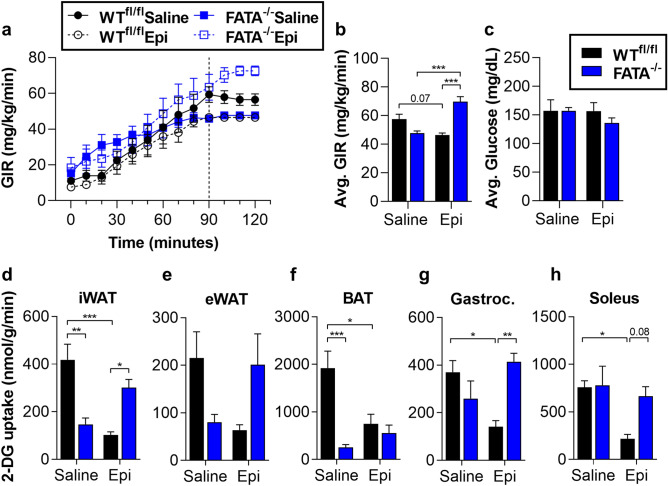
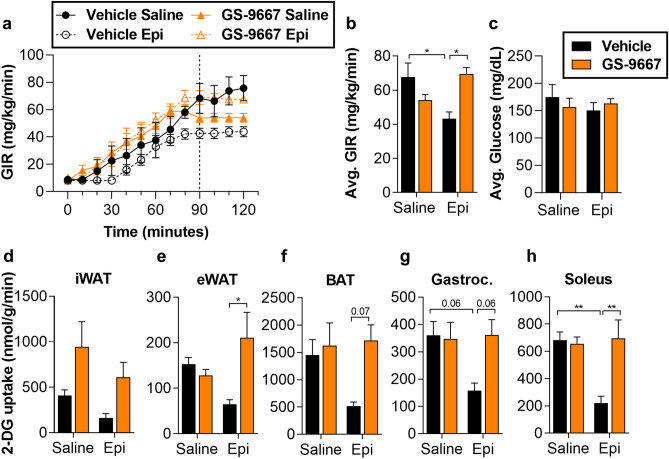
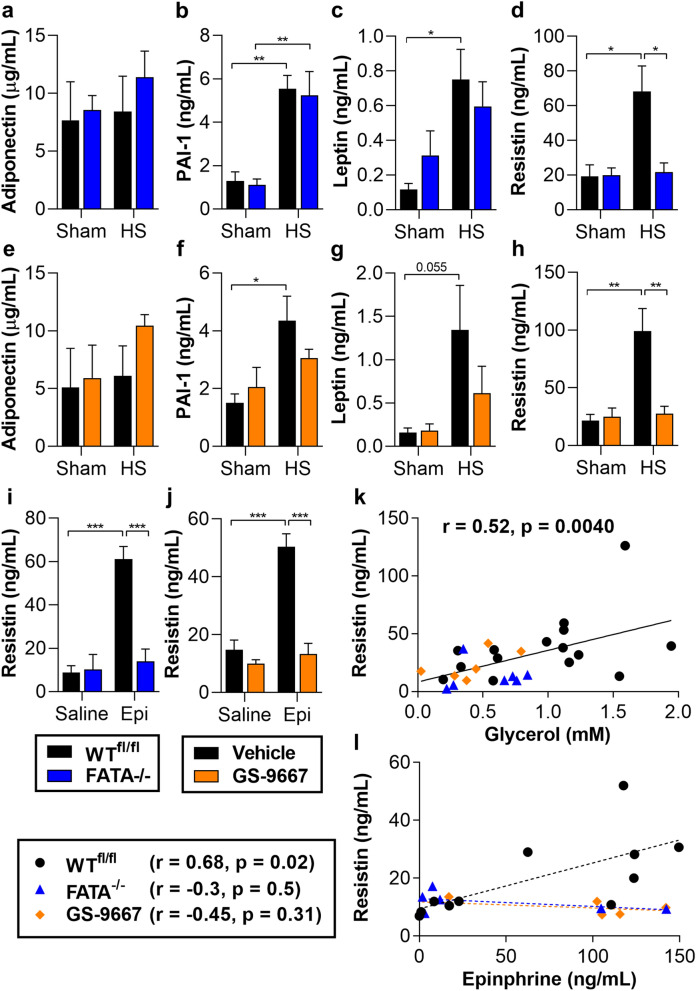
Stress hyperglycemia and insulin resistance are evolutionarily conserved metabolic adaptations to severe injury including major trauma, burns, or hemorrhagic shock (HS). In response to injury, the neuroendocrine system increases secretion of counterregulatory hormones that promote rapid mobilization of nutrient stores, impair insulin action, and ultimately cause hyperglycemia, a condition known to impair recovery from injury in the clinical setting. We investigated the contributions of adipocyte lipolysis to the metabolic response to acute stress. Both surgical injury with HS and counterregulatory hormone (epinephrine) infusion profoundly stimulated adipocyte lipolysis and simultaneously triggered insulin resistance and hyperglycemia. When lipolysis was inhibited, the stress-induced insulin resistance and hyperglycemia were largely abolished demonstrating an essential requirement for adipocyte lipolysis in promoting stress-induced insulin resistance. Interestingly, circulating non-esterified fatty acid levels did not increase with lipolysis or correlate with insulin resistance during acute stress. Instead, we show that impaired insulin sensitivity correlated with circulating levels of the adipokine resistin in a lipolysis-dependent manner. Our findings demonstrate the central importance of adipocyte lipolysis in the metabolic response to injury. This insight suggests new approaches to prevent insulin resistance and stress hyperglycemia in trauma and surgery patients and thereby improve outcomes.


Conflict of interest statement

V.R., A.K., and T.E.H. are inventors on a patent application relevant to this study filed by the University of Virginia through the UVA Licensing & Ventures Group (15/760,990). No other authors declare competing interests.

Figures

Figure 1
Figure 1
Global genetic ablation of ATGL improves insulin sensitivity during HS. (a) Glucose, (b) glycerol, and (c) NEFA levels in serum from Atgl+/+ and Atgl−/− mice fasted 4 h then subjected to sham or HS. After 30 min of sham or HS, Atgl+/+ or Atgl−/− mice were injected with saline or 0.5 U insulin in the inferior vena cava, and tissues were harvested after 4 min. Representative immunoblots and quantitation for (d) white adipose tissue (WAT, epididymal), (e) liver, and (f) skeletal muscle (SKM, gastrocnemius). N = 3–7. Data are shown as mean ± SEM. *P < 0.05, **P < 0.01, and ***P < 0.001, as indicated. For (ac), statistical analyses were performed using two-way ANOVA. For (df), image quantitations were normalized by setting largest value in each immunoblot to 100. Statistical analyses on relative values were performed using three-way ANOVA. All comparisons differing by one variable were made and adjusted for with ANOVA, and all significant comparisons are denoted as such.
Figure 2
Figure 2
Genetic ablation of adipocyte ATGL improves insulin sensitivity during HS (a) glucose, (b) glycerol, and (c) NEFA levels in serum from WTfl/fl and FATA−/− mice fasted 4 h then subjected to sham or HS. After 30 min of sham or HS, WTfl/fl or FATA−/− mice were injected with saline or 0.5 U insulin in the inferior vena cava, and tissues were harvested after 4 min. Representative immunoblots and quantitation for (d) white adipose tissue (WAT, epididymal), (e) liver, and (f) skeletal muscle (SKM, gastrocnemius). N = 3–12. Data are shown as mean ± SEM. **P < 0.01 and ***P < 0.001, as indicated. For (ac), statistical analyses were performed using two-way ANOVA. For (df), image quantitations were normalized by setting largest value in each immunoblot to 100. Statistical analyses on relative values were performed using three-way ANOVA. All comparisons differing by one variable were made and adjusted for with ANOVA, and all significant comparisons are denoted as such.
Figure 3
Figure 3
Pharmacological inhibition of lipolysis improves insulin sensitivity during HS. (a) Glucose, (b) glycerol, and (c) NEFA levels in serum from WT mice fasted 4 h; pretreated either with vehicle, 1 mg/kg Atglistatin, or 5 mg/kg GS-9667; and subjected to sham or HS. After 30 min of sham or HS, the mice were injected with saline or 0.5 U insulin in the inferior vena cava, and tissues were harvested after 4 min. Representative immunoblots and quantitation for (d) white adipose tissue (WAT, epididymal), (e) liver, and (f) skeletal muscle (SKM, gastrocnemius). N = 2–7. Data are shown as mean ± SEM. *P < 0.05, **P < 0.01, and ***P < 0.001, as indicated. For (ac), statistical analyses were performed using two-way ANOVA. For (df), image quantitations were normalized by setting largest value in each immunoblot to 100. Statistical analyses on relative values for vehicle and atglistatin were performed using three-way ANOVA. Statistical analyses of GS-9667 relative values were performed using two-way ANOVA All comparisons differing by one variable were made and adjusted for with ANOVA, and all significant comparisons are denoted as such.
Figure 4
Figure 4
Genetic deletion of adipocyte ATGL abolishes epinephrine-induced EGP and impaired glucose uptake during hyperinsulinemic–euglycemic clamps. WTfl/fl or FATA−/− mice fasted 2–4 h were infused with either saline or epinephrine (Epi, 1 µg/kg/min) and subjected to a 30 min basal period (− 30 to 0 min) followed by a hyperinsulinemic–euglycemic clamp (0–120 min). The mice then received a bolus of 2-DG, and the clamp was continued for an additional 30 min (120–150 min). (a) Glucose infusion rate during the course of the clamp. Dashed line indicates beginning of steady state (90–120 min). (b) Average glucose infusion rates (GIR) and (c) average blood glucose during steady state. 2-DG uptake in (d) inguinal white adipose tissue (iWAT), (e) epididymal white adipose tissue (eWAT), (f) brown adipose tissue (BAT), (g) gastrocnemius (Gastroc.) muscle, and (h) soleus muscle of WTfl/fl or FATA−/− mice following hyperinsulinemic–euglycemic clamp. N = 4–7. Data are shown as mean ± SEM. *P < 0.05, **P < 0.01, and ***P < 0.001, as indicated. Statistical analyses were performed using two-way ANOVA. All comparisons differing by one variable were made and adjusted for with ANOVA, and all significant comparisons are denoted as such.
Figure 5
Figure 5
Pharmacological inhibition of adipocyte lipolysis reverses epinephrine (Epi)-induced EGP and impaired glucose uptake during hyperinsulinemic–euglycemic clamps. WT mice fasted 4 h and pretreated 30 min prior with vehicle or 5 mg/kg GS-9667. Mice were infused with either saline or epinephrine (Epi, 1 µg/kg/min) and subjected to a 30 min basal period (− 30 to 0 min) followed by a hyperinsulinemic–euglycemic clamp (0–120 min). The mice then received a bolus of 2-DG, and the clamp was continued for an additional 30 min (120–150 min). (a) Glucose infusion rate during the course of the clamp. Dashed line indicates beginning of steady state (90–120 min). (b) Average glucose infusion rates (GIR) and (c) average blood glucose during steady state. 2-DG uptake in (d) inguinal white adipose tissue (iWAT), (e) epididymal white adipose tissue (eWAT), (f) brown adipose tissue (BAT), (g) gastrocnemius (Gastroc.) muscle, and (h) soleus muscle of vehicle- or GS-9667-treated mice following hyperinsulinemic–euglycemic clamp. N = 4–5. Data are shown as mean ± SEM. *P < 0.05 and **P < 0.01, as indicated. Statistical analyses were performed using two-way ANOVA. All comparisons differing by one variable were made and adjusted for with ANOVA, and all significant comparisons are denoted as such.
Figure 6
Figure 6
Resistin levels correlate with lipolysis and insulin resistance during HS. (a) Adiponectin, (b) PAI-1, (c) leptin, and (d) resistin in serum from WTfl/fl or FATA−/− mice subjected to sham or HS for 30 min. (eh) As in (ad), but in mice pretreated with vehicle or GS-9667 before HS. (i) Resistin levels in WTfl/fl and FATA−/− mice at conclusion of hyperinsulinemic–euglycemic clamp with saline or epinephrine (Epi) infusion. (j) As in (i), but from WT mice pretreated with vehicle or GS-9667 before clamp. (k) Correlation (Pearson) between circulating resistin and glycerol from mice subjected to sham or HS with and without genetic or pharmacological inhibition of lipolysis. (l) Correlation (Pearson) between circulating resistin and epinephrine from mice subjected to hyperinsulinemic–euglycemic clamp with saline or epinephrine infusion, in WT (black dotted line), FATA−/− (blue dotted line), and GS-9667-treated (orange dotted line) mice. N = 3–6. Data are shown as mean ± SEM. *P < 0.05, **P < 0.01, and ***P < 0.001, as indicated. Statistical analyses were performed using two-way ANOVA. All comparisons differing by one variable were made and adjusted for with ANOVA, and all significant comparisons are denoted as such.

References

    1. Chaudry IH, Sayeed MM, Baue AE. Insulin resistance in experimental shock. Arch. Surg. 1974;109:412–415. doi: 10.1001/archsurg.1974.01360030064017. - DOI - PubMed
    1. Li L, Messina JL. Acute insulin resistance following injury. Trends Endocrinol. Metab. 2009;20:429–435. doi: 10.1016/j.tem.2009.06.004. - DOI - PMC - PubMed
    1. Duggan EW, Carlson K, Umpierrez GE. Perioperative hyperglycemia management: An update. Anesthesiology. 2017;126:547–560. doi: 10.1097/ALN.0000000000001515. - DOI - PMC - PubMed
    1. Ljungqvist O, Jonathan E. Rhoads lecture 2011: Insulin resistance and enhanced recovery after surgery. J. Parent. Enteral Nutr. 2012;36:389–398. doi: 10.1177/0148607112445580. - DOI - PubMed
    1. Lipshutz AK, Gropper MA. Perioperative glycemic control: An evidence-based review. Anesthesiology. 2009;110:408–421. doi: 10.1097/ALN.0b013e3181948a80. - DOI - PubMed

Publication types

MeSH terms