. 2020 Oct 23;3(1):604.
doi: 10.1038/s42003-020-01318-0.

Lung gene expression signatures suggest pathogenic links and molecular markers for pulmonary tuberculosis, adenocarcinoma and sarcoidosis

Affiliations

Lung gene expression signatures suggest pathogenic links and molecular markers for pulmonary tuberculosis, adenocarcinoma and sarcoidosis

Qiyao Chai et al. Commun Biol. .

Abstract

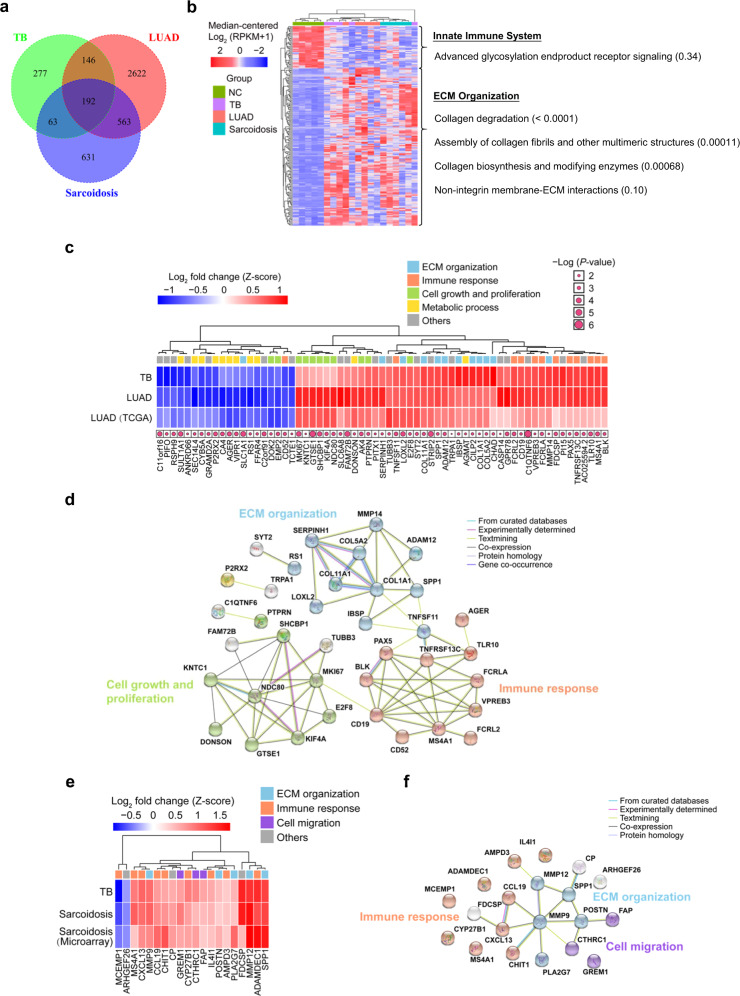
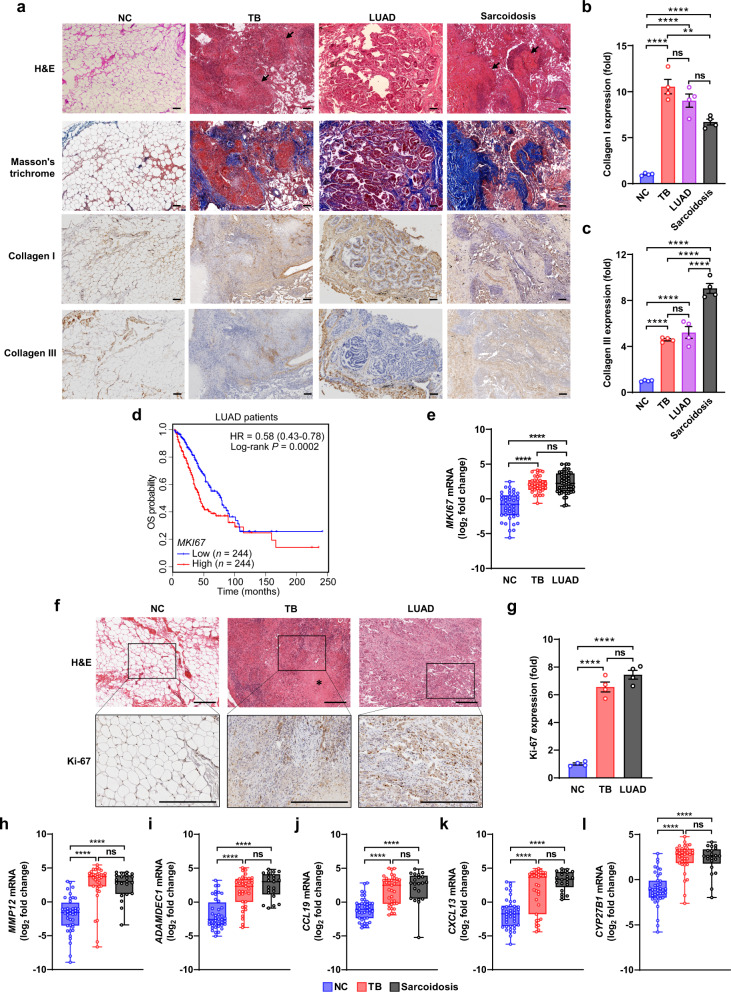
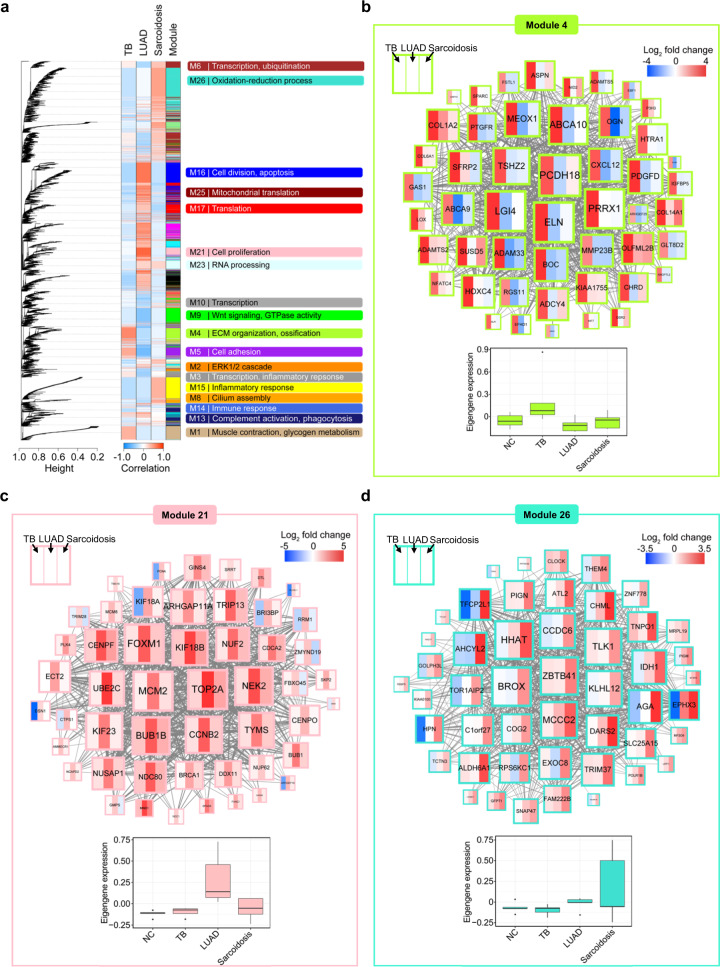
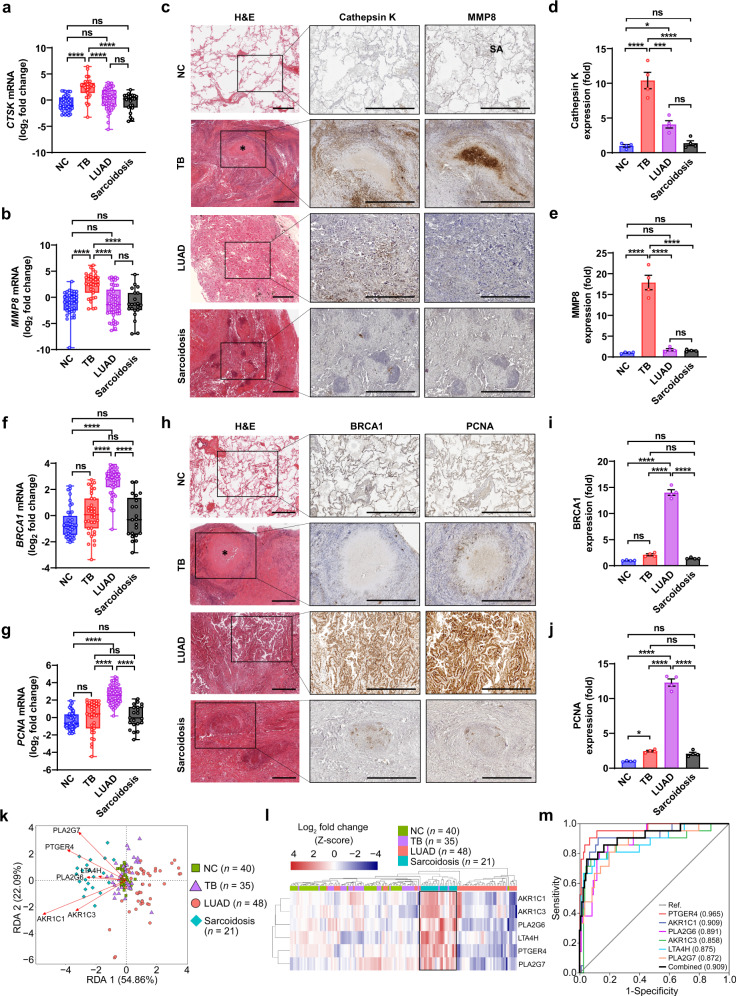
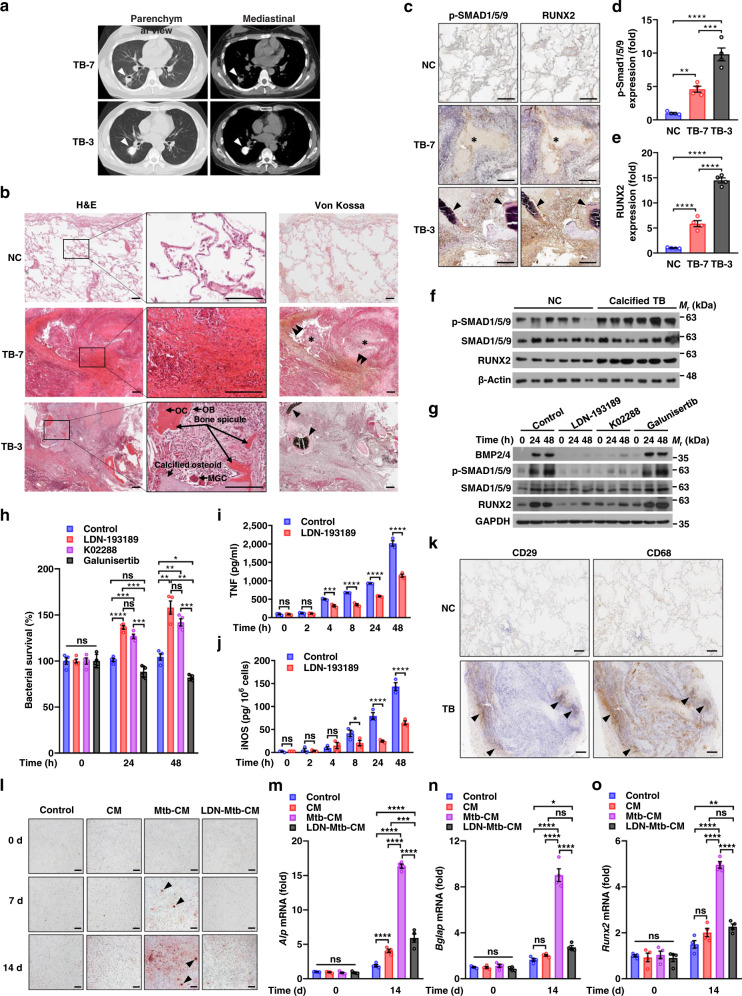
Previous reports have suggested a link between pulmonary tuberculosis (TB), which is caused by Mycobacterium tuberculosis (Mtb), and the development of lung adenocarcinoma (LUAD) and sarcoidosis. Furthermore, these lung diseases share certain clinical similarities that can challenge differential diagnosis in some cases. Here, through comparison of lung transcriptome-derived molecular signatures of TB, LUAD and sarcoidosis patients, we identify certain shared disease-related expression patterns. We also demonstrate that MKI67, an over-expressed gene shared by TB and LUAD, is a key mediator in Mtb-promoted tumor cell proliferation, migration, and invasion. Moreover, we reveal a distinct ossification-related TB lung signature, which may be associated with the activation of the BMP/SMAD/RUNX2 pathway in Mtb-infected macrophages that can restrain mycobacterial survival and promote osteogenic differentiation of mesenchymal stem cells. Taken together, these findings provide novel pathogenic links and potential molecular markers for better understanding and differential diagnosis of pulmonary TB, LUAD and sarcoidosis.


Conflict of interest statement

The authors declare no competing interests.

Figures

Fig. 1
Fig. 1. Lung molecular signatures reveal pathogenic links among TB, LUAD, and sarcoidosis.
a Venn diagram depicting the number and the overlap of differentially expressed genes of TB, LUAD, and sarcoidosis lung tissues as compared to normal control (NC) lung tissues. b Heatmap showing two dominant clusters of the 192 overlapped differentially expressed genes of TB, LUAD, and sarcoidosis lung tissues by Reactome pathway enrichment analysis. The enriched gene pathways are listed on the right, with Benjamini- Hochberg (BH)-corrected P-values in parentheses (hypergeometric test). c Heatmap depicting 65 lung-tissue transcripts that were similarly expressed in TB, LUAD, and LUAD from TCGA groups. All genes shown were significantly correlated with the overall survival (OS) of lung LUAD patient (log-rank test P < 0.05, as indicated by pink dots), according to Kaplan–Meier analysis based on TCGA data. Functional interpretations of genes are indicated by color-coded squares according to STRING functional enrichment analysis. d Interaction network analysis of genes as in c. Genes with functions related to extracellular matrix (ECM) organization, immune response, cell growth and proliferation and metabolic process as annotated in c are colored in blue, red, green, and yellow, respectively. e Heatmap depicting 20 lung-tissue transcripts that were similarly expressed in TB, sarcoidosis, and sarcoidosis from microarray data groups. Functional interpretations of genes are indicated by color-coded squares according to STRING functional enrichment analysis. f Interaction network analysis of genes as in e. Genes involved in the biological pathways associated with immune response, ECM organization, and cell migration as annotated in e are colored in red, blue, and purple, respectively.
Fig. 2
Fig. 2. TB patients share certain pathogenic mediators with LUAD and sarcoidosis patients.
a Representative images of histologic and immunohistochemical analysis of collagen fibers in NC, TB, LUAD, and sarcoidosis lung sections (n = 8, 10, 12, and 8, respectively). Fibrous matrix deposits (blue) were identified by Masson’s trichrome staining. Arrows indicate granulomatous lesions. Scale bars, 100 µm. b, c Quantitative analysis of collagen I (b) and collagen III (c) expression as in a. Four independent visual fields were examined (mean ± s.e.m. of n = 4). P > 0.05, not significant (ns); **P < 0.01; ****P < 0.0001 (one-way ANOVA). d The overall survival (OS) of lung LUAD patients from TCGA was compared between individuals with high or low levels of MKI67 mRNA transcription. Hazard ratio (HR), 95% confidence interval and log-rank P-values are shown. e Quantitative PCR analysis of MKI67 mRNA in NC, TB and LUAD groups. f Representative images of histologic and Ki-67 immunohistochemical analysis of NC, TB, and LUAD lung sections (n = 8, 10, and 12, respectively). The asterisk indicates the necrotizing focus. Scale bars, 200 µm. g Quantitative analysis of Ki-67 expression as in f. Four independent visual fields were examined (mean ± s.e.m. of n = 4). P > 0.05, not significant (ns); ****P < 0.0001 (one-way ANOVA). hl Quantitative PCR analysis of MMP12 (h), ADAMDEC1 (i), CCL19 (j), CXCL13 (k), and CYP27B1 (l) mRNAs in NC, TB, and sarcoidosis groups. For e, hl, Box-whisker plot indicates the interquartile range (box), the median value (line within the box) and the maximum and minimum value (whiskers). P > 0.05, not significant (ns); ****P < 0.0001 (n = 40, 35, 48, and 21 in NC, TB, LUAD, and sarcoidosis groups, respectively, one-way ANOVA). Results are representatives from three independent experiments.
Fig. 3
Fig. 3. Mtb promotes tumor cell proliferation, migration and invasion partially depending on MKI67.
a Representative images of EdU proliferation assays of A549 cells. Cells were transfected with NC or MKI67 siRNA for 24 h, and infected with or without Mtb for 24 h. The proliferating cells were labeled with incorporated EdU-594 (red), and nuclei were stained with Hoechst 33342 (blue). Scale bars, 50 µm. b Quantification of EdU-positive cells as in a. Five independent visual fields were examined. c, e Transwell migration (c) and invasion (e) assays of A549 cells. Cells were transfected with NC or MKI67 siRNA for 24 h and infected with or without Mtb, and were then allowed to migrate or invade for 12 h. The white arrow indicates the cell (stained with DAPI, blue) that had moved through the filter, and the yellow arrow indicates the cell that was still moving through a pore. The arrowhead indicates Mtb (stained with Alexa Fluor 488 succinimidyl ester, green). Scale bars, 50 µm. d, f Quantification of cells that had migrated (d) or invaded (f) through the filter. Four independent visual fields were examined. g Quantitative PCR analysis of MKI67 mRNA in A549 cells. Cells were infected with the indicated Mtb strains or not for 48 h. h Representative images of Ki-67 and PtpA immunohistochemical analysis of A549 cells treated as in g. Scale bars, 50 μm. i Quantitative analysis of Ki-67 expression as in h. Four independent visual fields were examined. P > 0.05, not significant (ns); *P < 0.05; **P < 0.01; ***P < 0.001; ****P < 0.0001 (mean ± s.e.m. of n = 5 in b, and n = 4 in d, f, g, and i, one-way ANOVA). All experiments were repeated at least three times independently.
Fig. 4
Fig. 4. Modular transcriptional signatures reveal pathogenic differences among TB, LAUD, and sarcoidosis.
a WGCNA cluster dendrogram based on gene expression profiles of NC, TB, LUAD, and sarcoidosis lung-tissues groups genes (n = 16,298) into distinct modules. Each leaf in the tree represents one gene, and the major branches constitute 27 modules (M1-27) labeled by different colors (column 4). The correlations of the corresponding module genes and the studied traits (TB, LUAD, and sarcoidosis) are shown (column 1–3). The modules significantly enriched for gene ontologies associated with certain biological processes (Fisher’s exact FDR ≤ 0.05) are indicated on the right. bd Gene networks depicting the top 50 highly connected module members (hub genes) for TB-correlated gene module 4 (b), LUAD- correlated gene module 21 (c) or sarcoidosis-correlated gene module 26 (d) in WGCNA. Each gene is shown as a square node with three partitions representing log2 fold-change for TB, LUAD, and sarcoidosis as compared to NC. The lines represent correlation between the gene expression profiles of the two respective genes. The box plots of eigengene expression of each module are shown below the gene network.
Fig. 5
Fig. 5. Specific pathogenic markers for distinguishing TB, LUAD and sarcoidosis patients.
a, b Quantitative PCR analysis of CTSK (a) and MMP8 (b) mRNAs in each group as indicated. c Representative images of histologic and immunohistochemical analysis (for Cathepsin K and MMP8) of NC, TB, LUAD and sarcoidosis lung sections (n = 8, 10, 12 and 8, respectively). d, e Quantitative analysis of Cathepsin K (d) and MMP8 (e) immunostaining as in c. f, g Quantitative PCR analysis of BRCA1 (f) and PCNA (g) mRNAs in each group as indicated. h Representative images of histologic and immunohistochemical analysis (for BRCA1 and PCNA) of NC, TB, LUAD and sarcoidosis lung sections (n = 8, 10, 12, and 8, respectively). i, j Quantitative analysis of BRCA1 (i) or PCNA (j) immunostaining as in h. k Redundancy analysis demonstrating the correlations of PLA2G6, PLA2G7, AKR1C1, AKR1C3, LTA4H and PTGER4 with each of the indicated groups. The direction of arrows indicates the positive correlation between gene expression level and samples, and the length of arrows indicates the intensity of the correlation. l Heatmap depicting arachidonic acid metabolism-related six-gene signatures of NC, TB, LUAD and sarcoidosis groups according to qPCR results. The box highlights the cluster of sarcoidosis samples. m Receiver operating characteristic (ROC) analysis for evaluating the diagnostic potential of the above-mentioned 6 genes for sarcoidosis. The area under the ROC curve (AUC) in parentheses represents the accuracy of the individual and combined genes for distinguishing sarcoidosis samples from the other samples. For a, b, f, and g, Box-whisker plot indicates the interquartile range (box), the median value (line within the box) and the maximum and minimum value (whiskers). P > 0.05, not significant (ns); ****P < 0.0001 (mean ± s.e.m. of n = 40, 35, 48, and 21 in NC, TB, LUAD and sarcoidosis groups, respectively, one-way ANOVA). Results are representatives of three independent experiments. For d, e, i, and j, four independent visual fields were examined for quantitative analysis. P > 0.05, not significant (ns); *P < 0.05; ***P < 0.001; ****P < 0.0001 (mean ± s.e.m. of n = 4, one-way ANOVA).
Fig. 6
Fig. 6. Macrophages control Mtb survival and promote osteogenic differentiation of MSCs via BMP/SMAD/RUNX2 pathway.
a Lung CT scan from patients TB-7 and TB-3. Arrows indicate calcific densities in pathologic lesions. b, c Representative images of histologic analysis and Von Kossa staining (b), and p-SMAD1/5/8 and RUNX2 immunohistochemical analysis (c) of NC and TB lung sections from TB patients as in a. Single arrowheads, the osteoid with mass deposits of calcium (black); double arrowheads, dispersed deposits of calcium (brown); asterisks, the necrotizing foci. OC osteocyte; OB osteoblast; MGC multinucleated giant cell. Scale bars, 200 µm. d, e Quantitative analysis of p-SMAD1/5/8 (d) and RUNX2 (e) immunostaining as in c. f Immunoblot analysis of p-SMAD1/5/9, SMAD1/5/9, RUNX2, and β-Actin in six independent NC or calcified TB lung samples. g Immunoblot analysis of BMP2/4, p-SMAD1/5/9, SMAD1/5/9, RUNX2, and GAPDH in U937 cells. Cells were treated with 500 nM LDN-193189, 1 μM K02288, 10 μM Galunisertib or control DMSO, and infected with Mtb for 0–48 h. h Survival of Mtb in U937 cells treated as in g. i, j ELISA of TNF (i) and iNOS (j) from U937 cells treated with LDN-193189 or control DMSO and infected with Mtb as in g. k Representative images of CD29 and CD68 immunohistochemical analysis of NC and TB lung sections. Arrowheads indicate the gathering of CD29+ cells (indicating MSCs) and CD68+ cells (indicating macrophages). Scale bars, 200 µm. l Representative images of Alizarin Red S staining of BMSCs. BMSCs were cultured with conditional media derived from BMDMs (CM), Mtb-infected BMDMs (Mtb-CM), LDN-193189-pretreated and Mtb-infected BMDMs (LDN-Mtb-CM) or control media for 0–14 d. Arrowheads, the mineralized nodules. Scale bars, 200 µm. mo Quantitative PCR analysis of Alp (m), Bglap (n), and Runx2 (o) mRNAs in BMSCs treated as in l. P > 0.05, not significant (ns); *P < 0.05; **P < 0.01; ***P < 0.001; ****P < 0.0001 (mean ± s.e.m. of n = 4 in d, e, h, and mo, and n = 3 in i, j, two-way ANOVA). Results are representatives from at least three independent experiments.

References

    1. World Health Organization. Global Tuberculosis Report 2019. (WHO, Geneva, 2019).
    1. Ravimohan S, Kornfeld H, Weissman D, Bisson GP. Tuberculosis and lung damage: from epidemiology to pathophysiology. Eur. Respir. Rev. 2018;27:170077. doi: 10.1183/16000617.0077-2017. - DOI - PMC - PubMed
    1. Liu CH, Liu H, Ge B. Innate immunity in tuberculosis: host defense vs pathogen evasion. Cell. Mol. Immunol. 2017;14:963–975. doi: 10.1038/cmi.2017.88. - DOI - PMC - PubMed
    1. Vento S, Lanzafame M. Tuberculosis and cancer: a complex and dangerous liaison. Lancet Oncol. 2011;12:520–522. doi: 10.1016/S1470-2045(11)70105-X. - DOI - PubMed
    1. Chai Q, Zhang Y, Liu CH. Mycobacterium tuberculosis: an adaptable pathogen associated with multiple human diseases. Front. Cell. Infect. Microbiol. 2018;8:158. doi: 10.3389/fcimb.2018.00158. - DOI - PMC - PubMed

Publication types

MeSH terms