. 2020 Nov;23(11):1352-1364.
doi: 10.1038/s41593-020-00724-1. Epub 2020 Oct 23.

Activated microglia cause metabolic disruptions in developmental cortical interneurons that persist in interneurons from individuals with schizophrenia

Affiliations

Activated microglia cause metabolic disruptions in developmental cortical interneurons that persist in interneurons from individuals with schizophrenia

Gun-Hoo Park et al. Nat Neurosci. 2020 Nov.

Abstract

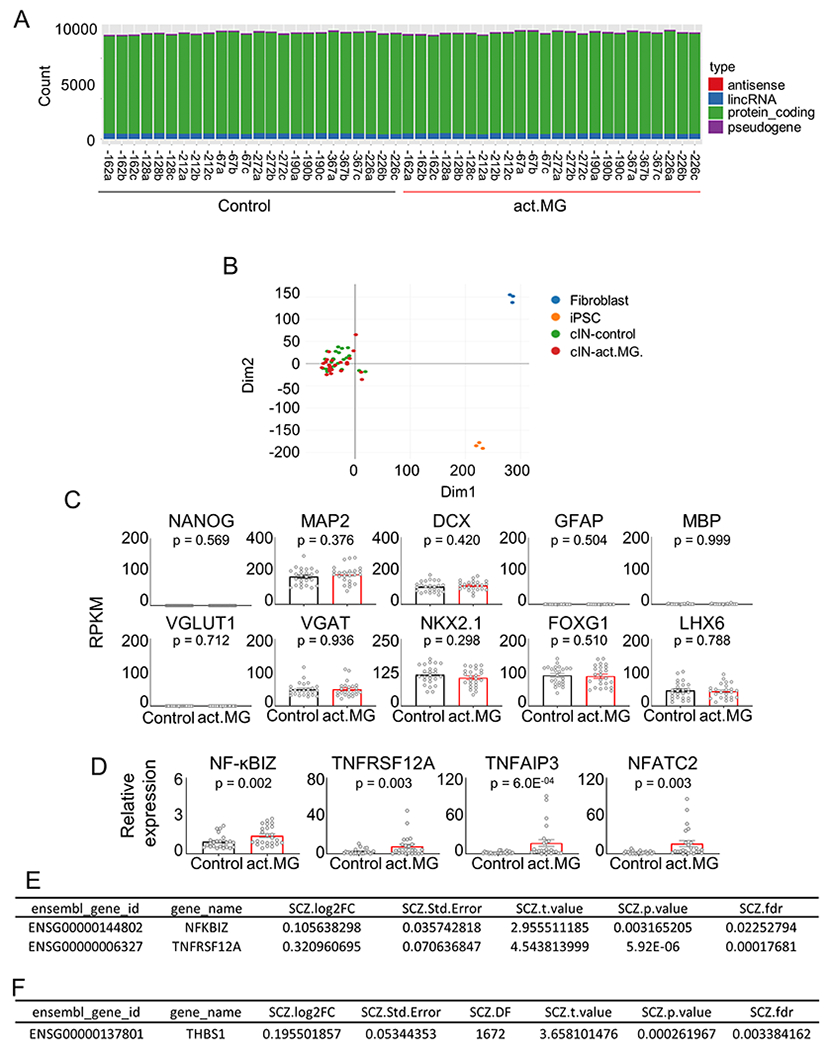
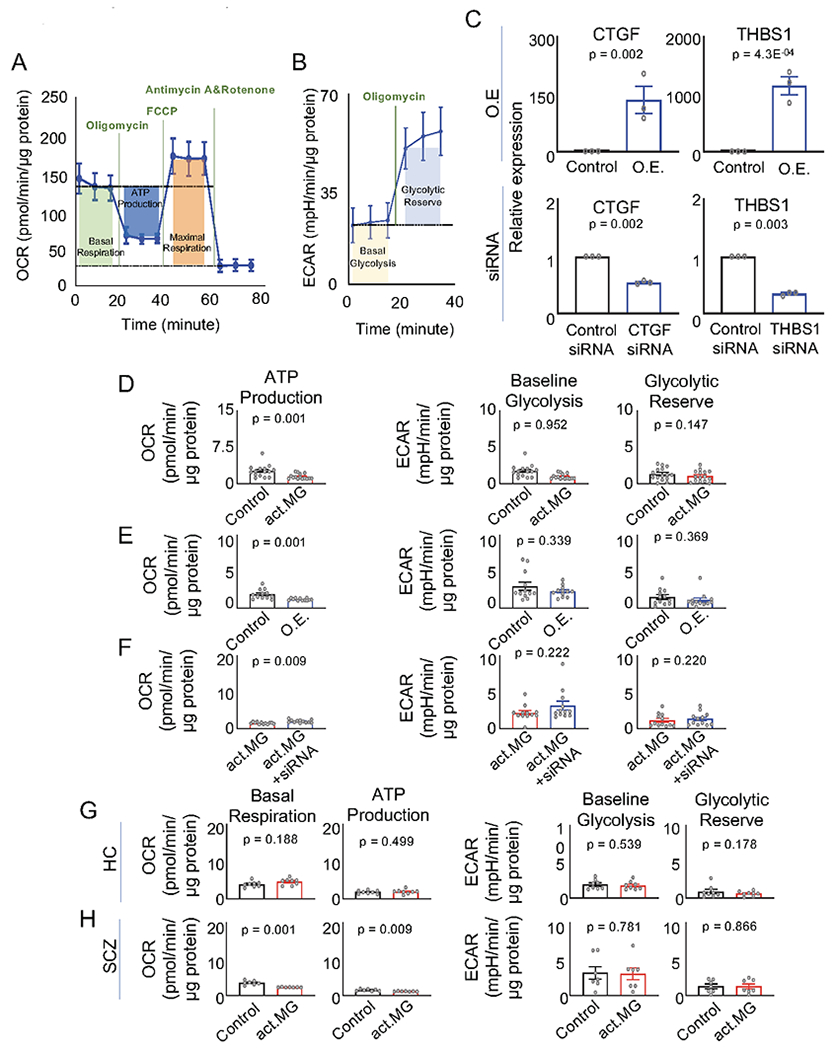
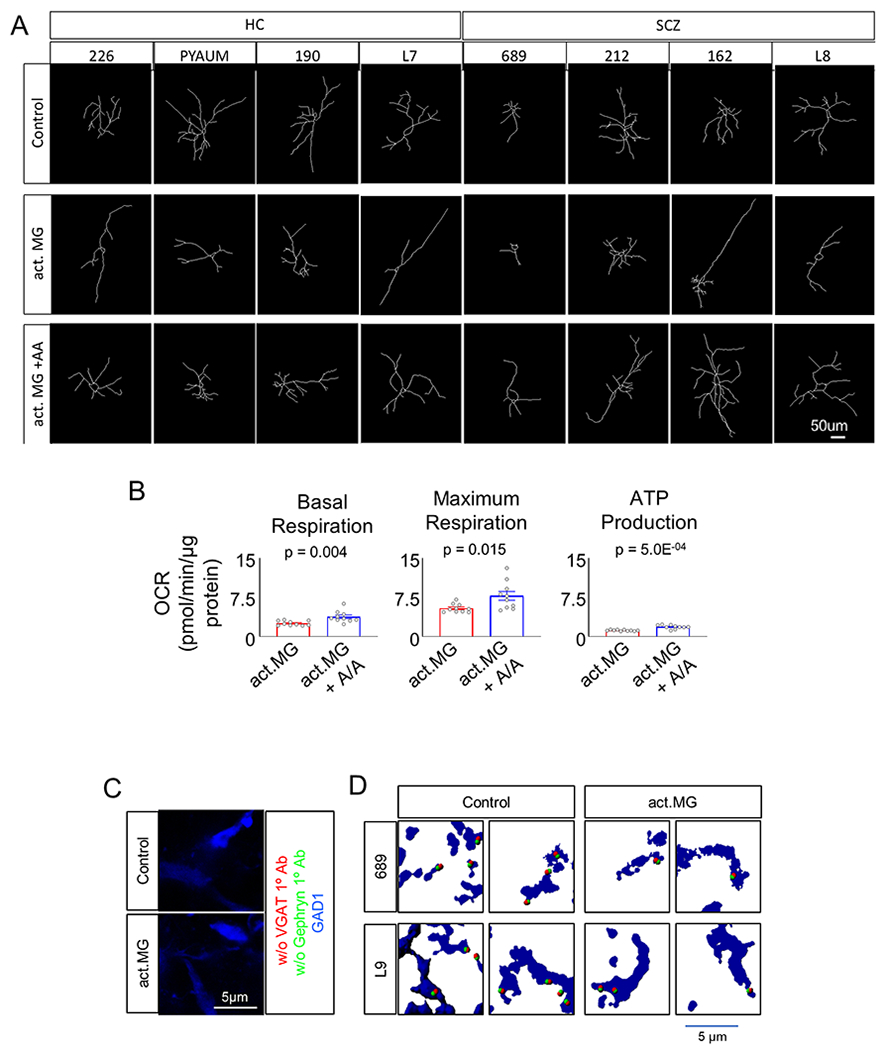
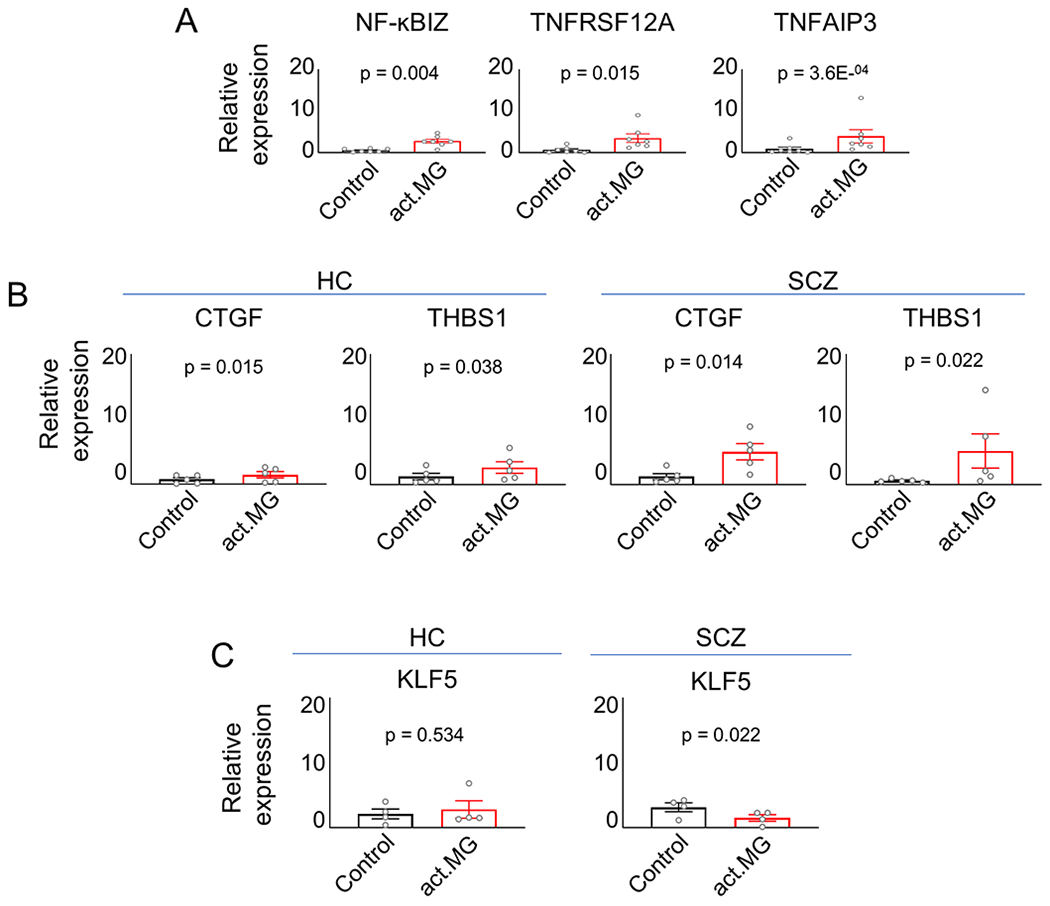
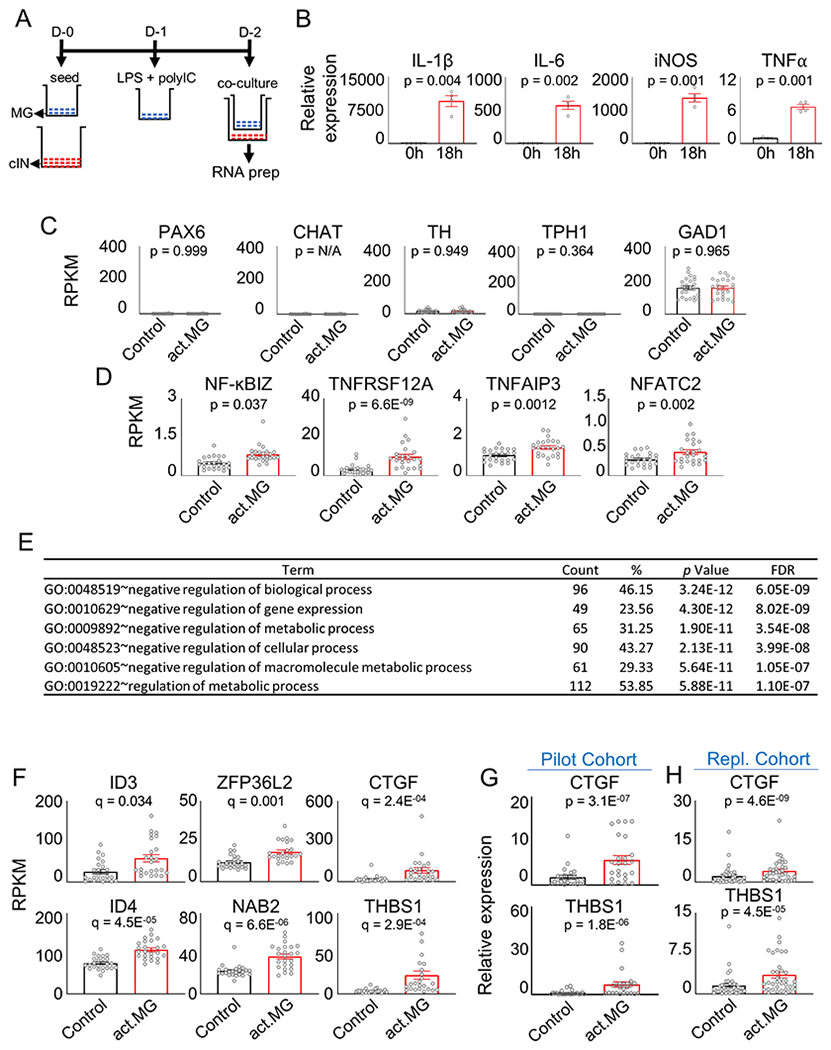
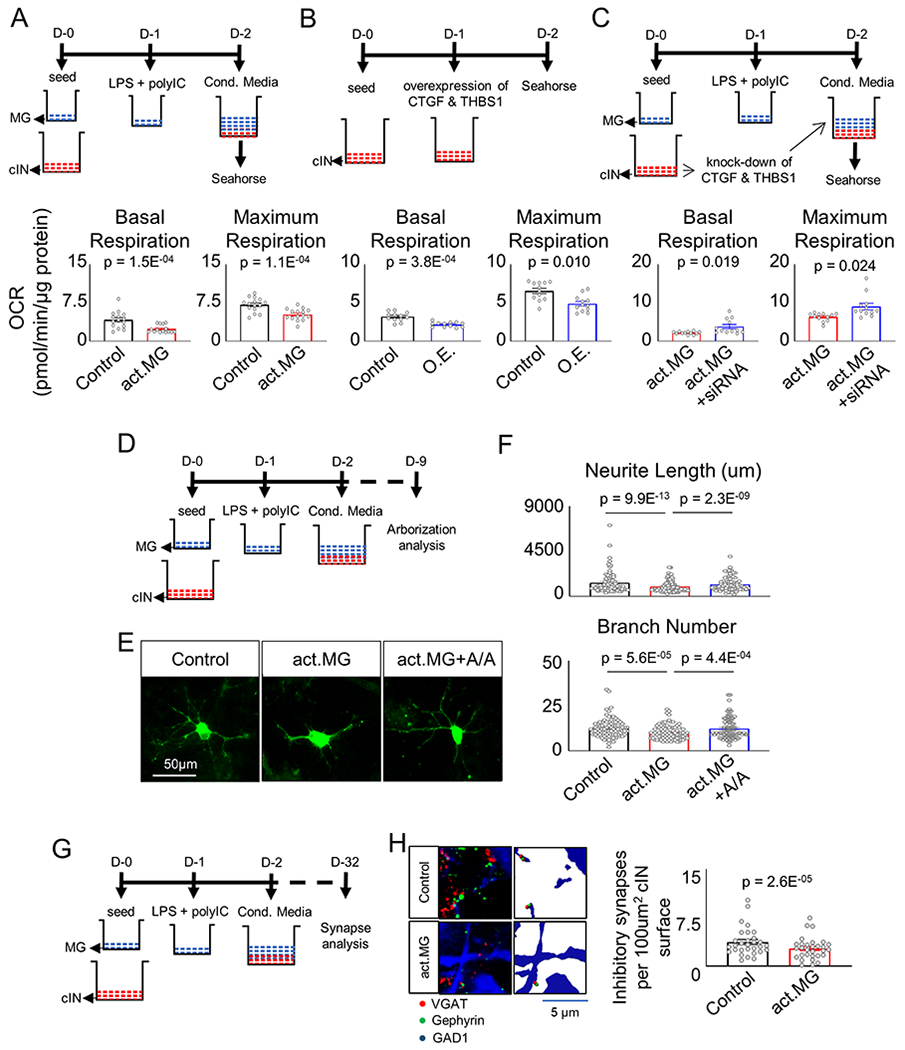
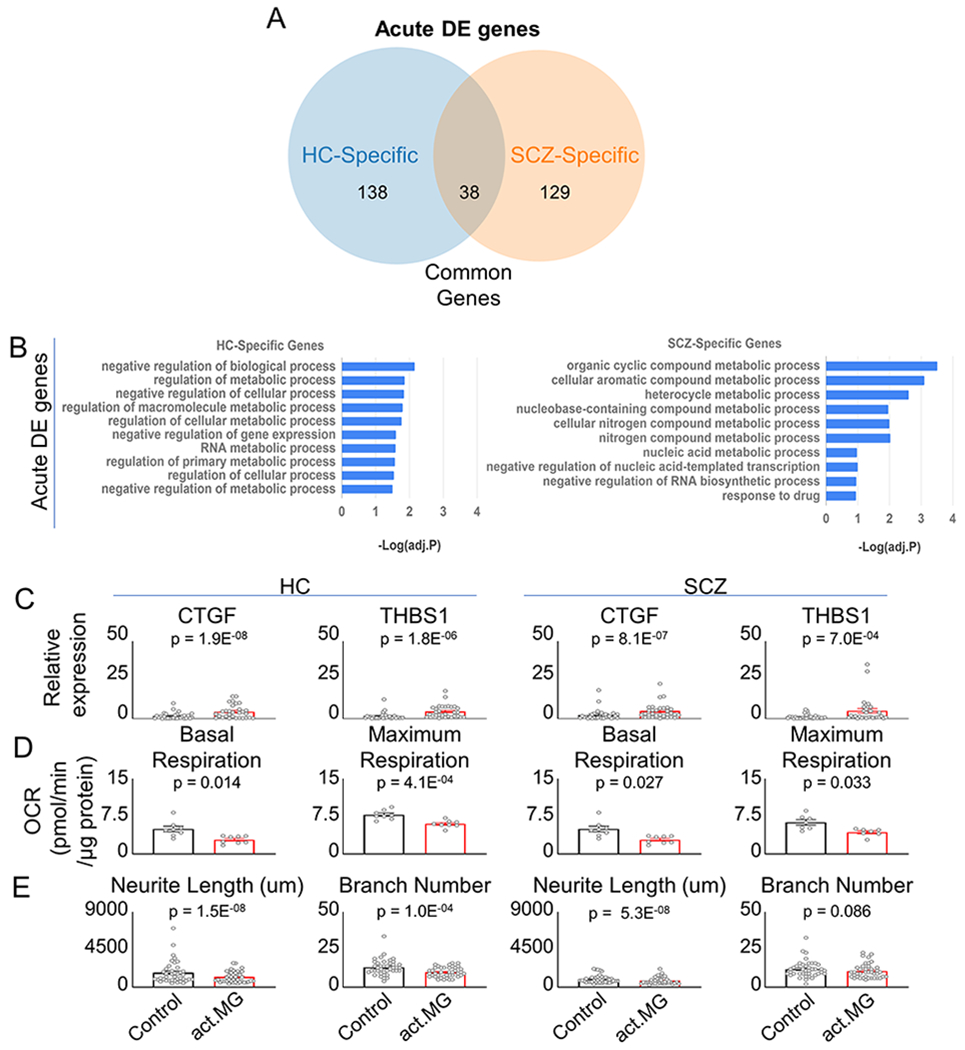
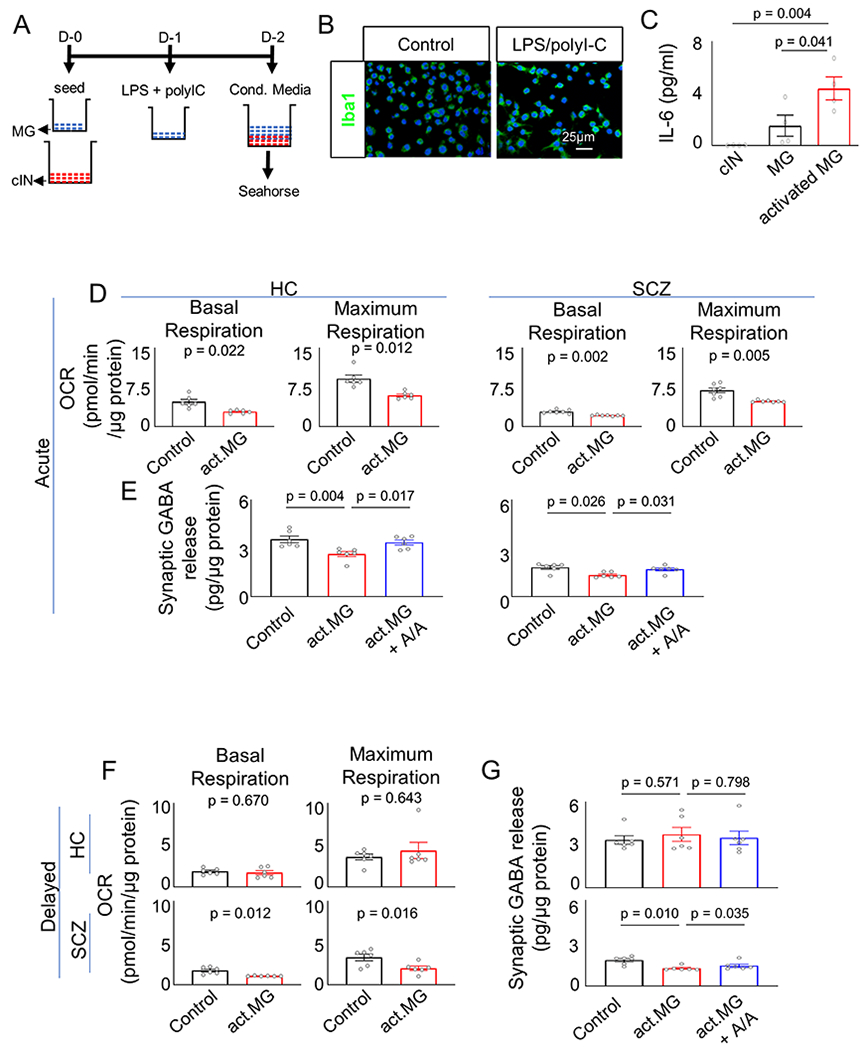
The mechanisms by which prenatal immune activation increase the risk for neuropsychiatric disorders are unclear. Here, we generated developmental cortical interneurons (cINs)-which are known to be affected in schizophrenia (SCZ) when matured-from induced pluripotent stem cells (iPSCs) derived from healthy controls (HCs) and individuals with SCZ and co-cultured them with or without activated microglia. Co-culture with activated microglia disturbed metabolic pathways, as indicated by unbiased transcriptome analyses, and impaired mitochondrial function, arborization, synapse formation and synaptic GABA release. Deficits in mitochondrial function and arborization were reversed by alpha lipoic acid and acetyl-L-carnitine treatments, which boost mitochondrial function. Notably, activated-microglia-conditioned medium altered metabolism in cINs and iPSCs from HCs but not in iPSCs from individuals with SCZ or in glutamatergic neurons. After removal of activated-microglia-conditioned medium, SCZ cINs but not HC cINs showed prolonged metabolic deficits, which suggests that there is an interaction between SCZ genetic backgrounds and environmental risk factors.


Conflict of interest statement

Disclosure of Potential Conflicts of interest

Thomas A. Lanz and Hualin S. Xi were employees of Pfizer, Inc at the time this work was performed. Joseph T. Coyle reports holding a patent on the use of D-serine to treat serious mental disorders that is owned by Massachusetts General Hospital and consulting with Concert Pharm.

Figures

Extended Data Fig. 1.
Extended Data Fig. 1.. Generation of cINs from human iPSCs.
A. Table of subjects analyzed in pilot study in Fig. 1. HC refers to healthy control subjects and SCZ refers to people with SCZ. B. Differentiation scheme of cINs from human iPSCs. SRM: serum replacement media, LDN: 100 nM LDN193189, SB: 10 μM SB431542, SAG: 0.1 μM Smoothened agonist, and IWP2: 5 μM Inhibitor of Wnt production-2. C. ELISA analysis of mouse IL1β release from activated microglia BV2. Data are presented as mean±SEM. One-way ANOVA followed by posthoc analysis using Tukey’s multiple comparisons test was used for analysis (p=0.00000489 and n=3 batches, f=173.8, df=2). D. Immunocytochemistry and cell counting analysis of differentiated cINs, demonstrating MGE-derived cIN phenotype with GAD1 and SOX6 expression. Scale bar=50 μm. Percentages of cells positive for each marker were quantified in relation to DAPI-stained total nuclei. For GAD1, Sample sizes (n) as the number of independent differentiations for each line are as follows; 272:4, 190:5, 367:5, 226:4, 67:4, 128:5, 212:4, and 162:5. For SOX6, sample sizes (n) as the number of independent differentiations for each line are as follows; 272:4, 190:4, 367:4, 226:3, 67:4, 128:5, 212:4, and 162:5. At least 500 cells were counted for each line. Data are presented as mean ±SEM. E. Immunocytochemistry and cell counting analysis of OLIG2+, GFAP+, CHAT+, TH+, 5-HT+ and VIP+ cells. Scale bar= 25 or 50 μm. Proportions of OLIG2+ neurons (p=0.782, two-sided chi-square test), GFAP+ neurons (Non-detectable for both HC and SCZ), CHAT+ neurons (Non-detectable for both HC and SCZ), TH+ neurons (p=0.700, two-sided chi-square test), 5-HT+ neurons (p=0.911, two-sided chi-square test) and VIP+ neurons (non-detectable for both HC and SCZ) between groups. Analysis was repeated at least three times with comparable results.
Extended Data Fig. 2.
Extended Data Fig. 2.. RNA-seq analysis of cINs co-cultured with activated microglia.
A. Total identified gene numbers in RNA-seq in Fig. 1. B. PCA analysis of RNA-seq analysis in Fig. 1 (from 4 HC lines and 4 SCZ lines with 3 independent differentiations from each line as shown in Extended Data 2A). C. Various phenotype marker expression in cINs with or without co-culture with activated microglia, analyzed by RNA-seq. Gene expression is shown as RPKM, obtained from STAR-featureCount. Differentially expressed genes were analyzed by Kallisto-Sleuth (Wald test for two-sided significance testing, n=24 batches from 4 HC lines and 4 SCZ lines, each line with 3 independent differentiations). Error bars are SEM. D. qPCR analysis of inflammatory response gene expression in cINs with or without activated microglia co-culture. Data were normalized by GAPDH expression and are presented as mean±SEM. Two-Level Hierarchical Linear Mixed Effect Model after log-transformation was used for analysis (n=24 batches from 4 HC lines and 4 SCZ lines, each line with 3 independent differentiations). E. Differential expression of inflammatory response genes in HC vs SCZ postmortem PFC from Wang et al F. Differential expression of THBS1 in HC vs SCZ postmortem PFC from Wang et al.
Extended Data Fig. 3.
Extended Data Fig. 3.. Co-culture with activated microglia results in dysregulated metabolic gene pathways in developmental cINs.
A. Expression of CTGF in HC cINs and SCZ cINs with or without co-culture with activated microglia, analyzed by qPCR analysis. Paired data from the same line are connected by a solid line. B. Expression of THBS1 in HC cINs and SCZ cINs with or without co-culture with activated microglia, analyzed by qPCR analysis. Paired data from the same line are connected by a solid line. C. Expression of KLF5 in HC cINs and SCZ cINs with or without co-culture with activated microglia in the pilot cohort, analyzed by qPCR analysis. Paired data from the same line are connected by a solid line. D. Expression of KLF5 in HC cINs and SCZ cINs with or without co-culture with activated microglia in the replication cohort, analyzed by qPCR analysis. Paired data from the same line are connected by a solid line.
Extended Data Fig. 4.
Extended Data Fig. 4.. Generation of cINs from human replication cohort iPSCs.
A. Table of subjects analyzed as a replication cohort. HC refers to healthy control subjects and SCZ refers to people with SCZ. B. Immunocytochemistry and cell counting analysis of generated cINs for expression of GAD1 and SOX6, analyzed after 8 weeks’ differentiation. Scale bar= 50 μm. Percentages of cells positive for each marker were quantified in relation to DAPI-stained total nuclei. For GAD1, Sample sizes (n) as the number of independent differentiations for each line are as follows; PYAUM:4, 317:3, L9:3, L7:4, L5:4, 292:3, 689:4, 285:4, 282:4, 58:4, L10:3, and L8:3. For SOX6, sample sizes (n) as the number of independent differentiations for each line are as follows; PYAUM:5 317:3, L9:3, L7:4, L5:3, 292:3, 689:4, 285:4, 282:4, 58:3, L10:3, and L8:3. At least 500 cells were counted for each line. Data are presented as mean ±SEM. C. qPCR analysis of replication cohort cINs with or without activated microglia co-culture. Data were normalized by GAPDH expression and are presented as mean±SEM. Two-Level Hierarchical Linear Mixed Effect Model after log-transformation was used for analysis (n=30 batches from 5 HC lines and 5 SCZ lines, each line with 3 independent differentiations).
Extended Data Fig. 5.
Extended Data Fig. 5.. Metabolic analysis of cINs cultured in activated microglia-conditioned media.
A. Schematic diagram of Seahorse analysis OCR data. Basal Respiration=baseline OCR-Rotenone/antimycin A OCR, ATP production=Baseline OCR-Oligomycin OCR and Maximum Respiration=FCCP OCR-Rotenone/antimycin A OCR. B. Schematic diagram of Seahorse analysis of ECAR data. Glycolytic Reserve= Oligomycin ECAR- Baseline ECAR. C. Overexpression and siRNA knock down of CTGF and THBS1, probed by qPCR analysis. Data were normalized by GAPDH expression and are presented as mean±SEM. Two-tailed Ratio paired t-test was used for analysis (n=3 batches, O.E. of CTGF: t=19.35, df=2, O.E. of THBS1: t=47.92, df=2, siRNA of CTGF: t=18.89, df=2, siRNA of THBS1: t=17.86, df=2). D. Analysis of oxidative phosphorylation (ATP Production) and glycolysis (Baseline Glycolysis and Glycolytic Reserve) of cINs cultured with or without activated microglia-conditioned media using a Seahorse Analyzer. Data are presented as mean±SEM. Two-tailed paired t-test after log transformation was used for analysis of ATP Production and Baseline Glycolysis and Two-tailed paired t-test was used for analysis of Glycolytic Reserve (n=15 lines, ATP Production: t=3.978, df=14, Baseline Glycolysis: t=0.06106, df=14, Glycolytic Reserve: t=1.534, df=14). E. Analysis of oxidative phosphorylation (ATP Production) and glycolysis (Baseline Glycolysis and Glycolytic Reserve) with or without overexpression of CTGF and THBS1 using a Seahorse Analyzer. Data are presented as mean±SEM. Two-tailed paired t-test was used for analysis of ATP Production and Two-tailed paired t-test after log transformation was used for analysis of Baseline Glycolysis and Glycolytic Reserve (n=12 lines, ATP Production: t=4.186, df=11, Baseline Glycolysis: t=0.9984, df=11, Glycolytic Reserve: t=0.9361, df=11). F. Analysis of oxidative phosphorylation (ATP Production) and glycolysis (Baseline Glycolysis and Glycolytic Reserve) with or without siRNA-mediated knockdown of CTGF and THBS1 using a Seahorse Analyzer. Data are presented as mean±SEM. Two-tailed paired t-test was used for analysis of ATP Production and Two-tailed paired t-test after log transformation was used for analysis of Baseline Glycolysis and Glycolytic Reserve (n=12 lines, ATP Production: t=3.164, df=11, Baseline Glycolysis: t=1.293, df=11, Glycolytic Reserve: t=1.300, df=11). G. Analysis of oxidative phosphorylation (Basal Respiration and ATP Production) and glycolysis (Baseline Glycolysis and Glycolytic Reserve) in HC cINs using a Seahorse Analyzer one week after removal of activated microglia-conditioned media. Data are presented as mean±SEM. Two-tailed paired t-test was used for analysis of Basal Respiration, ATP Production and Baseline Glycolysis. Two-tailed paired t-test after log transformation was used for analysis of Glycolytic Reserve (n=8 lines; Each data point is averaged from 1-4 independent differentiations, Basal Respiration: t=8.404, df=2, ATP Production: t=0.7116, df=7, Baseline Glycolysis: t=0.6444, df=7, Glycolytic Reserve: t=1.495, df=7). H. Analysis of oxidative phosphorylation (Basal respiration and ATP production) and glycolysis (Baseline glycolysis and glycolysis reserve) in SCZ cINs using a Seahorse Analyzer one week after removal of activated microglia-conditioned media. Data are presented as mean±SEM. Two-tailed paired t-test was used for analysis (n=7 lines, Each data point is averaged from 1-2 independent differentiations, Basal Respiration: t=5.622, df=6, ATP Production: t=3.750, df=6, Baseline Glycolysis: t=0.2902, df=6, Glycolytic Reserve: t=0.1759, df=6).
Extended Data Fig. 6.
Extended Data Fig. 6.. Functional analysis of cINs with activated microglia-conditioned media.
A. Tracing of cINs without activated microglia-conditioned media, with activated microglia-conditioned media or with activated microglia-conditioned media + ALA/ALC treatment. Scale bar= 50 μm. Analysis was repeated at least three times with comparable results. B. Analysis of mitochondrial function using a Seahorse Analyzer in cINs cultured in activated microglia-conditioned media with or without ALA/ALC treatment. Data are presented as mean±SEM. Two-tailed paired t-test was used for analysis (n=10 lines, Basal Respiration: t=3.741, df=9, Maximum Respiration: t=2.987, df=9 ATP Production: t=5.281, df=9). C. Negative control for synapse staining in the absence of primary antibodies for synaptic puncta detection. Scale bar= 5 μm. Analysis was repeated at least three times with comparable results. D. Synapse analysis of cIN organoids with or without treatment with activated microglia conditioned media. Scale bar= 5 μm. Analysis was repeated at least three times with comparable results.
Extended Data Fig. 7.
Extended Data Fig. 7.. Gene expression analysis and functional analysis of HC and SCZ cINs with or without activated microglia co-culture.
A. qPCR analysis of CTGF and THBS1 expression in HC cINs vs. SCZ cINs with or without activated microglia co-culture. Data were normalized by GAPDH expression and are presented as mean±SEM. Two-tailed Unpaired t-test after log transformation was used for analysis of CTGF and THBS1 for control conditions. Two-tailed Unpaired t-test was used for analysis of CTGF and THBS1 for those with activated microglia co-culture (n=10 lines for HC and n=10 lines for SCZ, Each data point is averaged from 3 independent differentiations, CTGF of Control: t=0.7972, df=18, THBS1 of Control: t=0.7871, df=18, CTGF of Act.MG: t=0.3137, df=8, THBS1 of Act.MG: t=0.1880, df=18). B. Analysis of oxidative phosphorylation in HC cINs vs. SCZ cINs cultured with or without activated microglia-conditioned media. Data are presented as mean±SEM. Two-tailed Unpaired t-test was used for analysis of Basal Respiration and Maximum Respiration for control conditions. Two-tailed Unpaired t-test after log transformation was used for analysis of Basal Respiration for those cultured in activated microglia-conditioned media. Two-tailed Unpaired t-test was used for analysis of Maximum Respiration for those cultured in activated microglia-conditioned media (n=7 lines for HC and n=7 lines for SCZ, Basal Respiration of Control: t=2.428, df=12, Maximum Respiration of Control: t=2.517, df=12, Basal Respiration of Act.MG: t=5.424, df=12, Maximum Respiration of Act.MG: t=4.262, df=12). C. qPCR analysis of KLF5 expression in HC cINs vs. SCZ cINs with or without co-culture with activated microglia one week after the removal of activated microglia co-culture. Data were normalized by GAPDH expression and are presented as mean±SEM. Two-tailed Unpaired t-test was used for analysis of KLF5 qPCR for control conditions and Two-tailed Unpaired t-test after log transformation was used for analysis of KLF5 qPCR for those with activated microglia co-culture (n=10 lines for HC and n=10 lines for SCZ; Each data point is averaged from 3 independent differentiations, Control: t=0.1021, df=18, Act.MG: t=1.435, df=18). D. Analysis of oxidative phosphorylation in HC cINs vs. SCZ cINs cultured with or without activated microglia-conditioned media one week after removal of activated microglia-conditioned media. Data are presented as mean±SEM. Two-tailed Unpaired t-test after log transformation was used for analysis of Maximum Respiration for control conditions and Two-tailed Unpaired t-test was used for analysis of Maximum Respiration for those cultured in activated microglia-conditioned media (n=7 lines for HC and n=7 lines for SCZ; Each data point is averaged from 1-4 independent differentiations, Maximum Respiration of Control: t=4.646, df=12, Maximum Respiration of Act.MG: t=3.256, df=12). E. Arborization analysis of cINs infected with a limiting titer of GFP-expressing lentivirus and cultured without activated microglia-conditioned media, with activated microglia-conditioned media or with activated microglia-conditioned media + ALA/ALC treatment. Data are presented as mean ± SEM. One-way ANOVA, followed by posthoc analysis using Dunnett’s multiple comparisons test was used for analysis (n=8 lines consisting of 4 HC lines and 4 SCZ lines, Neurite Length: f=6.116, df=2, Branch Number: f=6.465, df=2).
Extended Data Fig. 8.
Extended Data Fig. 8.. Gene expression analysis of cINs cultured with or without activated HMC3-conditioned media.
A. qPCR analysis of inflammatory gene expression in cINs with and without culturing in activated microglia HMC3-conditioned media. Data were normalized by GAPDH expression and are presented as mean±SEM. Two-tailed paired t-test was used for analysis of NF-κBIZ and TNFRSF12A and Two-tailed paired t-test after log transformation was used for analysis of TNFAIP3 (n=7 lines, Each data point is averaged from 3 independent differentiations, NF-κBIZ: t=4.406, df=6, TNFRSF12A: t=3.351, df=6, TNFAIP3: t=7.189, df=6). B. qPCR analysis of CTGF and THBS1 expression in HC cINs or SCZ cINs cultured with or without activated microglia HMC3-conditioned media. Data were normalized by GAPDH expression and are presented as mean±SEM. Two-tailed Ratio paired t-test was used for analysis (n=5 lines for HC and n=5 lines for SCZ; Each data point is averaged from 3 independent differentiations, CTGF of HC: t=4.018, df=4, THBS1 of HC: t=3.027, df=4, CTGF of SCZ: t=4.131, df=4, THBS1 of SCZ: t=3.638, df=4). C. qPCR analysis of KLF5 expression in HC cINs or SCZ cINs cultured with or without activated microglia HMC3-conditioned media one week after the removal of activated microglia conditioned media. Data were normalized by GAPDH expression and are presented as mean±SEM. Two-tailed paired t-test after log transformation was used for analysis of HC KLF5 qPCR and Two-tailed paired t-test was used for analysis of SCZ KLF5 qPCR (n=4 lines from HC and n=4 lines from SCZ; Each data point is averaged from 3 independent differentiations, HC: t=0.6992, df=3, SCZ: t=4.364, df=3).
Extended Data Fig. 9.
Extended Data Fig. 9.. Metabolic analysis of cINs with or without activated HMC3-conditioned media.
A. Analysis of oxidative phosphorylation (ATP Production) and glycolysis (Baseline Glycolysis and Glycolytic Reserve) in HC cINs cultured with or without activated microglia HMC3-conditioned media using a Seahorse Analyzer. Data are presented as mean±SEM. Two-tailed paired t-test was used for analysis (n=6 lines, ATP Production: t=3.028, df=5, Baseline Glycolysis: t=2.064, df=5, Glycolytic Reserve: t=0.02005, df=5). B. Analysis of oxidative phosphorylation (ATP Production) and glycolysis (Baseline Glycolysis and Glycolytic Reserve) in SCZ cINs cultured with or without activated microglia HMC3-conditioned media using a Seahorse Analyzer. Data are presented as mean±SEM. Two-tailed paired t-test was used for analysis (n=7 lines, ATP Production: t=4.421, df=6, Baseline Glycolysis: t=0.8454, df=6, Glycolytic Reserve: t=0.8159, df=6). C. Analysis of oxidative phosphorylation (ATP Production) and glycolysis (Baseline Glycolysis and Glycolytic Reserve) in HC cINs using a Seahorse Analyzer one week after removal of activated microglia HMC3-conditioned media. Data are presented as mean±SEM. Two-tailed paired t-test was used for analysis of ATP Production and Baseline Glycolysis and Two-tailed paired t-test after log transformation was used for analysis of Glycolytic Reserve (n=6 lines; Each data point is averaged from 1-4 independent differentiations, ATP Production: t=0.05286, df=5, Baseline Glycolysis: t=1.294, df=5, Glycolytic Reserve: t=0.1876, df=5). D. Analysis of oxidative phosphorylation (ATP Production) and glycolysis (Baseline Glycolysis and Glycolytic Reserve) in SCZ cINs using a Seahorse Analyzer one week after removal of activated microglia HMC3-conditioned media. Data are presented as mean±SEM. Two-tailed paired t-test was used for analysis (n=7 lines; Each data point is averaged from 1-2 independent differentiations, ATP Production: t=4.051, df=6, Baseline Glycolysis: t=2.008, df=6, Glycolytic Reserve: t=0.7266, df=6). E. Analysis of oxidative phosphorylation in HC cINs vs. SCZ cINs cultured with or without activated microglia HMC3-conditioned media. Data are presented as mean±SEM. Two-tailed Unpaired t-test was used for analysis (n=6 lines, Basal Respiration of Control: t=3.743, df=10, Maximum Respiration of Control: t=2.646, df=10, Basal Respiration of Act.MG: t=5.004, df=10, Maximum Respiration of Act.MG: t=3.842, df=10). F. Analysis of oxidative phosphorylation in HC cINs vs. SCZ cINs culture with or without activated microglia HMC3-conditioned media one week after removal of the activated microglia-conditioned media. Data are presented as mean±SEM. Two-tailed Unpaired t-test was used for analysis of both Basal Respiration and Maximum Respiration for control conditions. Two-tailed Unpaired t-test after log transformation was used for analysis of Basal Respiration for those cultured in activated microglia HMC3-conditioned media. Two-tailed Unpaired t-test was used for analysis of Maximum Respiration for those cultured in activated microglia HMC3-conditioned media (n=6 lines; Each data point is averaged from 1-4 independent differentiations, Basal Respiration of Control: t=2.295, df=10, Maximum Respiration of Control: t=2.409, df=10, Basal Respiration of Act.MG: t=4.066, df=10, Maximum Respiration of Act.MG: t=7.071, df=10). G. Analysis of action potential firing-dependent synaptic GABA release in HC cINs vs. SCZ cINs cultured with or without activated microglia HMC3-conditioned media. Data are presented as mean±SEM. Two-tailed Unpaired t-test was used for analysis (n=6 lines; Each data point is averaged from 1-3 independent differentiations, Control: t=4.038, df=10, Act.MG: t=5.253, df=10). H. Analysis of action potential firing-dependent synaptic GABA release in HC cINs vs. SCZ cINs cultured with or without activated microglia HMC3-conditioned media one week after removal of activated microglia-conditioned media. Data are presented as mean±SEM. Two-tailed Unpaired t-test after log transformation was used for control conditions and Two-tailed Unpaired t-test was used for those cultured in activated microglia HMC3-conditioned media (n=6 lines; Each data point is averaged from 1-3 independent differentiations, Control: t=2.379, df=10, Act.MG: t=3923, df=10).
Extended Data Fig. 10.
Extended Data Fig. 10.. Metabolic analysis of developmental glutamatergic neurons cultured in activated microglia-conditioned media.
A. Analysis of oxidative phosphorylation (ATP Production) and glycolysis (Baseline Glycolysis and Glycolytic Reserve) in HC glutamatergic neurons using a Seahorse Analyzer. Data are presented as mean±SEM. Two-Level Hierarchical Linear Mixed Effect Model was used for analysis (n=4 independent differentiations from 2 lines, each line with 2 independent differentiations). B. Analysis of oxidative phosphorylation (ATP Production) and glycolysis (Baseline Glycolysis and Glycolytic Reserve) in SCZ glutamatergic neurons using a Seahorse Analyzer. Data are presented as mean±SEM. Two-Level Hierarchical Linear Mixed Effect Model after log transformation was used for analysis of ATP Production and Glycolytic Reserve and Two-Level Hierarchical Linear Mixed Effect Model was used for analysis of Baseline Glycolysis (n=4 independent differentiations from 2 lines, each line with 2 independent differentiations). C. Analysis of oxidative phosphorylation in HC glutamatergic neurons vs. SCZ glutamatergic neurons cultured with or without activated microglia HMC3-conditioned media. Data are presented as mean±SEM. One-Level Hierarchical Linear Mixed Effect Model was used for analysis (n=4 independent differentiations from 2 lines, each line with 2 independent differentiations).
Fig. 1.
Fig. 1.. Co-culture with activated microglia induces metabolic gene dysregulation in developmental cINs.
A. Scheme for coculturing developmental cINs with activated microglia. Microglial cells were activated in the tissue culture insert and co-cultured with cINs via insert without direct contact. B. qPCR analysis of inflammatory gene expression before and after activating microglial cells. Data were normalized by GAPDH expression and are presented as mean±SEM. Two-tailed paired t-test was used for analysis (n=4 batches of independent activation and harvest, IL-1β: t=7.770, df=3, IL-6: t=9.542, df=3, iNOS: t=11.07, df=3, TNF α: t=12.05, df=3). C. Various phenotype marker expression in cINs with or without co-culture with activated microglia, analyzed by RNA-seq. Gene expression is shown as RPKM (Reads Per Kilobase of transcript), obtained from STAR-featureCount. Differentially expressed genes were analyzed by Kallisto-Sleuth (Wald test for two-sided significance testing, n=24 batches from 4 HC lines and 4 SCZ lines, each line with 3 independent differentiations). Error bars are SEM. D. Inflammatory response gene expression in cINs with or without activated microglia co-culture, analyzed by RNA-seq. Gene expression is shown as RPKM, obtained from STAR-featureCount. Differentially expressed genes were analyzed by Kallisto-Sleuth (Wald test for two-sided significance testing, n=24 batches from 4 HC lines and 4 SCZ lines, each line with 3 independent differentiations). Error bars are SEM. E. Pathway analysis of enriched genes with differential expression using DAVID (https://david.ncifcrf.gov/summary.jsp). Significant enrichment was tested by the Fisher’s Exact Test. FDR: false discovery rate with Benjamini-Hochberg multiple testing. F. RNA-seq analysis of cINs with or without activated microglia co-culture. Gene expression is shown as RPKM, obtained from STAR-featureCount. Differentially expressed genes were analyzed by Kallisto-Sleuth (Wald test for two-sided significance testing, n=24 batches from 4 HC lines and 4 SCZ lines, each line with 3 independent differentiations). Error bars are SEM. G. qPCR analysis of CTGF and THBS1 expression in cINs with or without activated microglia co-culture. Data were normalized by GAPDH expression and are presented as mean±SEM. Two-Level Hierarchical Linear Mixed Effect Model after log-transformation was used for analysis (n=24 batches from 4 HC lines and 4 SCZ lines, each line with 3 independent differentiations). H. qPCR analysis of replication cohort cINs with or without activated microglia co-culture. Data were normalized by GAPDH expression and are presented as mean±SEM. Two-Level Hierarchical Linear Mixed Effect Model after log-transformation was used for analysis (n=36 batches from 6 HC lines and 6 SCZ lines, each line with 3 independent differentiations). The lines used in these experiments are summarized in Supplementary Table 10 and Extended Data. 1A.
Fig. 2.
Fig. 2.. Co-culture with activated microglia results in compromised metabolism in developmental cINs.
A. Analysis of mitochondrial function using a Seahorse Analyzer, showing significant decreases in mitochondrial function in cINs cultured in activated microglia-conditioned media. Data are presented as mean±SEM. Two-tailed paired t-test after log transformation was used for analysis of Basal Respiration and Two-tailed paired t-test was used for analysis of Maximum Respiration (n=15 lines, Basal Respiration: t=5.129, df=14, Maximum Respiration: t=5.295, df=14). B. Analysis of mitochondrial function of cINs with overexpression of CTGF and THBS1 using Seahorse Analyzer. Data are presented as mean±SEM. Two-tailed paired t-test was used for analysis (n=12 lines, Basal Respiration: t=5.030, df=11, Maximum Respiration: t=3.076, df=11). C. Analysis of mitochondrial function of cINs cultured in activated microglia-conditioned media with CTGF and THBS1 knock down using Seahorse Analyzer. Data are presented as mean±SEM. Two-tailed paired t-test after log transformation was used for analysis (n=12 lines, Basal Respiration: t=2.721, df=11, Maximum Respiration: t=2.612, df=11). D. Scheme of arborization analysis of cINs infected with a limiting titer of GFP-expressing lentivirus cultured with or without activated microglia-conditioned media. E. Representative images of arborization analysis of cINs cultured without activated microglia-conditioned media, with activated microglia-conditioned media or with activated microglia-conditioned media + ALA/ALC treatment. Scale bar= 50 μm. Analysis was repeated at least three times with comparable results. F. Arborization analysis of cINs without activated microglia-conditioned media, with activated microglia-conditioned media or with activated microglia-conditioned media + ALA/ALC treatment. Images were analyzed using ImageJ with the Neuron J plugin. Center and error bars show mean ± SEM. Data were collected from 4 HC lines and 4 SCZ lines, each line with 10 neurons (n=80 neurons). Two-Level Hierarchical Linear Mixed Effect Model after log-transformation was used for analysis of neurite length and Two-Level Hierarchical Mixed Effect Log-Linear Model was used for analysis of branch number, followed by Dunnett’s test as a post hoc analysis. (n=80 neurons from 4 HC lines and 4 SCZ lines, each line with 10 neurons). G. Scheme of cIN organoid synapse analysis with or without activated microglia-conditioned media. H. Analyses of inhibitory synapses in cIN organoids with or without treatment with activated microglia-conditioned media using Imaris software. The data are presented as the number of inhibitory synapses (juxtaposed GFP+VGAT+ puncta and Gephyrin+ puncta) per 100 μm2 of GAD1+ cINs. Scale bar= 5 μm. Data are presented as mean ±SEM (n = 30 116 μm x 116 μm images per group). Two-Level Hierarchical Linear Mixed Effect Model after log-transformation was used for analysis. The lines used in these experiments are summarized in Supplementary Table 10.
Fig. 3.
Fig. 3.. Both HC cINs and SCZ cINs show metabolic dysfunction with activated microglia co-culture.
A. Venn diagram of acute phase DE genes with or without activated microglia co-culture in HC cINs and SCZ cINs. B. Pathway analysis of acute phase DE genes with or without activated microglia co-culture in HC cINs and SCZ cINs using DAVID (https://david.ncifcrf.gov/summary.jsp). Significant enrichment was tested by the Fisher’s Exact Test. C. qPCR analysis of CTGF and THBS1 expression with or without activated microglia coculture in HC cINs or SCZ cINs. Data were normalized by GAPDH expression and are presented as mean±SEM. Two-Level Hierarchical Linear Mixed Effect Model after log-transformation was used for analysis (n=30 batches from 10 lines, each line with 3 independent differentiations). D. Analysis of oxidative phosphorylation using a Seahorse Analyzer, showing significant decreases in mitochondrial function in cINs cultured in activated microglia-conditioned media both in HC cINs and SCZ cINs. Data are presented as mean±SEM. Two-tailed paired t-test was used for analysis (n=8 lines for HC and n=7 lines for SCZ, Basal Respiration of HC: t=3.248, df=7, Maximum Respiration of HC: t=6.266, df=7, Basal Respiration of SCZ: t=2.884, df=6, Maximum Respiration of SCZ: t=2.744, df=6). E. Arborization analysis of HC cINs or SCZ cINs infected with a limiting titer of GFP-expressing lentivirus and cultured with or without activated microglia-conditioned media. Images were analyzed using ImageJ with the Neuron J plugin. Center and error bars show mean ± SEM. Two-Level Hierarchical Linear Mixed Effect Model after log-transformation was used for analysis of Neurite Length and Two-Level Hierarchical Mixed Effect Log-Linear Model was used for analysis of Branch Number (n=40 neurons for 4 HC lines and n=40 neurons for 4 SCZ lines, each line with 10 neurons). The lines used in these experiments are summarized in Supplementary Table 10.
Fig. 4.
Fig. 4.. Neither HC nor SCZ cINs show metabolic dysfunction under IL17 treatment.
A. Scheme for treating cINs with IL17. B. RNA-seq analysis of cINs with or without IL17 treatment. Gene expression is shown as TPM, obtained from Kallisto. Differentially expressed genes were analyzed by DESeq2 (Wald test for two-sided significance testing, n=8 independent differentiations from 4 HC lines and 4 SCZ lines). Error bars are SEM. C. Venn diagram of DE genes with or without IL17 treatment in HC cINs and SCZ cINs. D. Pathway analysis of DE genes with or without IL17 treatment in HC cINs and SCZ cINs using DAVID (https://david.ncifcrf.gov/summary.jsp). Significant enrichment was tested by the Fisher’s Exact Test. E. Venn diagram of DE genes for activated microglia co-culture vs. IL17 treatment in HC cINs. F. Venn diagram of DE genes for activated microglia co-culture vs. IL17 treatment in SCZ cINs. The lines used in these experiments are summarized in Supplementary Table 10.
Fig. 5.
Fig. 5.. SCZ cINs but not HC cINs show metabolic dysfunction even after removal of activated microglia co-culture.
A. Scheme for cell treatment to analyze prolonged effects even after removal of co-cultured activated microglia. B. Venn diagram of DE genes with or without activated microglia co-culture in HC cINs and SCZ cINs one week after the removal of activated microglia co-culture. C. Pathway analysis of DE genes with or without activated microglia co-culture in HC cINs and SCZ cINs one week after the removal of activated microglia co-culture using DAVID (https://david.ncifcrf.gov/summary.jsp). Significant enrichment was tested by the Fisher’s Exact Test. D. Venn diagram of DE genes of acute phase vs. one week after removal of activated microglia co-culture in HC cINs. E. Venn diagram of DE genes of acute phase vs. one week after removal of activated microglia co-culture in SCZ cINs. F. RNA-seq analysis of cINs with or without activated microglia co-culture one week after removal of activated microglia co-culture. Gene expression is shown as TPM (Transcripts Per Million), obtained from Kallisto. Differentially expressed genes were analyzed by DESeq2 (Wald test for two-sided significance testing, n=8 independent differentiations from 4 HC lines and 4 SCZ lines). Error bars are SEM. G. qPCR analysis of KLF5 expression in cINs with or without activated microglia co-culture one week after the removal of activated microglia co-culture. Data were normalized by GAPDH expression and are presented as mean±SEM. Two-tailed paired t-test after log transformation was used for analysis (n=4 lines for HC and n=4 lines for SCZ; Each data point is averaged from 3 independent differentiations, HC: t=0.8405, df=3, SCZ: t=3.550, df=3). H. qPCR analysis of KLF5 expression in replication cohort of cINs with or without activated microglia co-culture one week after the removal of activated microglia co-culture. Data were normalized by GAPDH expression and are presented as mean±SEM. Two-tailed paired t-test was used for analysis (n=6 lines for HC and n=6 lines for SCZ; Each data point is averaged from 3 independent differentiations, HC: t=0.4805, df=5, SCZ: t=3.999, df=5). I. Analysis of oxidative phosphorylation using a Seahorse Analyzer, showing significant decreases in mitochondrial function in SCZ cINs (lower panel) but not in HC cINs (upper panel) one week after removal of the activated microglia-conditioned media. Data are presented as mean±SEM. Two-tailed paired t-test was used for analysis (n=8 lines for HC and n=7 lines for SCZ; Each data point is averaged from 1-4 independent differentiations, Maximum Respiration of HC: t=0.1277, df=7, Maximum Respiration of SCZ: t=4.428, df=6). The lines used in these experiments are summarized in Supplementary Table 10.
Fig. 6.
Fig. 6.. cINs treated with activated HMC3-conditioned media show metabolic dysfunction.
A. Scheme for culturing developmental cINs with activated microglia-conditioned media. B. Immunocytochemistry analysis of HMC3 microglia with or without activation with LPS and polyI-C. Scale bar= 25 μm. Analysis was repeated at least three times with comparable results. C. ELISA analysis of human IL-6 release from activated microglia HMC3. Data are presented as mean±SEM. One-way ANOVA followed by posthoc analysis using Tukey’s multiple comparisons test was used for analysis (p=0.0048 and n=4 independent experiments, f=10.22, df=2). D. Analysis of oxidative phosphorylation using a Seahorse Analyzer, showing significant decreases in mitochondrial function with activated microglia-conditioned media both in HC cINs and SCZ cINs. Data are presented as mean±SEM. Two-tailed paired t-test was used for analysis (n=6 lines for HC and n=7 lines for SCZ, Basal Respiration of HC: t=3.271, df=5, Maximum Respiration of HC: t=3.830, df=5, Basal Respiration of SCZ: t=5.116, df=6, Maximum Respiration of SCZ: t=4.301, df=6). E. Action potential firing-dependent synaptic GABA release analysis of HC cINs or SCZ cINs cultured without activated HMC3 microglia-conditioned media, with activated microglia-conditioned media or with activated microglia-conditioned media + ALA/ALC treatment. Center and error bars show mean ± SEM. One-way ANOVA, followed by posthoc analysis using Dunnett’s multiple comparisons test (n=6 lines for HC and n=6 lines for SCZ; Each data point is averaged from 1-3 independent differentiations, HC: f=9.228, df=2, SCZ: f=6.138, df=2). F. Analysis of oxidative phosphorylation using a Seahorse Analyzer, showing significant decreases in mitochondrial function in SCZ cINs but not in HC cINs one week after removal of activated HMC3 microglia-conditioned media. Data are presented as mean±SEM. Two-tailed paired t-test was used for analysis of HC Basal Respiration and Two-tailed paired t-test after log transformation was used for analysis of HC Maximum Respiration. Two-tailed paired t-test was used for analysis of SCZ Basal Respiration and SCZ Maximum Respiration (n=6 lines for HC and n=6 lines for SCZ, Each data point is averaged from 1-4 independent differentiations, Basal Respiration of HC: t=0.4513, df=5, Maximum Respiration of HC: t=0.4917, df=5, Basal Respiration of SCZ: t=3.784, df=5, Maximum Respiration of SCZ: t=3.566, df=5). G. Analysis of Action potential firing-dependent synaptic GABA release analysis of HC cINs or SCZ cINs cultured without activated HMC3 microglia-conditioned media, with activated microglia-conditioned media or with activated microglia-conditioned media + ALA/ALC treatment. Data are presented as mean±SEM. One-way ANOVA, followed by posthoc analysis using Dunnett’s multiple comparisons test (n=6 lines for HC and n=6 lines for SCZ; Each data point is averaged from 1-3 independent differentiations, HC: f=0.6048, df=2, SCZ: f=12.82, df=2). The lines used in these experiments are summarized in Supplementary Table 10.
Fig. 7.
Fig. 7.. Neither developmental glutamatergic neurons nor SCZ iPSCs cultured in activated microglia-conditioned media show metabolic dysfunction.
A. Scheme for generating developmental glutamatergic neurons. B. Immunocytochemistry analysis of differentiated glutamatergic neurons from HC vs SCZ iPSCs. Scale bar= 25 μm. Analysis was repeated at least three times with comparable results. C. qPCR analysis of CTGF and THBS1 expression with or without activated HMC3 microglia-conditioned media in HC glutamatergic neurons or SCZ glutamatergic neurons. Data were normalized by GAPDH expression and are presented as mean±SEM. Two-Level Hierarchical Linear Mixed Effect Model after log-transformation was used for analysis of HC CTGF and THBS1 and Two-Level Hierarchical Linear Mixed Effect Model was used for analysis of SCZ CTGF and THBS1 (n=4 batches from 2 lines, each line with 2 independent differentiations). D. Analysis of oxidative phosphorylation using a Seahorse Analyzer, showing no changes in mitochondrial function either in HC glutamatergic neurons or SCZ glutamatergic neurons cultured in activated HMC3 microglia-conditioned media. Data are presented as mean±SEM. Two-Level Hierarchical Linear Mixed Effect Model after log transformation was used for analysis of HC Basal Respiration and Two-Level Hierarchical Linear Mixed Effect Model was used for analysis of HC Maximum Respiration, SCZ Basal Respiration and SCZ Maximum Respiration (n=4 batches from 2 lines, each line with 2 independent differentiations). E. Analysis of oxidative phosphorylation in iPSCs using a Seahorse Analyzer. Data are presented as mean±SEM. Two-tailed paired t-test was used for analysis (n=3 batches from 1 line for HC and n=3 batches from 1 line for SCZ, Basal Respiration of HC: t=8.404, df=2, Maximum Respiration of HC: t=28.98, df=2, Basal Respiration of SCZ: t=3.960, df=2, Maximum Respiration of SCZ: t=4.190, df=2). The lines used in these experiments are summarized in Supplementary Table 10.

References

    1. Knuesel I et al. Maternal immune activation and abnormal brain development across CNS disorders. Nature reviews. Neurology 10, 643–660, doi:10.1038/nrneurol.2014.187 (2014). - DOI - PubMed
    1. Estes ML & McAllister AK Immune mediators in the brain and peripheral tissues in autism spectrum disorder. Nat Rev Neurosci 16, 469–486, doi:10.1038/nrn3978 (2015). - DOI - PMC - PubMed
    1. Hantsoo L, Kornfield S, Anguera MC & Epperson CN Inflammation: A Proposed Intermediary Between Maternal Stress and Offspring Neuropsychiatric Risk. Biol Psychiatry 85, 97–106, doi:10.1016/j.biopsych.2018.08.018 (2019). - DOI - PMC - PubMed
    1. Estes ML & McAllister AK Maternal immune activation: Implications for neuropsychiatric disorders. Science 353, 772–777, doi:papers3://publication/doi/10.1126/science.aag3194 (2016). - PMC - PubMed
    1. Mallard C, Welin AK, Peebles D, Hagberg H & Kjellmer I White matter injury following systemic endotoxemia or asphyxia in the fetal sheep. Neurochemical research 28, 215–223 (2003). - PubMed

Online Methods References

    1. Bray NL, Pimentel H, Melsted P & Pachter L Near-optimal probabilistic RNA-seq quantification. Nat Biotechnol 34, 525–527, doi:10.1038/nbt.3519 (2016). - DOI - PubMed
    1. Hong S et al. Functional analysis of various promoters in lentiviral vectors at different stages of in vitro differentiation of mouse embryonic stem cells. Mol Ther 15, 1630–1639, doi:10.1038/sj.mt.6300251 (2007). - DOI - PMC - PubMed
    1. Herring AH Applied Longitudinal Analysis, 2nd Edition, by Fitzmaurice Garrett M., Laird Nan M., and Ware James H., John Wiley & Sons, 2011. Journal of Biopharmaceutical Statistics 23, 940–941, doi:10.1080/10543406.2013.789817 (2013). - DOI
    1. Laird NM & Ware JH Random-effects models for longitudinal data. Biometrics 38, 963–974 (1982). - PubMed
    1. Jensen KP et al. Alcohol-responsive genes identified in human iPSC-derived neural cultures. Transl Psychiatry 9, 96, doi:10.1038/s41398-019-0426-5 (2019). - DOI - PMC - PubMed

Publication types