Review
. 2020 Nov;19(11):940-950.
doi: 10.1016/S1474-4422(20)30346-X.

PET imaging of neuroinflammation in neurological disorders

Affiliations
Review

PET imaging of neuroinflammation in neurological disorders

William C Kreisl et al. Lancet Neurol. 2020 Nov.

Abstract

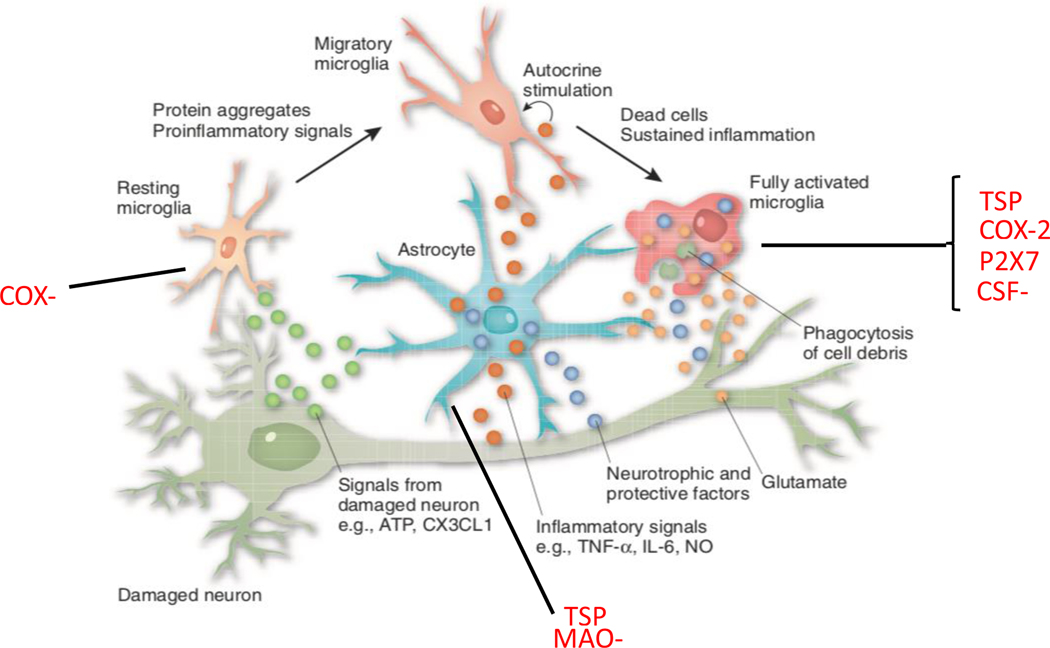
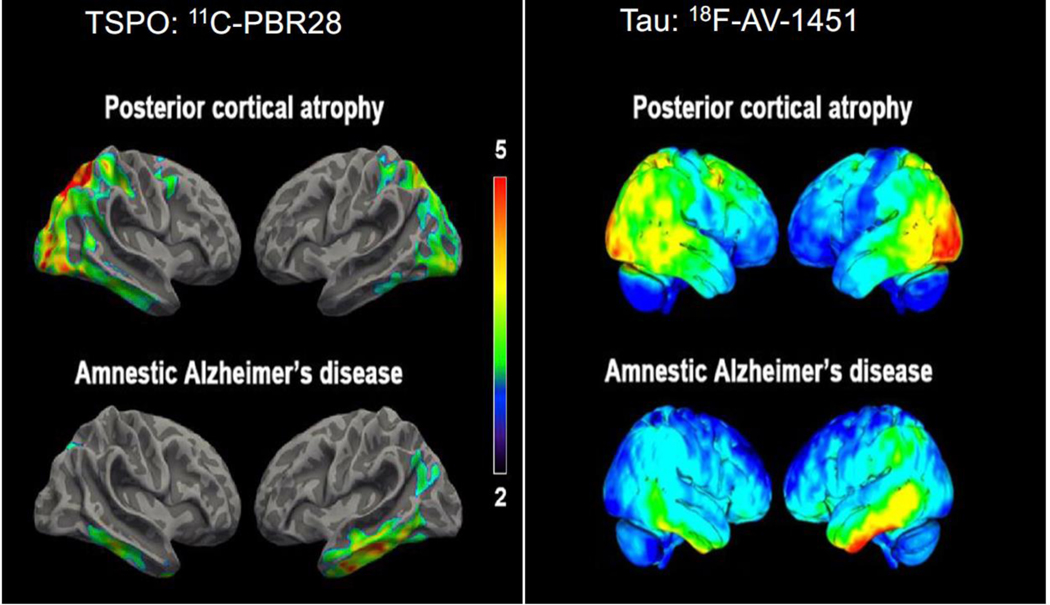
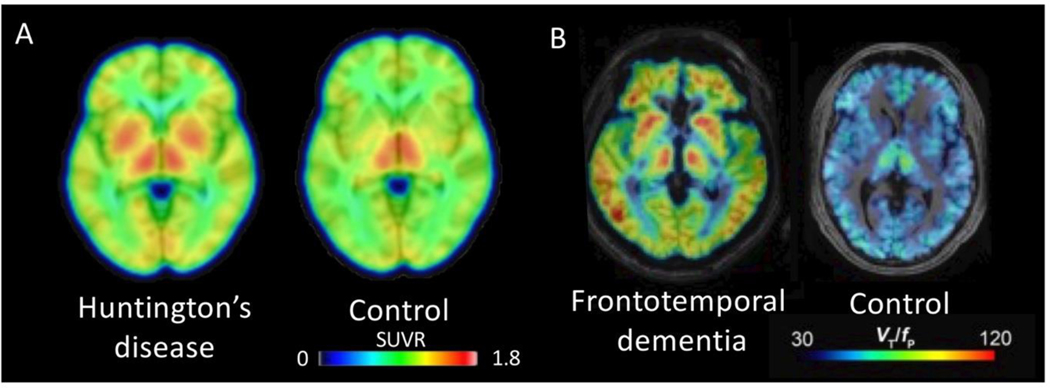
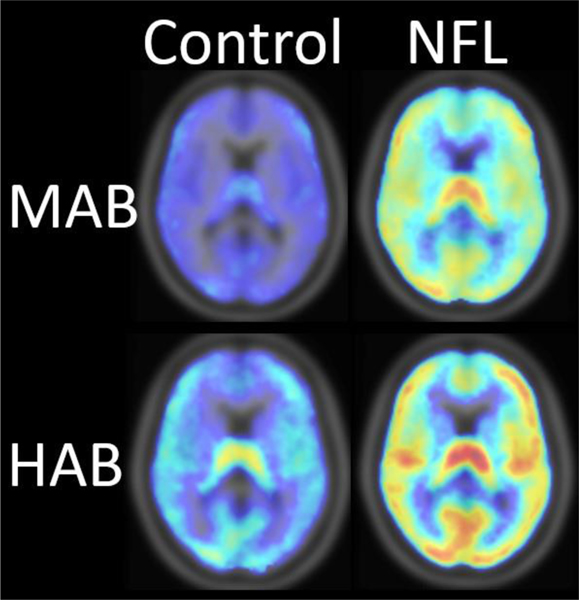
A growing need exists for reliable in-vivo measurement of neuroinflammation to better characterise the inflammatory processes underlying various diseases and to inform the development of novel therapeutics that target deleterious glial activity. PET is well suited to quantify neuroinflammation and has the potential to discriminate components of the neuroimmune response. However, there are several obstacles to the reliable quantification of neuroinflammation by PET imaging. Despite these challenges, PET studies have consistently identified associations between neuroimmune responses and pathophysiology in brain disorders such as Alzheimer's disease. Tissue studies have also begun to clarify the meaning of changes in PET signal in some diseases. Furthermore, although PET imaging of neuroinflammation does not have an established clinical application, novel targets are under investigation and a small but growing number of studies have suggested that this imaging modality could have a role in drug development. Future studies are needed to further improve our knowledge of the cellular mechanisms that underlie changes in PET signal, how immune response contributes to neurological disease, and how it might be therapeutically modified.


Figures

Figure 1.
Figure 1.. Neuroinflammation
Relationship between neurons and glial cells (microglia and astrocytes). Microglia become activated in response to several immunological signals, including from cytokines and aggregated proteins. This activation may be either protective or toxic for the surrounding glial cells and neurons. Proteins expressed by glial cells are established and proposed targets for positron emission tomography (PET) imaging to quantify neuroinflammation (red text). Abbreviations: ATP: adenosine triphosphate; CX3CL1: CX3C chemokine ligand 1; TNF-alpha: tumor necrosis factor alpha; IL-6: interleukin-6; NO: nitric oxide; TSPO: 18 kDa translocator protein; COX: cyclooxygenase; P2X7R: P2X purinergic receptor 7; CSF-1R: colony stimulating factor 1 receptor; MAO-B: monoamine oxidase B. Modified with permission from.
Figure 2.
Figure 2.. TSPO and tau imaging: Alzheimer’s Disease (AD) versus Posterior Cortical Atrophy (PCA).
Topographical distribution of translocator protein (TSPO) resembles that of tau pathology in different clinical subtypes of Alzheimer’s disease (AD). Left panel: Surface-based projection maps showing differences in [11C]PBR28 binding (measured as standardized uptake value ratio (SUVR), cerebellar reference) between individuals with AD and age-matched controls for posterior cortical atrophy (PCA, a visual variant of AD, top) and typical amnestic presentation of AD (bottom). Contrast threshold is P < 0.05 after family-wise correction for multiple comparisons and TSPO genotype, age, and education as covariates. Color bars denote T-values. Right panel: Single-subject PET SUVR images from a separate study in which [18F]AV-1451 was used to label neurofibrillary tau deposits. Representative participants with PCA (top) or amnestic AD (bottom) are shown. [11C]PBR28 images adapted from and [18F]AV-1451 images adapted from. The [18F]AV-1451 images are printed and adapted by permission of Oxford University Press on behalf of the Guarantors of Brain. OUP and the Guarantors of Brain are not responsible or in any way liable for the accuracy of the adaptation.
Figure 3.
Figure 3.. TSPO imaging in Huntington’s Disease (HD) and Frontotemporal Dementia (FTD)
(A) Averaged [11C]PBR28 PET images from three controls and seven individuals with Huntington’s disease (HD). PET images represent standardized uptake value ratio (SUVR; normalized to whole brain activity) using images acquired 60–90 minutes post-injection. Increased binding in bilateral basal ganglia was found in the HD participants. (B) Representative [11C]PBR28 PET images from an individual with frontotemporal dementia (FTD) and an age-matched control, both high affinity binders. Images represent total distribution volume, corrected for free fraction of radioligand in plasma (VT/fP). Increased binding was most notable in frontal and temporal lobes. Adapted from., Reprinted with permission from, copyright 2018 American Chemical Society.
Figure 4.
Figure 4.. TSPO imaging of Chronic Traumatic Encephalopathy (CTE)
Compared to demographically- and genotype-matched controls, binding of [11C]DPA-713 in gray matter was 53% higher in the brains of former National Football League (NFL) players with the mixed affinity binding (MAB) genotype and 34% higher in NFL players with the high affinity binding (HAB) genotype. Comparative mean [11C]DPA-713 binding [total distribution volume (VT)] is displayed for individuals with the MAB genotype (upper panel, six controls, five NFL players) and those with the HAB genotype (lower panel, five controls, seven NFL players). Adapted from.

References

    1. Colonna M, Wang Y. TREM2 variants: new keys to decipher Alzheimer disease pathogenesis. Nat Rev Neurosci 2016; 17: 201–7. - PubMed
    1. Horti AG, Naik R, Foss CA, et al. PET imaging of microglia by targeting macrophage colony-stimulating factor 1 receptor (CSF1R). Proc Natl Acad Sci U S A 2019; 116(5): 1686–91. - PMC - PubMed
    1. Braestrup C, Squires RF. Specific benzodiazepine receptors in rat brain characterized by high-affinity (3H)diazepam binding. Proc Natl Acad Sci U S A 1977; 74: 3805–9. - PMC - PubMed
    1. Tournier BB, Tsartsalis S, Ceyzériat K, et al. Fluorescence-activated cell sorting to reveal the cell origin of radioligand binding. J Cereb Blood Flow Metab 2019; 40: 1242–55. - PMC - PubMed
    1. Nutma E, Stephenson JA, Gorter RP, et al. A quantitative neuropathological assessment of translocator protein expression in multiple sclerosis. Brain 2019; 142: 3440–55. - PMC - PubMed

Publication types