. 2021 Jan 7;28(1):79-95.e8.
doi: 10.1016/j.stem.2020.09.017. Epub 2020 Oct 23.

Derivation of Airway Basal Stem Cells from Human Pluripotent Stem Cells

Affiliations

Derivation of Airway Basal Stem Cells from Human Pluripotent Stem Cells

Finn J Hawkins et al. Cell Stem Cell. .

Abstract

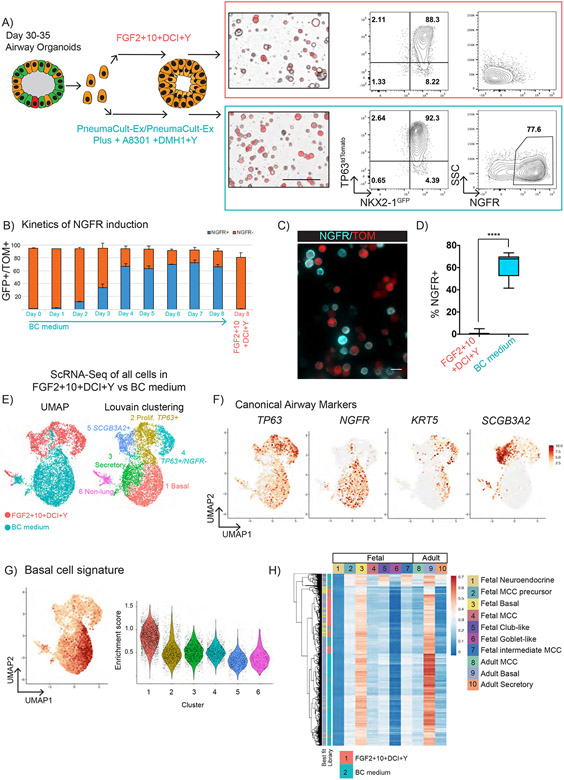
The derivation of tissue-specific stem cells from human induced pluripotent stem cells (iPSCs) would have broad reaching implications for regenerative medicine. Here, we report the directed differentiation of human iPSCs into airway basal cells ("iBCs"), a population resembling the stem cell of the airway epithelium. Using a dual fluorescent reporter system (NKX2-1GFP;TP63tdTomato), we track and purify these cells as they first emerge as developmentally immature NKX2-1GFP+ lung progenitors and subsequently augment a TP63 program during proximal airway epithelial patterning. In response to primary basal cell medium, NKX2-1GFP+/TP63tdTomato+ cells display the molecular and functional phenotype of airway basal cells, including the capacity to self-renew or undergo multi-lineage differentiation in vitro and in tracheal xenografts in vivo. iBCs and their differentiated progeny model perturbations that characterize acquired and genetic airway diseases, including the mucus metaplasia of asthma, chloride channel dysfunction of cystic fibrosis, and ciliary defects of primary ciliary dyskinesia.

Keywords: airway regeneration; basal cells; directed differentiation; induced pluripotent stem cells.


Conflict of interest statement

Declaration of Interests The authors declare no competing interests.

Figures

Figure 1:
Figure 1:. Generation of a dual fluorescent NKX2-1GFP;TP63tdTomato iPSC reporter to track and purify putative basal cells.
(A) Adult human airway immunolabeled with the antibodies indicated (DNA stained with Hoechst; scale bar=10μm). (B) Schematic of gene-editing strategy to insert tdTomato sequence into one allele of the TP63 locus of NKX2-1GFP iPSCs. See supplemental Figure 1 for further details. (C) Schematic of airway directed differentiation protocol. NKX2-1GFP+ cells are indicated in green, TP63tdTomato+ in red and co-expression in orange. (D) Representative image of BU3 NGPT spheroid on day 36 of differentiation demonstrating GFP and tdTomato fluorescence (scale bar=50μm). (E) Representative flow cytometry plots of NKX2-1GFP vs TP63tdTomato expression on days 0, 15 and 35 of directed differentiation. (F) Quantification of the percentage of cells, calculated by flow cytometry, co-expressing NKX2-1GFP and TP63tdTomato between days 15-16 and 40-42 of differentiation (n=6). (G) qRT-PCR quantification of TP63 mRNA levels (2−ΔΔCt) in GFP+/TOM+, GFP−TOM−, and GFP+/TOM− populations sorted by FACS compared to presort levels on day 36 of directed differentiation. (H) Immunolabeling of BU3 NGPT with antibodies against TP63 and RFP on day 30 of directed differentiation. The cells remained in 2D culture from day 15 to facilitate antibody labeling (DNA stained with DAPI; scale bar=50μm).
Figure 2:
Figure 2:. NKX2-1GFP+/TP63tdTomato+ cells adopt a molecular signature similar to primary basal cells.
(A) Schematic of experiment: GFP+/TOM+ sorted cells were suspended in 3D Matrigel between days 30-35 of differentiation in FGF2+FGF10+DCI+Y or primary BC media. After 12-14 days morphology and tdTomato fluorescence were assessed (left panel) and the expression of NKX2-1GFP, TP63tdTomato and NGFR quantified by flow cytometry (middle and right panel, representative plots). See supplemental Figure 2 for additional details. (B) Kinetics of NGFR induction, quantified by flow cytometry in response to primary BC medium compared to continued FGF2+FGF10+DCI+Y over 8 days between day 33-41 (n=3). (C) NGFR protein immunostaining (cyan) of BU3 NGPT cells in primary BC medium compared to TP63tdTomato fluorescence (scale bar=20μm). (D) Percentage of NGFR+ cells quantified by flow cytometry between day 40-50 (n=12). (E) ScRNA-Seq of day 46 cells from BC or FGF2+FGF10+DCI+Y media. UMAP (left panel) displays the distribution based on culture conditions used to treat cells. Louvain clustering (res = 0.25) identifies 6 clusters (1-6). (F) UMAP of canonical BC (TP63, NGFR, KRT5) and SC (SCGB3A2) markers. (G) UMAP of the expression of BC signature (left) and graph of BC gene signature enrichment score (“Basal”=0.84±0.24, “Proliferative TP63+”=0.52±0.24, “Secretory”= 0.51±0.18 “TP63+/NGFR−”=0.51±0.15, and “SCGB3A2+”=0.32±0.15, mean enrichment score±SD). See also Figures S3, S4. (H) Heatmap showing all calculated pairwise Pearson’s correlation coefficients between freshly isolated primary human airway cells (without culturing) and all iPSC-derived cells on day 46 grown in either FGF2+FGF10+DCI+Y or BC medium. Ten fetal and adult primary airway epithelial cell types are shown. Colors of the best fit annotation represent the epithelial cell type with the highest PCCs for each iBC in each cultured sample.
Figure 3:
Figure 3:. iBCs undergo self-renewal and multi-lineage differentiation.
(A) Schematic of experiment: GFP+/TOM+ cells sorted on approximately day 40 of differentiation expanded in BC medium and then characterized in terms of self-renewal and multi-lineage differentiation in ALI. (B) Representative flow cytometry plots of NKX2-1GFP vs TP63tdTomato expression in cells at passage 7, following expansion in 3D culture with BC medium (left panel). Per input sorted GFP+/Tom+ cell on day 45 we calculated the yield up to 123 days of directed differentiation (right panel). (C) Immunolabeling of representative spheroid on day 83 of differentiation in either BC medium (left and middle panel) or after 10 days in ALI differentiation medium (right panel) with antibodies indicated (DNA stained with Hoechst; scale bar=50μm). See also Figure S5D. (D-E) GFP+/TOM+ cells were expanded in BC medium until day 46 and plated on Transwells with (E) or without (D) GFP/TOM/NGFR sorting. Representative images of the endogenous TP63tdTomato fluorescence during culture of BU3 NGPT-derived ALI. Stitched image of whole Transwell insert (Ø =6.5mm) (1st column) and zoom-in (2nd column). Immunolabeling with antibodies indicated after 16 days of ALI culture. (3rd and 4th columns) (DNA stained with DRAQ5; scale bar =100μm). (F) Confocal microscopy of BU3 NGPT-derived ALI cultures shown in E and immunolabeled with antibodies indicated (DNA stained with DRAQ5; scale bar =100μm). (G) Transverse section of BU3 NGPT-derived ALI cultures shown in E and stained with hematoxylin and eosin or antibodies indicated (DNA stained with DAPI; scale bar=100μm). (H) TEER measurements of Transwell ALI cultures, comparing GFP+/TOM+ from FGF2+10+DCI+Y (n=5), BC medium with (N=4) or without (n=5) NGFR sorting and primary HBEC controls (n=21). (I) TP63tdTomato fluorescence in BU3 NGPT iBCs after cryopreservation and thaw (scale bar=200μm) (left panel). Immunolabeling of ALI cultures generated from cryopreserved iBCs with antibodies indicated (scale bar=100μm).
Figure 4:
Figure 4:. scRNA-Seq profiling of iBCs and their differentiated progeny.
(A) Schematic of scRNA-Seq experiment and UMAP with Louvain clustering (clusters 1-6) of iBC-derived ALI. See also Figures S4 and S7. (B) Top 20 differentially expressed genes (DEG) per cluster. (C) UMAPs of primary BC, SC and MCC gene-signatures applied to iBC-derived ALI (upper row). Violin plots of the enrichment score of clusters 1-6 for BC, SC and MCC gene signatures (lower panel). (D) UMAPs of the canonical BC, SC, and MCC markers across clusters 1-6. (E) Violin gene-expression plots of same panel of markers shown in (D). (F) qRT-PCR validation of key airway markers in iBC-derived ALI (iBC-ALI) compared to primary HBEC-derived ALI (HBEC-ALI) in PneumaCult ALI medium. Fold change is 2−ΔΔCt normalized to undifferentiated iPSCs. (*=p<0.05, **=p<0.01)
Figure 5:
Figure 5:. iBCs establish pseudostratified, well-differentiated airway epithelium in vivo in tracheal xenografts.
(A) Schematic of experimental procedure used to generate tracheal xenografts. (B) Magnified image (left panel, scale bar = 50μm) of xenograft epithelium established from BU3 NGPT iBCs stained with hematoxylin and eosin; the location of this region within the transverse section of the xenograft is shown in the right panel. White arrows indicate examples of MCCs. (C) Immunolabeling of the xenograft epithelium with the indicated antibodies. Anti-GFP and anti-RFP antibodies were used to detect the expression of each fluorochrome reporter that had been targeted to the donor human cell loci, NKX2-1GFP and TP63tdTomato respectively. DAPI staining indicates DNA (scale bar = 50μm).
Figure 6:
Figure 6:. A surface marker strategy for purifying iBCs using NGFR replaces the need for fluorescent reporters.
(A) Schematic of NKX2-1GFP/TP63tdTomato reporter vs surface marker iBC protocols. (B) Representative flow cytometry plots of BU3 NGPT iBCs on day 40 of differentiation and labeled with antibodies against NGFR and EpCAM. Red arrow indicates sorted NGFR+/EpCAM+ cells are 94.5% GFP+/TOM+. Enrichment is quantified in the right panel (n=3). (C) Representative images of the endogenous TP63tdTomato fluorescence in whole Transwell filters (Ø =6.5mm) seeded with sorted (NGFR+/EpCAM+) or unsorted cells during submerged culture and after ALI culture. (D) Representative flow cytometry plot of a non-reporter iPSC line (DD001m) stained for NGFR is shown. (E) Representative image of sorted NGFR+ cells plated on Transwell filters and after 7 days immunolabeled with an anti-TP63 antibody (DNA stained with Hoechst; scale bar=100μm). (F) Confocal microscopy of DD001m iPSC-derived ALI cultures immunolabeled with antibodies indicated (scale bar=200μm). (G) Representative image of RUES2 ESC-derived ALI immunolabeled with an anti-ACT antibody (DNA stained with DRAQ5; scale bar=200μm) (upper left) and confocal microscopy of it immunolabeled with antibodies indicated (DNA stained with DRAQ5; scale bar=100μm).
Figure 7:
Figure 7:. iBCs enable in vitro modeling of asthma, cystic fibrosis, and primary ciliary dyskinesia.
(A) Representative images of BU3 NGPT iBC-derived ALI cultures, with or without IL-13 treatment, immunolabeled with antibodies indicated (DNA stained with Hoechst; scale bar=200μm). (B) Quantification of the number of MUC5AC+ cells per high power field for IL13 treated vs untreated wells (n=3). (C) qRT-PCR quantification of mRNA expression levels of MUC5AC, SPDEF and MUC5B in IL-13 treated (+IL-13) vs untreated cells (No IL-13) (n=3). Data are preselected as fold change over untreated iBC-derived ALI cultures (*=p<0.05, **=p<0.01, ***=p<0.001). (D) Schematic of CF and PCD disease modeling experiments, relying on surface markers. See also Figures S7F-G. (E) Representative electrophysiological traces from Ussing chamber analysis of ALI cultures generated from CF iPSCs and corrected CF iPSCs (Corr CF). (F) Mean and SD of electrophysiological values from E (n=3). (G) Immunolabeling of MCCs in ALI cultures generated from DNAH5 mutant nasal epithelial cells, iPSCs, non-diseased primary HBECs and BU3 NGPT iPSCs with antibodies indicated (DNA stained with DAPI; scale bar=10μm). Transmission electron microscopy of cilia (right column). H-I) The number of outer dynein arms detected in cross sections of cilia (H) or ciliary beat frequency (I) from the samples detailed in G. (***=p<0.001).

References

    1. Berical A, Lee RE, Randell SH, and Hawkins F (2019). Challenges Facing Airway Epithelial Cell-Based Therapy for Cystic Fibrosis. Front Pharmacol 10, 74. - PMC - PubMed
    1. Butler A, Hoffman P, Smibert P, Papalexi E, and Satija R (2018). Integrating single-cell transcriptomic data across different conditions, technologies, and species. Nat. Biotechnol 36, 411–420. - PMC - PubMed
    1. Carraro G, Langerman J, Sabri S, Lorenzana Z, Purkayastha A, Konda B, Aros CJ, Calvert BA, Szymaniak A, Wilson E, et al. (2020a). A molecular atlas of proximal airway identifies subsets of known airway cell types revealing details of the unique molecular pathogenesis of Cystic Fibrosis. 499, 1–23.
    1. Carraro G, Mulay A, Yao C, Mizuno T, Konda B, Petrov M, Lafkas D, Arron JR, Hogaboam CM, Chen P, et al. (2020b). Single Cell Reconstruction of Human Basal Cell Diversity in Normal and IPF Lung. American Journal of Respiratory and Critical Care Medicine rccm.201904–0792OC-53. - PMC - PubMed
    1. Chen Y-W, Huang SX, de Carvalho ALRT, Ho S-H, Islam MN, Volpi S, Notarangelo LD, Ciancanelli M, Casanova J-L, Bhattacharya J, et al. (2017). A three-dimensional model of human lung development and disease from pluripotent stem cells. Nat. Cell Biol 19, 542–549. - PMC - PubMed

Publication types