. 2020 Oct;36(4):711-718.
doi: 10.1007/s12288-020-01272-1. Epub 2020 Mar 3.

Splenectomy Modulates the Erythrocyte Turnover and Basigin (CD147) Expression in Mice

Affiliations

Splenectomy Modulates the Erythrocyte Turnover and Basigin (CD147) Expression in Mice

Nitin Bhardwaj et al. Indian J Hematol Blood Transfus. 2020 Oct.

Abstract

The present study was designed to study the splenectomy induced modulation of erythrocyte turnover in mice. We have also studied the modulation of reactive oxygen species (ROS) and basigin (CD147) expression level on erythrocytes in splenectomized condition. The erythrocyte turnover was studied by a newly developed double in vivo biotinylation (DIB) technique. This technique enables to discriminate three different age (young, intermediate and old) groups of erythrocytes. The expression level of ROS and CD147 was studied by staining with CM-H2DCFDA stain and anti-mouse CD147 monocloclonal antibody followed by flow cytometry. We observed that intermediate and old age groups of erythrocytes were randomly eliminated in splenectomized condition. A marked surge in the blood reticulocyte count was observed in splenectomized mice. Splenectomy induced the level of ROS and CD147 expression on erythrocytes. The expression level of ROS was induced up to 35 days, but it reversed to basal level by 42 days indicating the emergence of refractoriness to splenectomy. The CD147 expression was significantly higher on day 7, 21 and 28 but it also normalizes on later time points. We conclude that erythrocyte turnover is significantly modulated in splenectomized mice. The enhanced level of ROS and CD147 expression may be a possible cause to increase erythrocyte removal in splenectomized mice.

Keywords: Basigin; Double in vivo biotinylation; Erythrocyte; Flow cytometry; Reactive oxygen species; Splenectomy.


Conflict of interest statement

Conflict of interestThe authors declare no conflict of interest.

Figures

Fig. 1
Fig. 1
Modulation of erythrocytes turnover in splenectomized mice. Mice were labeled according to double in vivo biotinylation (DIB) protocol. Briefly, mice were administered intravenously three daily doses of 1 mg biotin-X-NHS Ester (BXN) (first biotinylation step). After 5 days rest, a single additional dose of 0.6 mg BXN was administered intravenously (second biotinylation step). Blood samples were collected at different time points (2, 7, 14, 21, 28, 35 and 42 days of second biotinylation step) and different aged groups of erythrocyte were estimated by distribution of biotin label on erythrocytes by staining the cells with streptavidin-APC and flow cytometric analysis. Box-Y in a and b contain erythrocytes that entered the circulation between the first and second biotinylation step in control and splenectomized mice, respectively. The erythrocytes younger than Y are in box-X (biotinnegative population). The box-Z (biotinhigh population) represents the erythrocytes population older than the population in box-Y. Dot-blot a and b shows the distribution of all three different aged groups of erythrocytes in control and splenectomized group after 14 days of second biotinylation step. c and d show the survival kinetics of biotinnegative (young aged population) and biotinhigh (old aged populations) of erythrocytes in blood of control and splenectomized group. Values in parentheses represent percentage of cells. Data is represented as mean ± SEM; n = 5 in control and 5–6 in splenectomized groups. *p < 0.05, **p < 0.005 and ***p < 0.0005
Fig. 2
Fig. 2
Changes in relative proportions of reticulocytes in splenectomized mice. Blood samples were collected at indicated time points and proportion of reticulocytes at different time points was determined by staining with the anti-mouse CD71 antibody followed by flow cytometric analysis. Histograms in a (control) and b (splenectomized) show the changes in proportions of reticulocytes after 2 days of resting period. Box-X and Y in a and b represents erythrocytes and reticulocytes in control and splenectomized mice, respectively. Bar graph in c shows the cumulative changes in reticulocytes proportion at different time points. Data is represented as mean ± SEM; n = 5 in control and 6–8 in splenectomized group. *p < 0.05 and **p < 0.005
Fig. 3
Fig. 3
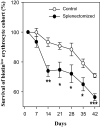
Survival kinetics of intermediate aged erythrocytes cohort in splenectomized mice. Mice were labeled according to DIB protocol as described earlier. Blood samples were collected from DIB labeled splenectomized and control mice at different time points of second biotin dose. The proportion of erythrocytes cohort (biotinlow Intermediate aged erythrocytes) as percentage of all erythrocytes was determined after staining with streptavidin–APC followed by flow cytometric analysis. Proportions of biotinlow cohort of erythrocytes in blood for control and splenectomized are shown. Data is represented as mean ± SEM; n = 5 in control and 5–6 in splenectomized groups. *p < 0.05, **p < 0.005 and ***p < 0.0005
Fig. 4
Fig. 4
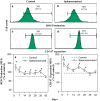
Time kinetics of changes in ROS and CD147 expression on erythrocytes in splenectomized mice. Blood samples were collected at indicated time point. The expression levels of ROS and CD147 were measured by staining with CMH2DCFDA and anti-mouse CD147-FITC monoclonal antibody followed by flow cytometric analysis. Representative Histograms in a, c and b, d show the expression level of ROS and CD147 in control and splenectomized mice, respectively. Summarized time kinetics data from 6 mice showing the relative level of ROS and CD147 in erythrocytes have been shown in e and f. The relative expression of ROS and CD147 measured by considering the expression in control erythrocytes as 100. Data is represented as mean ± SEM. *p < 0.05 and **p < 0.005

Similar articles

Cited by

References

    1. Goodman JW, Smith LH. Erythrocyte life span in normal mice and in radiation bone marrow chimeras. Am J Physiol. 1961;200:764–770. doi: 10.1152/ajplegacy.1961.200.4.764. - DOI - PubMed
    1. Clark MR. Senescence of red blood cells: progress and problems. Physiol Rev. 1988;68(2):503–554. doi: 10.1152/physrev.1988.68.2.503. - DOI - PubMed
    1. Rifkind RA. Destruction of injured red cells in vivo. Am J Med. 1966;41(5):711–723. doi: 10.1016/0002-9343(66)90032-5. - DOI - PubMed
    1. Rosse WF, Dourmashkin R, Humphrey JH. Immune lysis of normal human and paroxysmal nocturnal hemoglobinuria (PNH) red blood cells. 3. The membrane defects caused by complement lysis. J Exp Med. 1966;123(6):969–984. doi: 10.1084/jem.123.6.969. - DOI - PMC - PubMed
    1. Sheftel AD, Kim SF, Ponka P. Non-heme induction of heme oxygenase-1 does not alter cellular iron metabolism. J Biol Chem. 2007;282(14):10480–10486. doi: 10.1074/jbc.M700240200. - DOI - PubMed

LinkOut - more resources