

doi: 10.7171/jbt.20-3104-004.
High-throughput Minitaturized RNA-Seq Library Preparation
Affiliations
- PMID: 33100919
- PMCID: PMC7566612
- DOI: 10.7171/jbt.20-3104-004
Item in Clipboard
High-throughput Minitaturized RNA-Seq Library Preparation
J Biomol Tech.
2020 Dec.
Abstract
Advances in next-generation sequencing technologies have allowed RNA sequencing to become an increasingly time efficient, cost-effective, and accessible tool for genomic research. We present here an automated and miniaturized workflow for RNA library preparation that minimizes reagent usage and processing time required per sample to generate Illumina compatible libraries for sequencing. The reduced-volume libraries show similar behavior to full-scale libraries with comparable numbers of genes detected and reproducible clustering of samples.
Keywords: Sequencing, automation, Illumina.
© Association of Biomolecular Resource Facilities.
Figures
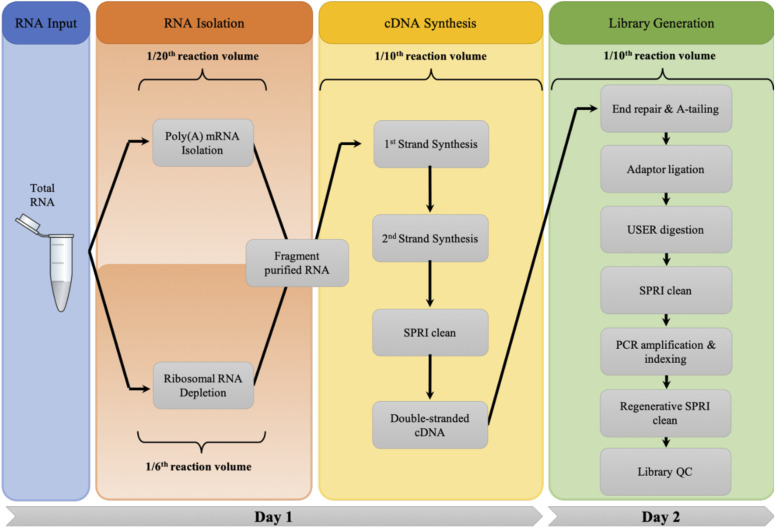
Automated library preparation workflow. Workflow of the automated, miniaturized RNA library preparation protocol including both RNA isolation methods, which converge at RNA fragmentation and processed identically thereafter. Reduction in reaction size is listed for each distinct phase of the library preparation process.

Performance of kit is sustained following the miniaturized protocol. Comparison of quality-control metrics between manual (Gray) and automated (Blue) libraries. A) Example Fragment Analyzer traces of libraries following poly(A) isolation from 100 ng UHR RNA. B) Example Fragment Analyzer traces of libraries following rRNA depletion from 100 ng UHR RNA. C) Percent average rRNA contamination. D) Directionality of libraries determined by average sense/antisense ratio. E) Average number of genes detected. F) Transcriptomic mapping efficiency demonstrated by the average relative abundance of exonic to intergenic reads.

Integrity of sequencing data is maintained following miniaturized prep of real RNA samples. Heat map and hierarchical clustering analysis of protein-coding gene expression from biological samples (n = 10) following manual and automated library preparation (depicted as log2-transformed reads per kilobase of modeled exon per million mapped reads, RPKM). Expression levels are represented as percentile of RPKM values across the whole dataset (corresponding raw RPKM values are indicated under the color scale: blue, low expression; yellow, high expression). Sample labels (cultured cells, orange and purple; T cells, pink and green) and library preparation methods are indicated at the top (manual, gray; automated, blue). Dendrograms represent hierarchical clustering of samples and genes. Solid white line indicates clustering according to cell type and dotted white line indicates separate cluster due to sample dropout.
References
-
- Metzker ML. Sequencing technologies - the next generation. Nat Rev Genet. 2010;11:31–46. - PubMed
Publication types
MeSH terms
Substances
Grants and funding
LinkOut - more resources
Full Text Sources